Overview
GKE (Google Kubernetes Engine) is a managed Kubernetes service provided by Google that simplifies the deployment, management, and operation of Kubernetes clusters.
Prerequisites
- GKE cluster
- Install
kubectlto access the GKE cluster. - Install Helm
Quick Start
Check that the nodes in your GKE clusters are in Ready state:

GKE cluster status
Step 1: Add the SigNoz helm repo using this command
helm repo add SigNoz https://charts.signoz.io
Step 2: Install Otel Agent and Deployment using signoz/k8s-infra Helm chart.
helm install -n signoz  --create-namespace kubelet-otel signoz/k8s-infra \\
--set signozApiKey=<ingestionKey> --set otelCollectorEndpoint="ingest.<region>.signoz.cloud:443" --set otelInsecure=false
After applying the above commands, check whether the signoz namespace pods are running successfully or not:
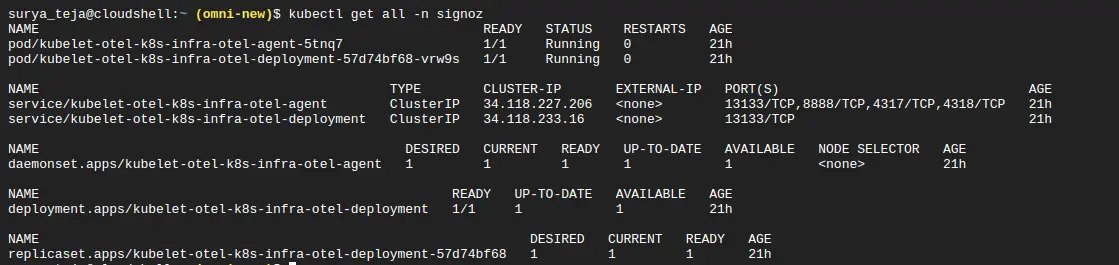
Resources status
If running, it should start sending logs and metrics to SigNoz.
Afterward, you could create a pod to check to validate whether the logs and metrics are being sent successfully to SigNoz Cloud.
kubectl run -n signoz test –image=nginx –port=80
Visualize the logs and metrics in SigNoz Cloud
To visualize logs:
Go to your SigNoz UI, and navigate to the SigNoz dashboard. Click on the Logs section to view the logs
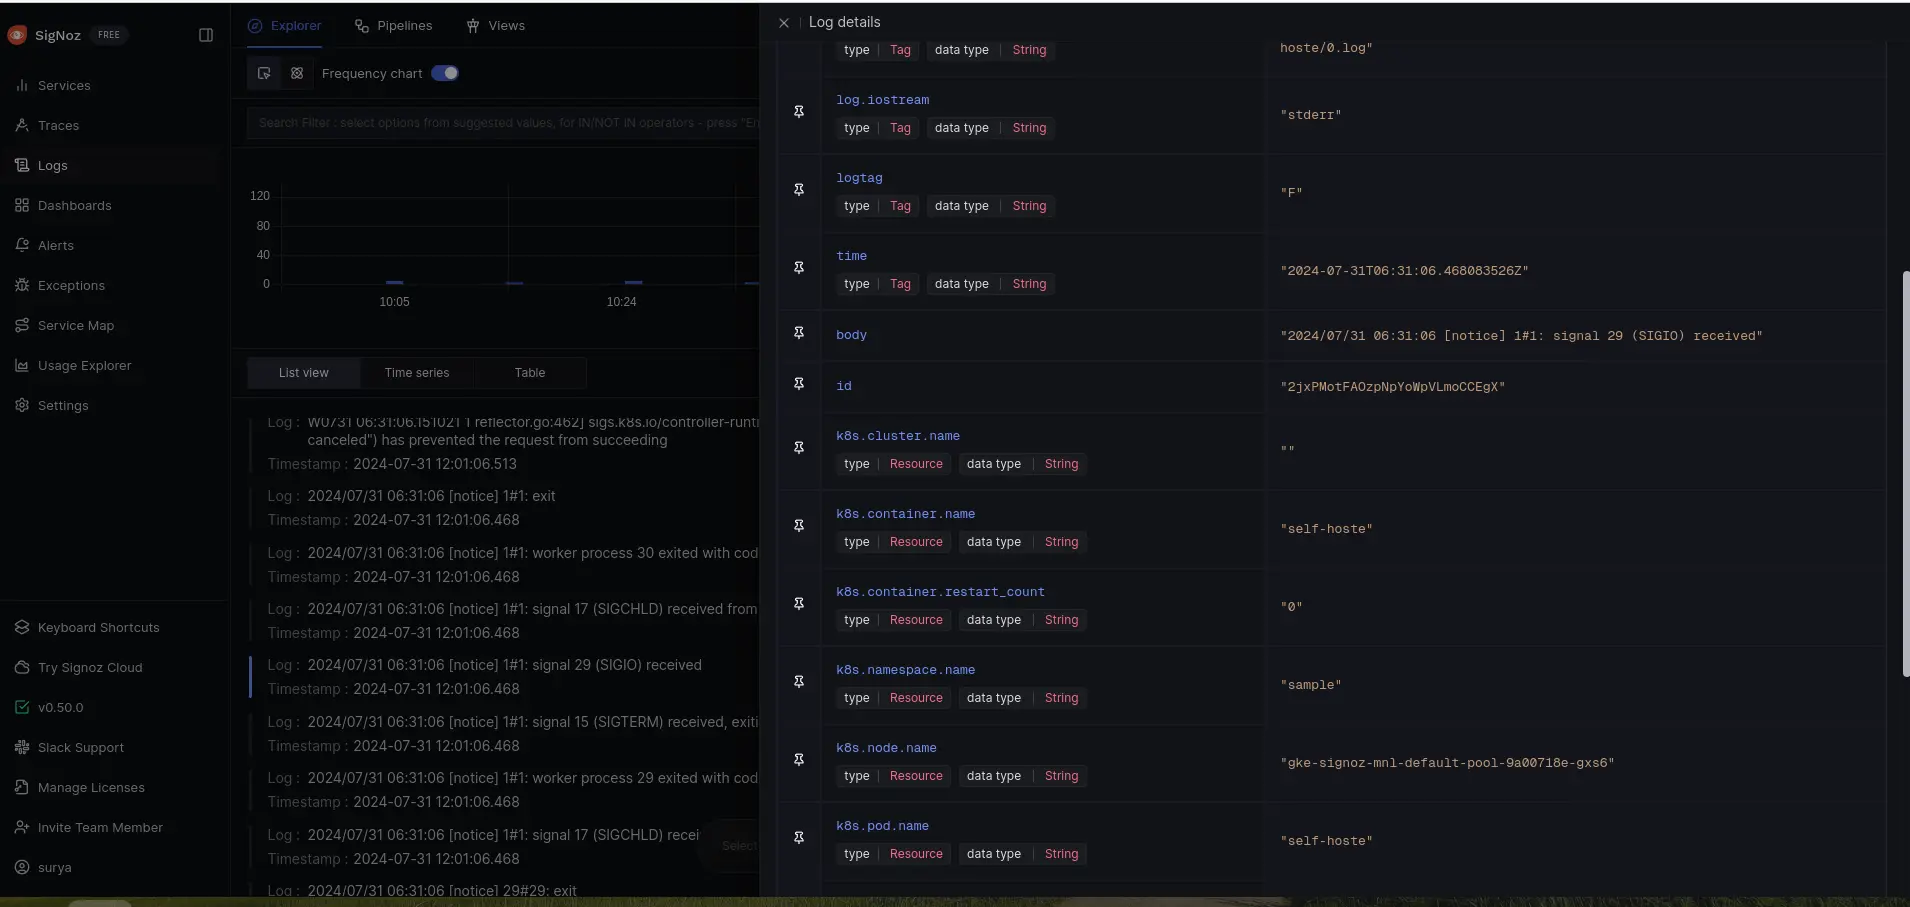
View logs in SigNoz dashboard
For metrics:
- Log in to your SigNoz cloud account.
- Navigate to the Dashboards, and add a dashboard
- Add a Timeseries Panel
- In Metrics, select any metric
- In Filter, put name = mention service name
- Hit “Save Changes”.
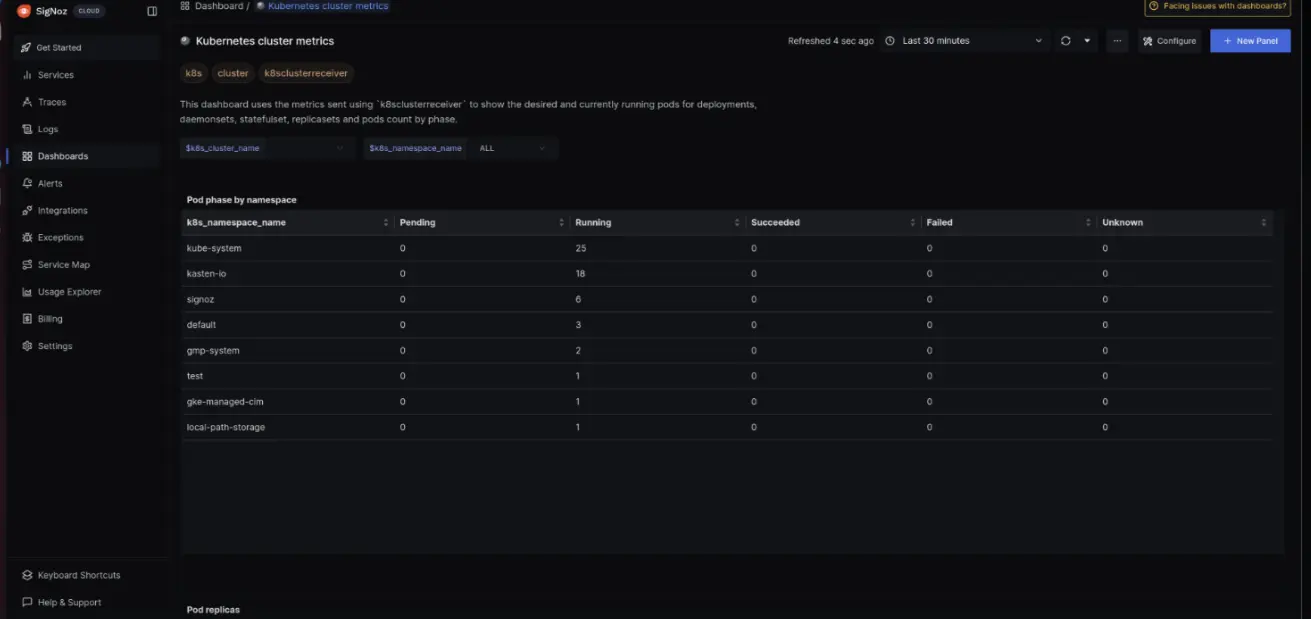
Kubernetes cluster metrics
After saving changes, it should start showing collected metrics.
Troubleshooting
If you encounter any issues while setting up logging and metrics for your GKE cluster, follow these troubleshooting steps:
-
Check the logs of the OpenTelemetry Collector:
kubectl logs -f -n signoz -l app.kubernetes.io/component=otel-agentReview the logs for any error messages or indications of misconfiguration.
-
Verify the rendered configuration:
kubectl get cm/kubelet-otel-k8s-infra-otel-agent -n signoz -o yamlEnsure the configuration matches your expected settings, including the SigNoz API key and the OpenTelemetry Collector endpoint.
-
Confirm that the necessary Kubernetes resources are created:
kubectl get pods,services,configmaps -n signozCheck if the required pods, services, and config maps are running and in a healthy state.
-
Verify network connectivity:
- Ensure that the GKE cluster has network access to the SigNoz ingestion endpoint (
ingest.<region>.signoz.cloud:443). - Check if there are any network security groups or firewalls blocking the required ports.
- Ensure that the GKE cluster has network access to the SigNoz ingestion endpoint (
-
Double-check the SigNoz API key:
- Confirm that the provided
signozApiKeyis correct and has the necessary permissions to ingest data.
- Confirm that the provided
Prerequisites
- GKE cluster
- Install
kubectlto access the GKE cluster. - Install Helm
- Self-Hosted SigNoz in GKE Cluster (If you are hosting SigNoz in Google Kubernetes Engine (GKE), you should refer to the specific guide that outlines the minimum requirements and provides details for the override-values.yaml OR if you're hosting SigNoz on VM, follow self-hosted SigNoz on VM ).
Quick Start
Check that the nodes in your GKE clusters are in Ready state:
GKE cluster status
Step 1: Add the SigNoz helm repo using this command
helm repo add SigNoz https://charts.signoz.io
Step 2: Install the Otel Collector agent in GKE where SigNoz is running in a Self-hosted VM.
helm --namespace signoz install my-release signoz/signoz -f override-values.yaml
After applying the above commands, check whether the pods are running successfully or not
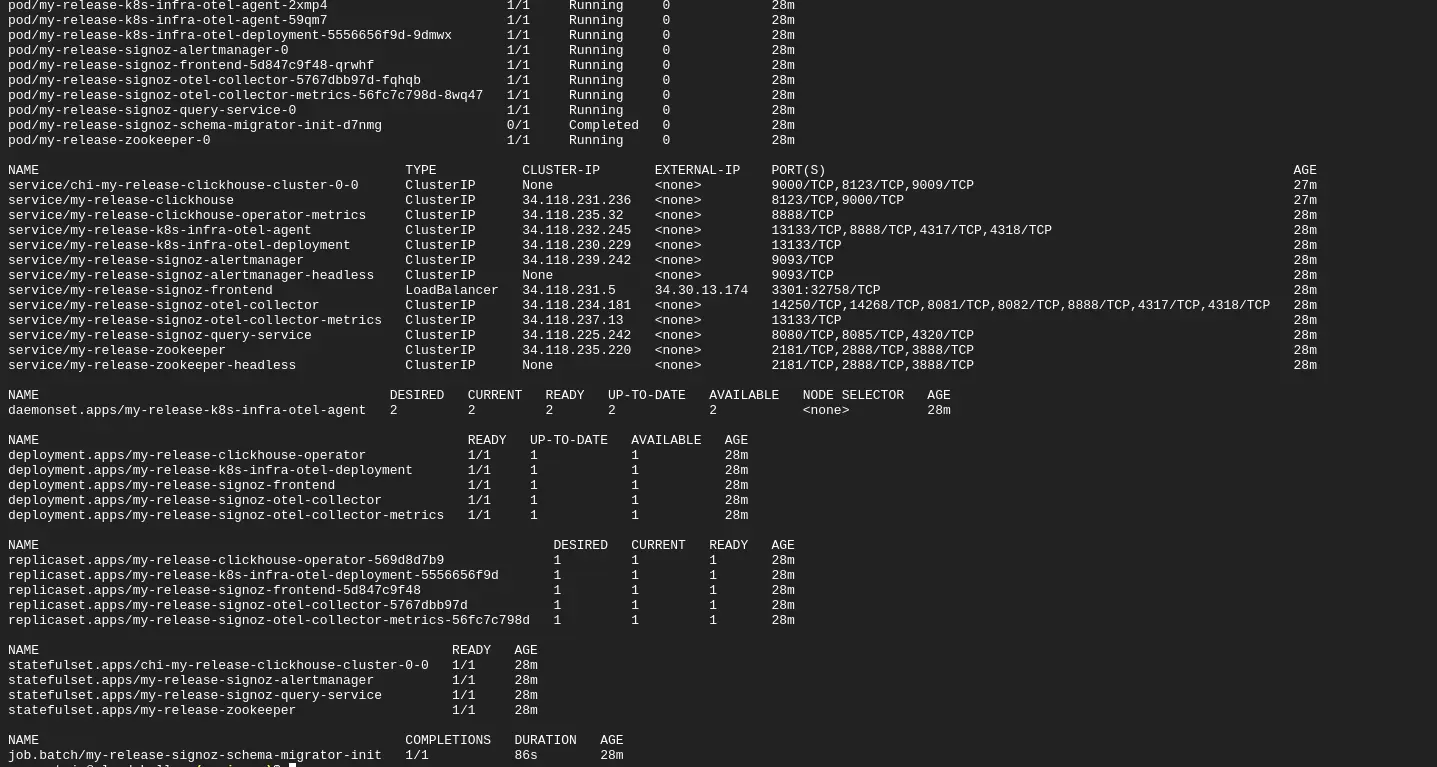
Resources status
If running,This should start sending logs and metrics to SigNoz.
Step 2: Install the Otel Collector agent in GKE where SigNoz is running in a Self-hosted VM.
helm install -n signoz  --create-namespace kubelet-otel signoz/k8s-infra \\
otelCollectorEndpoint="<self-host-signoz-vm-ip>:4317" --set otelInsecure=true
After applying the above commands, check whether the pods are running successfully or not
Resources status
If running,This should start sending logs and metrics to SigNoz.
Now, create some pods to check that the logs and metrics are being sent successfully to SigNoz Self-Host:
kubectl run -n signoz test –image=nginx –port=80
Visualize the logs and metrics in SigNoz Cloud
For logs:
Visualize logs in SigNoz dashboard
Go to your SigNoz UI, and navigate to the SigNoz dashboard. Click on the Logs section to view the logs
For metrics:
- Log in to your SigNoz cloud account.
- Navigate to the Dashboards, and add a dashboard
- Add a Timeseries Panel
- In Metrics, select any metric
- In Filter, say name = mention service name
- Hit “Save Changes”.
Kubernetes cluster metrics
Troubleshooting
If you encounter any issues while setting up logging and metrics for your GKE cluster, follow these troubleshooting steps:
-
Confirm that the necessary Kubernetes resources are created:
kubectl get pods,services,configmaps -n platformCheck if the required pods, services, and config maps are running and in a healthy state.
-
Check the logs of the OpenTelemetry Collector:
kubectl logs -f -n signoz -l app.kubernetes.io/component=otel-agentReview the logs for any error messages or indications of misconfiguration.
-
Verify the rendered configuration:
kubectl get cm/kubelet-otel-k8s-infra-otel-agent -n signoz -o yamlEnsure the configuration matches your expected settings, including the SigNoz API key and the OpenTelemetry Collector endpoint.
-
Confirm that the necessary Kubernetes resources are created:
kubectl get pods,services,configmaps -n signozCheck if the required pods, services, and config maps are running and in a healthy state.
-
Verify network connectivity:
- Ensure that the GKE cluster has network access to the SigNoz ingestion endpoint (Self-Hosted SigNoz VM IP:4317).
- Check if there are any network security groups or firewalls blocking the required ports.
-
Check the SigNoz Self-Host VM
- Confirm that all the SigNoz related services are running properly on the VM or not.
