Overview
This guide walks you through setting up monitoring and observability for xAI Grok using OpenTelemetry and exporting traces, logs, and metrics to SigNoz. With this integration, you can observe various metrics for your xAI Grok applications and llm usage.
Monitoring xAI Grok in your AI applications with telemetry ensures full observability across your AI and LLM workflows. By leveraging SigNoz, you can analyze correlated traces, logs, and metrics in unified dashboards, configure alerts, and gain actionable insights to continuously improve reliability, responsiveness, and user experience.
Prerequisites
- A SigNoz Cloud account with an active ingestion key or Self Hosted SigNoz instance
- Internet access to send telemetry data to SigNoz Cloud
- Python 3.10+ with
xai-sdkinstalled - For Python:
pipinstalled for managing Python packages - A Grok API key. You can get it from xAi platform
Monitoring xAI Grok
For more information on getting started with Grok in your Python environment, refer to the Grok Python README.
No code auto-instrumentation is recommended for quick setup with minimal code changes. It's ideal when you want to get observability up and running without modifying your application code and are leveraging standard instrumentor libraries.
Step 1: Install the necessary packages in your Python environment.
pip install \
  opentelemetry-distro \
  opentelemetry-exporter-otlp \
  httpx \
  opentelemetry-instrumentation-httpx \
  opentelemetry-instrumentation-system-metrics \
  xai-sdk
Step 2: Add Automatic Instrumentation
opentelemetry-bootstrap --action=install
Step 3: Create an example xAI Grok application
import os
from xai_sdk import Client
from xai_sdk.chat import user, system


client = Client(
    api_key=os.getenv("XAI_API_KEY"),
    timeout=3600, # Override default timeout with longer timeout for reasoning models
)


chat = client.chat.create(model="grok-4")
chat.append(system("You are Grok, a highly intelligent, helpful AI assistant."))
chat.append(user("What is SigNoz"))
response = chat.sample()
print(response.content)
Before running this code, ensure that you have set the environment variable XAI_API_KEY with your generated Grok API key.
Step 4: Run your application with auto-instrumentation
Run your application with the following environment variables set. This configures OpenTelemetry to export traces, logs, and metrics to SigNoz Cloud and enables automatic log correlation:
OTEL_RESOURCE_ATTRIBUTES="service.name=<service_name>" \
OTEL_EXPORTER_OTLP_ENDPOINT="https://ingest.<region>.signoz.cloud:443" \
OTEL_EXPORTER_OTLP_HEADERS="signoz-ingestion-key=<your-ingestion-key>" \
OTEL_EXPORTER_OTLP_PROTOCOL=grpc \
OTEL_TRACES_EXPORTER=otlp \
OTEL_METRICS_EXPORTER=otlp \
OTEL_LOGS_EXPORTER=otlp \
OTEL_PYTHON_LOG_CORRELATION=true \
OTEL_PYTHON_LOGGING_AUTO_INSTRUMENTATION_ENABLED=true \
opentelemetry-instrument <your_run_command>
<service_name>is the name of your service<region>: Your SigNoz Cloud region<your-ingestion-key>: Your SigNoz ingestion key- Replace
<your_run_command>with the actual command you would use to run your application. In this case we would use:python main.py
Using self-hosted SigNoz? Most steps are identical. To adapt this guide, update the endpoint and remove the ingestion key header as shown in Cloud → Self-Hosted.
Code-based manual instrumentation gives you fine-grained control over your telemetry configuration. Use this approach when you need to customize resource attributes, sampling strategies, or integrate with existing observability infrastructure.
Step 1: Install additional OpenTelemetry dependencies
pip install \
  opentelemetry-api \
  opentelemetry-sdk \
  opentelemetry-exporter-otlp \
  opentelemetry-instrumentation-httpx \
  opentelemetry-instrumentation-system-metrics \
  xai-sdk
Step 2: Import the necessary modules in your Python application
Traces:
from opentelemetry import trace
from opentelemetry.sdk.resources import Resource
from opentelemetry.sdk.trace import TracerProvider
from opentelemetry.sdk.trace.export import BatchSpanProcessor
from opentelemetry.exporter.otlp.proto.http.trace_exporter import OTLPSpanExporter
Metrics:
from opentelemetry.sdk.metrics import MeterProvider
from opentelemetry.exporter.otlp.proto.http.metric_exporter import OTLPMetricExporter
from opentelemetry.sdk.metrics.export import PeriodicExportingMetricReader
from opentelemetry import metrics
from opentelemetry.instrumentation.system_metrics import SystemMetricsInstrumentor
from opentelemetry.instrumentation.httpx import HTTPXClientInstrumentor
Step 3: Set up Traces
from opentelemetry.sdk.resources import Resource
from opentelemetry.sdk.trace import TracerProvider
from opentelemetry.sdk.trace.export import BatchSpanProcessor
from opentelemetry.exporter.otlp.proto.http.trace_exporter import OTLPSpanExporter
from opentelemetry import trace
import os


resource = Resource.create({"service.name": "<service_name>"})
provider = TracerProvider(resource=resource)
span_exporter = OTLPSpanExporter(
    endpoint= os.getenv("OTEL_EXPORTER_TRACES_ENDPOINT"),
    headers={"signoz-ingestion-key": os.getenv("SIGNOZ_INGESTION_KEY")},
)
processor = BatchSpanProcessor(span_exporter)
provider.add_span_processor(processor)
trace.set_tracer_provider(provider)
<service_name>is the name of your serviceOTEL_EXPORTER_TRACES_ENDPOINT→ SigNoz Cloud trace endpoint with appropriate region:https://ingest.<region>.signoz.cloud:443/v1/tracesSIGNOZ_INGESTION_KEY→ Your SigNoz ingestion key
Using self-hosted SigNoz? Most steps are identical. To adapt this guide, update the endpoint and remove the ingestion key header as shown in Cloud → Self-Hosted.
Step 4: Set up Metrics
from opentelemetry.sdk.resources import Resource
from opentelemetry.sdk.metrics import MeterProvider
from opentelemetry.exporter.otlp.proto.http.metric_exporter import OTLPMetricExporter
from opentelemetry.sdk.metrics.export import PeriodicExportingMetricReader
from opentelemetry import metrics
from opentelemetry.instrumentation.system_metrics import SystemMetricsInstrumentor
from opentelemetry.instrumentation.httpx import HTTPXClientInstrumentor
import os

resource = Resource.create({"service.name": "<service-name>"})
metric_exporter = OTLPMetricExporter(
    endpoint= os.getenv("OTEL_EXPORTER_METRICS_ENDPOINT"),
    headers={"signoz-ingestion-key": os.getenv("SIGNOZ_INGESTION_KEY")},
)
reader = PeriodicExportingMetricReader(metric_exporter)
metric_provider = MeterProvider(metric_readers=[reader], resource=resource)
metrics.set_meter_provider(metric_provider)

meter = metrics.get_meter(__name__)

# turn on out-of-the-box metrics
SystemMetricsInstrumentor().instrument()
HTTPXClientInstrumentor().instrument()
<service_name>is the name of your serviceOTEL_EXPORTER_METRICS_ENDPOINT→ SigNoz Cloud endpoint with appropriate region:https://ingest.<region>.signoz.cloud:443/v1/metricsSIGNOZ_INGESTION_KEY→ Your SigNoz ingestion key
Using self-hosted SigNoz? Most steps are identical. To adapt this guide, update the endpoint and remove the ingestion key header as shown in Cloud → Self-Hosted.
SystemMetricsInstrumentor provides system metrics (CPU, memory, etc.), and HTTPXClientInstrumentor provides outbound HTTP request metrics such as request duration. If you want to add custom metrics to your Grok application, see Python Custom Metrics.
Step 5: Run an example Grok application
Ensure you have completed the steps above (traces, logs, and metrics configuration) before running this code. All OpenTelemetry instrumentation must be initialized first.
import os
from xai_sdk import Client
from xai_sdk.chat import user, system

#your telemetry configurations here

client = Client(
    api_key=os.getenv("XAI_API_KEY"),
    timeout=3600, # Override default timeout with longer timeout for reasoning models
)


chat = client.chat.create(model="grok-4")
chat.append(system("You are Grok, a highly intelligent, helpful AI assistant."))
chat.append(user("What is SigNoz"))
response = chat.sample()
print(response.content)
Before running this code, ensure that you have set the environment variable XAI_API_KEY with your generated Grok API key.
View Traces, Logs, and Metrics in SigNoz
Your Grok agent usage should now automatically emit traces and metrics.
The Grok xAI SDK does not auto-emit logs. Any logs you want to see must be explicitly exported. For more information on exporting logs, refer to Python Logs.
You should be able to view traces in Signoz Cloud under the traces tab:

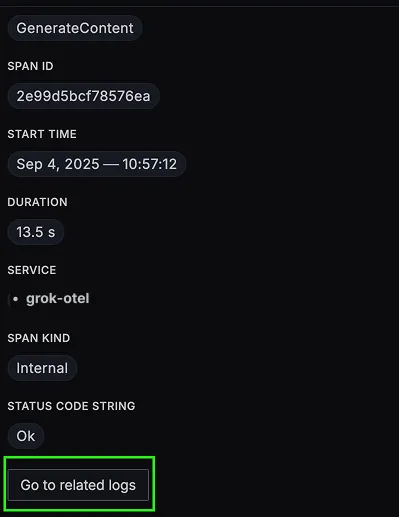
When you click on a trace in SigNoz, you'll see a detailed view of the trace, including all associated spans, along with their events and attributes.

You should be able to view logs in Signoz Cloud under the logs tab. You can also view logs by clicking on the “Related Logs” button in the trace view to see correlated logs:
You should be able to see Grok related metrics in Signoz Cloud under the metrics tab:

When you click on any of these metrics in SigNoz, you'll see a detailed view of the metric, including attributes:

Troubleshooting
If you don't see your telemetry data:
- Verify network connectivity - Ensure your application can reach SigNoz Cloud endpoints
- Check ingestion key - Verify your SigNoz ingestion key is correct
- Wait for data - OpenTelemetry batches data before sending, so wait 10-30 seconds after making API calls
- Try a console exporter — Enable a console exporter locally to confirm that your application is generating telemetry data before it’s sent to SigNoz
Next Steps
You can also check out our custom Grok dashboard here which provides specialized visualizations for monitoring your Grok usage in applications. The dashboard includes pre-built charts specifically tailored for LLM usage, along with import instructions to get started quickly.

Setup OpenTelemetry Collector (Optional)
What is the OpenTelemetry Collector?
Think of the OTel Collector as a middleman between your app and SigNoz. Instead of your application sending data directly to SigNoz, it sends everything to the Collector first, which then forwards it along.
Why use it?
- Cleaning up data — Filter out noisy traces you don't care about, or remove sensitive info before it leaves your servers.
- Keeping your app lightweight — Let the Collector handle batching, retries, and compression instead of your application code.
- Adding context automatically — The Collector can tag your data with useful info like which Kubernetes pod or cloud region it came from.
- Future flexibility — Want to send data to multiple backends later? The Collector makes that easy without changing your app.
See Switch from direct export to Collector for step-by-step instructions to convert your setup.
For more details, see Why use the OpenTelemetry Collector? and the Collector configuration guide.
Additional resources:
- Set up alerts for high latency or error rates
- Learn more about querying traces
- Explore log correlation
