Overview
This integration helps you monitor key MongoDB metrics and logs, view them with an out-of-the-box dashboard, and parse MongoDB logs for better querying and aggregation.
Prerequisites
Before you begin, ensure you have:
- A MongoDB server running version 4.4 or newer
- An OpenTelemetry (OTEL) Collector with access to the MongoDB server
- Install the OTEL Collector (v0.88.0 or newer) if not done already
- Ensure you can provide config files and set environment variables for the collector
- Ensure the OTEL collector has access to the MongoDB server for metrics collection and can read the MongoDB log file for logs collection
Collecting MongoDB Metrics
Step 1: Create the Collector Config File
Create a file named mongodb-metrics-collection-config.yaml with the following content:
receivers:
  mongodb:
    # - For standalone MongoDB deployments this is the hostname and port of the mongod instance
    # - For replica sets specify the hostnames and ports of the mongod instances that are in the replica set configuration. If the replica_set field is specified, nodes will be autodiscovered.
    # - For a sharded MongoDB deployment, please specify a list of the mongos hosts.
    hosts:
      - endpoint: ${env:MONGODB_ENDPOINT}
    # If authentication is required, the user can with clusterMonitor permissions can be provided here
    username: ${env:MONGODB_USERNAME}
    # If authentication is required, the password can be provided here.
    password: ${env:MONGODB_PASSWORD}
    collection_interval: 60s
    # If TLS is enabled, the following fields can be used to configure the connection
    tls:
      insecure: true
      insecure_skip_verify: true
    #   ca_file: /etc/ssl/certs/ca-certificates.crt
    #   cert_file: /etc/ssl/certs/mongodb.crt
    #   key_file: /etc/ssl/certs/mongodb.key
    metrics:
      mongodb.lock.acquire.count:
        enabled: true
      mongodb.lock.acquire.time:
        enabled: true
      mongodb.lock.acquire.wait_count:
        enabled: true
      mongodb.lock.deadlock.count:
        enabled: true
      mongodb.operation.latency.time:
        enabled: true

processors:
  # enriches the data with additional host information
  # see https://github.com/open-telemetry/opentelemetry-collector-contrib/tree/main/processor/resourcedetectionprocessor#resource-detection-processor
  resourcedetection/system:
    # add additional detectors if needed
    detectors: ["system"]
    system:
      hostname_sources: ["os"]

exporters:
  # export to SigNoz cloud
  otlp/mongodb:
    endpoint: "${env:OTLP_DESTINATION_ENDPOINT}"
    tls:
      insecure: false
    headers:
      "signoz-ingestion-key": "${env:SIGNOZ_INGESTION_KEY}"

  # export to local collector
  # otlp/mongodb:
  #   endpoint: "localhost:4317"
  #   tls:
  #     insecure: true

service:
  pipelines:
    metrics/mongodb:
      receivers: [mongodb]
      # note: remove this processor if the collector host is not running on the same host as the mongo instance
      processors: [resourcedetection/system]
      exporters: [otlp/mongodb]
Step 2: Set Environment Variables
Set the following environment variables:
# MongoDB endpoint reachable from the otel collector
export MONGODB_ENDPOINT="host:port"

# MongoDB monitoring user credentials
export MONGODB_USERNAME="monitoring"
export MONGODB_PASSWORD="your_secure_password"

# region specific SigNoz cloud ingestion endpoint
export OTLP_DESTINATION_ENDPOINT="ingest.us.signoz.cloud:443"

# your SigNoz ingestion key
export SIGNOZ_INGESTION_KEY="signoz-ingestion-key"
You can find more details about ingestion keys and Regions here
Step 3: Use the Collector Config File
Add the following flag to your collector run command:
--config mongodb-metrics-collection-config.yaml
Note: The collector can use multiple config files by specifying multiple --config flags.
Collecting MongoDB Logs
Step 1: Create the Collector Config File
Create a file named mongodb-logs-collection-config.yaml with the following content:
receivers:
  filelog/mongodb:
    include: ["${env:MONGODB_LOG_FILE}"]
    operators:
      # Parse structured mongodb logs
      # For more details, see https://www.mongodb.com/docs/manual/reference/log-messages/#structured-logging
      - type: json_parser
        if: body matches '^\\s*{\\s*".*}\\s*$'
        parse_from: body
        parse_to: attributes
        timestamp:
          parse_from: attributes.t.$$date
          layout: '2006-01-02T15:04:05.000-07:00'
          layout_type: gotime
        severity:
          parse_from: attributes.s
          overwrite_text: true
          mapping:
            debug:
              - D1
              - D2
              - D3
              - D4
              - D5
            info: I
            warn: W
            error: E
            fatal: F
      - type: flatten
        if: attributes.attr != nil
        field: attributes.attr
      - type: move
        if: attributes.msg != nil
        from: attributes.msg
        to: body
      - type: move
        if: attributes.c != nil
        from: attributes.c
        to: attributes.component
      - type: move
        if: attributes.id != nil
        from: attributes.id
        to: attributes.mongo_log_id
      - type: remove
        if: attributes.t != nil
        field: attributes.t
      - type: remove
        if: attributes.s != nil
        field: attributes.s
      - type: add
        field: attributes.source
        value: mongodb

processors:
  batch:
    send_batch_size: 10000
    send_batch_max_size: 11000
    timeout: 10s

exporters:
  # export to SigNoz cloud
  otlp/mongodb-logs:
    endpoint: "${env:OTLP_DESTINATION_ENDPOINT}"
    tls:
      insecure: false
    headers:
      "signoz-ingestion-key": "${env:SIGNOZ_INGESTION_KEY}"

  # export to local collector
  # otlp/mongodb-logs:
  #   endpoint: "localhost:4317"
  #   tls:
  #     insecure: true


service:
  pipelines:
    logs/mongodb:
      receivers: [filelog/mongodb]
      processors: [batch]
      exporters: [otlp/mongodb-logs]
Step 2: Set Environment Variables
Set the following environment variables:
# path of MongoDB server log file. must be accessible by the otel collector
export MONGODB_LOG_FILE="/var/log/mongodb/mongodb.log"

# region specific SigNoz cloud ingestion endpoint
export OTLP_DESTINATION_ENDPOINT="ingest.us.signoz.cloud:443"

# your SigNoz ingestion key
export SIGNOZ_INGESTION_KEY="signoz-ingestion-key"
You can find more details about ingestion keys and Regions here
Step 3: Use the Collector Config File
Add the following flag to your collector run command:
--config mongodb-logs-collection-config.yaml
Note: The collector can use multiple config files by specifying multiple --config flags in the collector run command.
Connect MongoDB
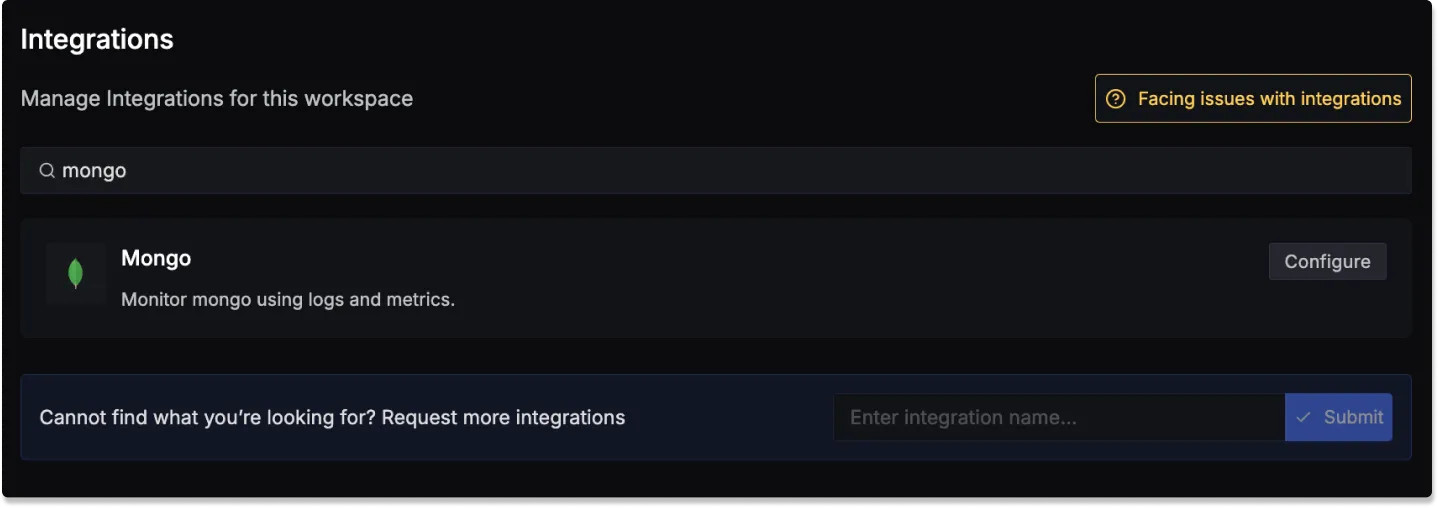
Once you're done with setting up MongoDB for collecting metrics and logs, head over to the integrations tab in SigNoz and search for the MongoDB integration.
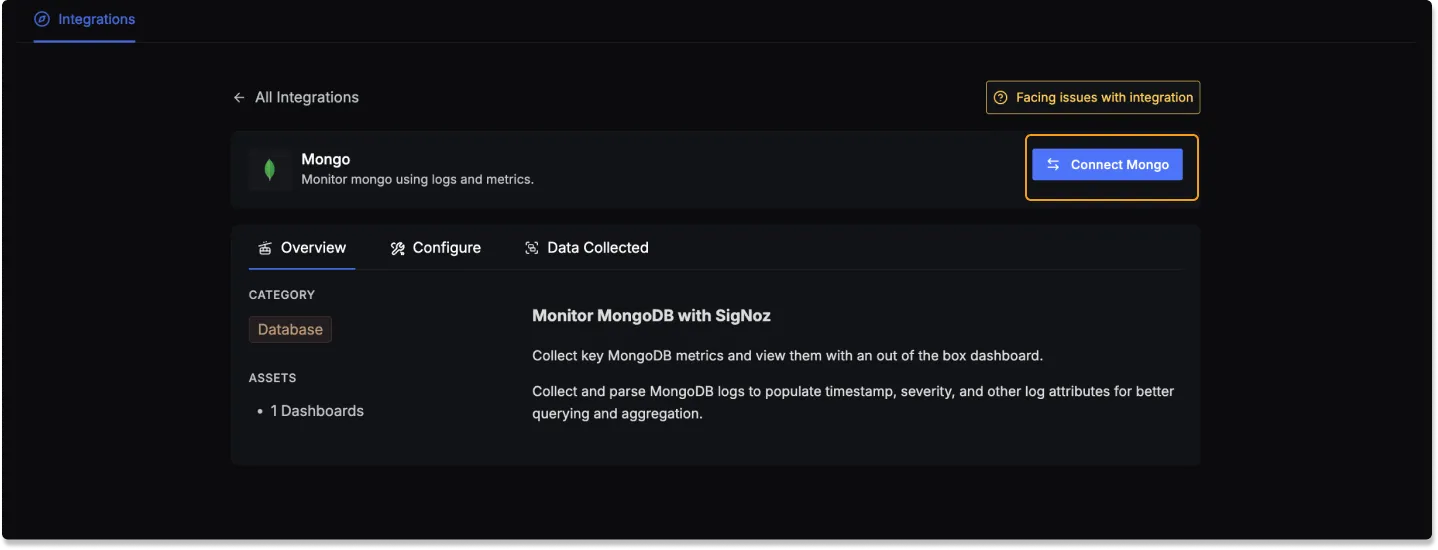
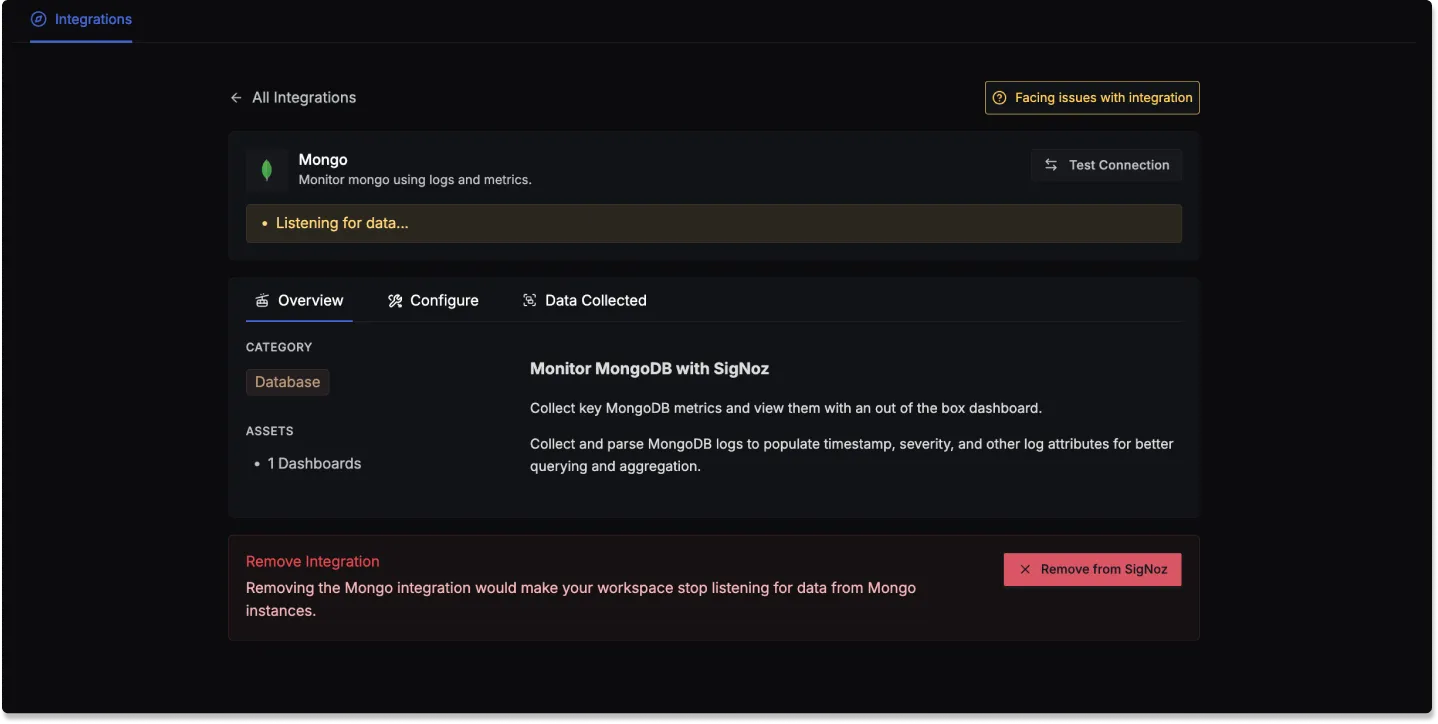
Click on the Connect Mongo Button, and select I have already configured, this will start listening for data from your MongoDB instance. To stop this, you can select the Remove from SigNoz button.
MongoDB Dashboard
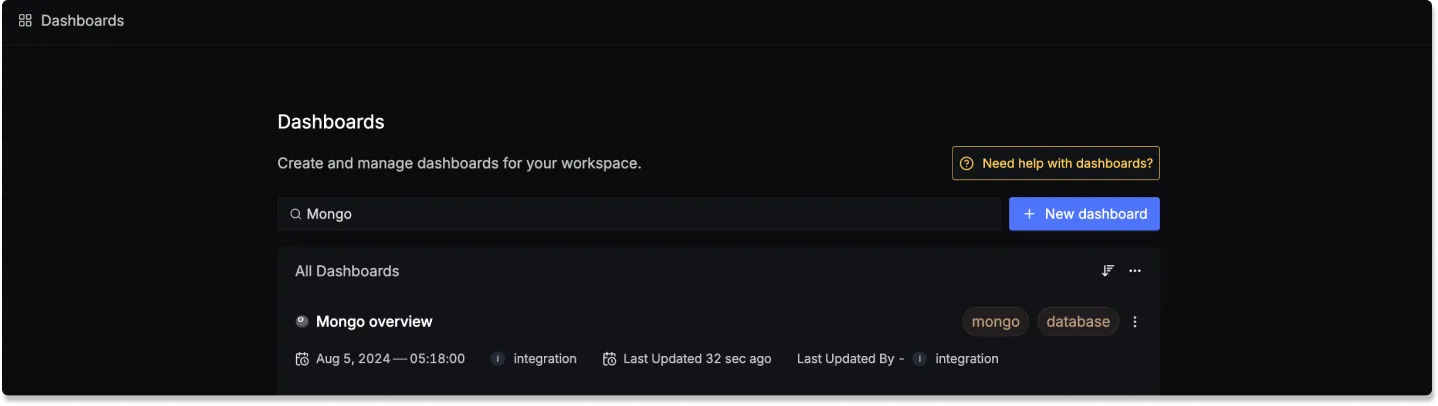
Once SigNoz has started listening to your MongoDB data, head over to the Dashboards tab and search for Mongo. This will show you a newly created dashboard which displays various MongoDB metrics.
Dashboard asset
You can also manually create the above MongoDB Dashboard by importing the JSON file available here. To learn how to create Dashboards, checkout this documentation.
Data Collected
When you switch to the Data Collected tab of your MongoDB Integration, it shows you details about the different logs attributes and the metrics types that you can monitor for your MongoDB instance. The tables below give you a list of the different logs attributes and metrics available.
MongoDB log attributes
- Name: The name of the log attribute.
- Path: The specific location or attribute within a log entry where the corresponding data can be found.
- Type: The data type of the log attribute.
| Name | Path | Type |
|---|---|---|
| Timestamp | timestamp | timestamp |
| Severity Text | severity_text | string |
| Severity Number | severity_number | number |
| MongoDB Component | attributes.component | string |
MongoDB metrics
- Name: The name of the metric.
- Type: The type of the metric (e.g., Sum, Gauge).
- Unit: The unit of measurement for the metric.
- Description: A brief description of what the metric represents.
| Name | Type | Unit | Description |
|---|---|---|---|
| mongodb_cache_operations | Sum | number | The number of cache operations of the instance. |
| mongodb_collection_count | Sum | number | The number of collections. |
| mongodb_data_size | Sum | Bytes | The size of the collection. Data compression does not affect this value. |
| mongodb_connection_count | Sum | number | The number of connections. |
| mongodb_extent_count | Sum | number | The number of extents. |
| mongodb_global_lock_time | Sum | milliseconds | The time the global lock has been held. |
| mongodb_index_count | Sum | number | The number of indexes. |
| mongodb_index_size | Sum | Bytes | Sum of the space allocated to all indexes in the database, including free index space. |
| mongodb_memory_usage | Sum | Bytes | The amount of memory used. |
| mongodb_object_count | Sum | number | The number of objects. |
| mongodb_operation_latency_time | Gauge | microseconds | The latency of operations. |
| mongodb_operation_count | Sum | number | The number of operations executed. |
| mongodb_operation_repl_count | Sum | number | The number of replicated operations executed. |
| mongodb_storage_size | Sum | Bytes | The total amount of storage allocated to this collection. |
| mongodb_database_count | Sum | number | The number of existing databases. |
| mongodb_index_access_count | Sum | number | The number of times an index has been accessed. |
| mongodb_document_operation_count | Sum | number | The number of document operations executed. |
| mongodb_network_io_receive | Sum | Bytes | The number of bytes received. |
| mongodb_network_io_transmit | Sum | Bytes | The number of bytes transmitted. |
| mongodb_network_request_count | Sum | number | The number of requests received by the server. |
| mongodb_operation_time | Sum | milliseconds | The total time spent performing operations. |
| mongodb_session_count | Sum | number | The total number of active sessions. |
| mongodb_cursor_count | Sum | number | The number of open cursors maintained for clients. |
| mongodb_cursor_timeout_count | Sum | number | The number of cursors that have timed out. |
| mongodb_lock_acquire_count | Sum | number | Number of times the lock was acquired in the specified mode. |
| mongodb_lock_acquire_wait_count | Sum | number | Number of times the lock acquisitions encountered waits because the locks were held in a conflicting mode. |
| mongodb_lock_acquire_time | Sum | microseconds | Cumulative wait time for the lock acquisitions. |
| mongodb_lock_deadlock_count | Sum | number | Number of times the lock acquisitions encountered deadlocks. |
| mongodb_health | Gauge | number | The health status of the server. |
| mongodb_uptime | Sum | milliseconds | The amount of time that the server has been running. |
