Overview
This integration helps you to monitor Nginx server logs for better querying and aggregation.
Prerequisites
Before you begin, ensure you have:
An Nginx server is running version newer than 1.0.0
An OpenTelemetry (OTEL) Collector with access to the Nginx server
- Install the OTEL Collector(v0.88.0 or newer) if not done already
- Ensure you can provide config files to the collector and set environment variables
- The collector must be able to read the Nginx server log files
Collecting Nginx Logs
Step 1: Create the Collector Config File
Create a file named nginx-logs-collection-config.yaml with the following content:
receivers:
  filelog/nginx-access-logs:
    include: ["${env:NGINX_ACCESS_LOG_FILE}"]
    operators:
      # Parse the default nginx access log format. Nginx defaults to the "combined" log format
      # $remote_addr - $remote_user [$time_local] "$request" $status $body_bytes_sent "$http_referer" "$http_user_agent"
      # For more details, see https://nginx.org/en/docs/http/ngx_http_log_module.html
      - type: regex_parser
        if: body matches '^(?P<remote_addr>[0-9\\.]+) - (?P<remote_user>[^\\s]+) \\[(?P<ts>.+)\\] "(?P<request_method>\\w+?) (?P<request_path>.+?)" (?P<status>[0-9]+) (?P<body_bytes_sent>[0-9]+) "(?P<http_referrer>.+?)" "(?P<http_user_agent>.+?)"$'
        parse_from: body
        parse_to: attributes
        regex: '^(?P<remote_addr>[0-9\.]+) - (?P<remote_user>[^\s]+) \[(?P<ts>.+)\] "(?P<request_method>\w+?) (?P<request_path>.+?)" (?P<status>[0-9]+) (?P<body_bytes_sent>[0-9]+) "(?P<http_referrer>.+?)" "(?P<http_user_agent>.+?)"$'
        timestamp:
          parse_from: attributes.ts
          layout: "02/Jan/2006:15:04:05 -0700"
          layout_type: gotime
        severity:
          parse_from: attributes.status
          overwrite_text: true
          mapping:
            debug: "1xx"
            info:
              - "2xx"
              - "3xx"
            warn: "4xx"
            error: "5xx"
      - type: remove
        if: attributes.ts != nil
        field: attributes.ts
      - type: add
        field: attributes.source
        value: nginx

  filelog/nginx-error-logs:
    include: ["${env:NGINX_ERROR_LOG_FILE}"]
    operators:
      # Parse the default nginx error log format.
      # YYYY/MM/DD HH:MM:SS [LEVEL] PID#TID: *CID MESSAGE
      # For more details, see https://github.com/phusion/nginx/blob/master/src/core/ngx_log.c
      - type: regex_parser
        if: body matches '^(?P<ts>.+?) \\[(?P<log_level>\\w+)\\] (?P<pid>\\d+)#(?P<tid>\\d+). \\*(?P<cid>\\d+) (?P<message>.+)$'
        parse_from: body
        parse_to: attributes
        regex: '^(?P<ts>.+?) \[(?P<log_level>\w+)\] (?P<pid>\d+)#(?P<tid>\d+). \*(?P<cid>\d+) (?P<message>.+)$'
        timestamp:
          parse_from: attributes.ts
          layout: "2006/01/02 15:04:05"
          layout_type: gotime
        severity:
          parse_from: attributes.log_level
          overwrite_text: true
          mapping:
            debug: "debug"
            info:
              - "info"
              - "notice"
            warn: "warn"
            error:
              - "error"
              - "crit"
              - "alert"
            fatal: "emerg"
      - type: remove
        if: attributes.ts != nil
        field: attributes.ts
      - type: move
        if: attributes.message != nil
        from: attributes.message
        to: body
      - type: add
        field: attributes.source
        value: nginx

processors:
  batch:
    send_batch_size: 10000
    send_batch_max_size: 11000
    timeout: 10s

exporters:
  # export to SigNoz cloud
  otlp/nginx-logs:
    endpoint: "${env:OTLP_DESTINATION_ENDPOINT}"
    tls:
      insecure: false
    headers:
      "signoz-ingestion-key": "${env:SIGNOZ_INGESTION_KEY}"

  # export to local collector
  # otlp/nginx-logs:
  #   endpoint: "localhost:4317"
  #   tls:
  #     insecure: true

service:
  pipelines:
    logs/nginx:
      receivers: [filelog/nginx-access-logs, filelog/nginx-error-logs]
      processors: [batch]
      exporters: [otlp/nginx-logs]
Note: If you are using a custom Nginx log format, adjust the regex used for parsing logs in the receivers named filelog/nginx-access-logs and filelog/nginx-error-logs in the collector config.
Step 2: Set Environment Variables
Set the following environment variables:
# path of Nginx access log file. must be accessible by the otel collector
# typically found at /usr/local/var/log/nginx/access.log on macOS
export NGINX_ACCESS_LOG_FILE=/var/log/nginx/access.log

# path of Nginx error log file. must be accessible by the otel collector
# typically found at /usr/local/var/log/nginx/error.log on macOS
export NGINX_ERROR_LOG_FILE=/var/log/nginx/error.log

# region specific SigNoz cloud ingestion endpoint
export OTLP_DESTINATION_ENDPOINT="ingest.{REGION}.signoz.cloud:443"

# your SigNoz ingestion key
export SIGNOZ_INGESTION_KEY="signoz-ingestion-key"
You can find more details about ingestion keys and Regions here
Step 3: Use the Collector Config File
Add the following flag to your collector run command:
--config nginx-logs-collection-config.yaml
Note: The collector can use multiple config files by specifying multiple --config flags in the collector run command.
Connect Nginx
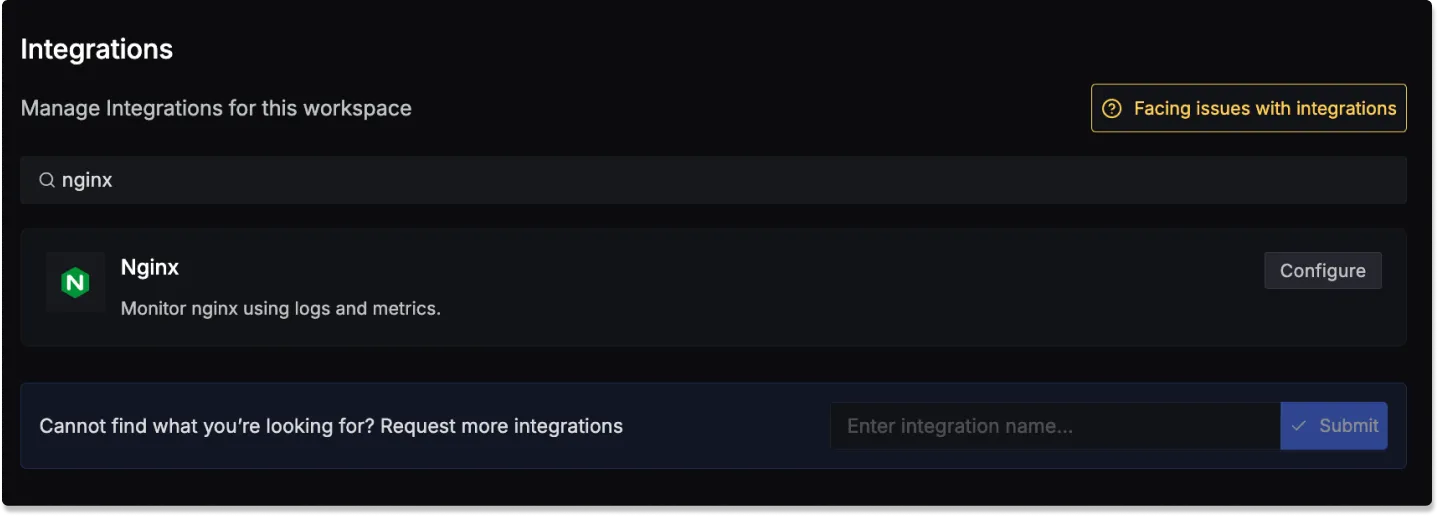
Once you're done with setting up Nginx for collecting logs, head over to the intergrations tab in SigNoz and search for the Nginx integration.

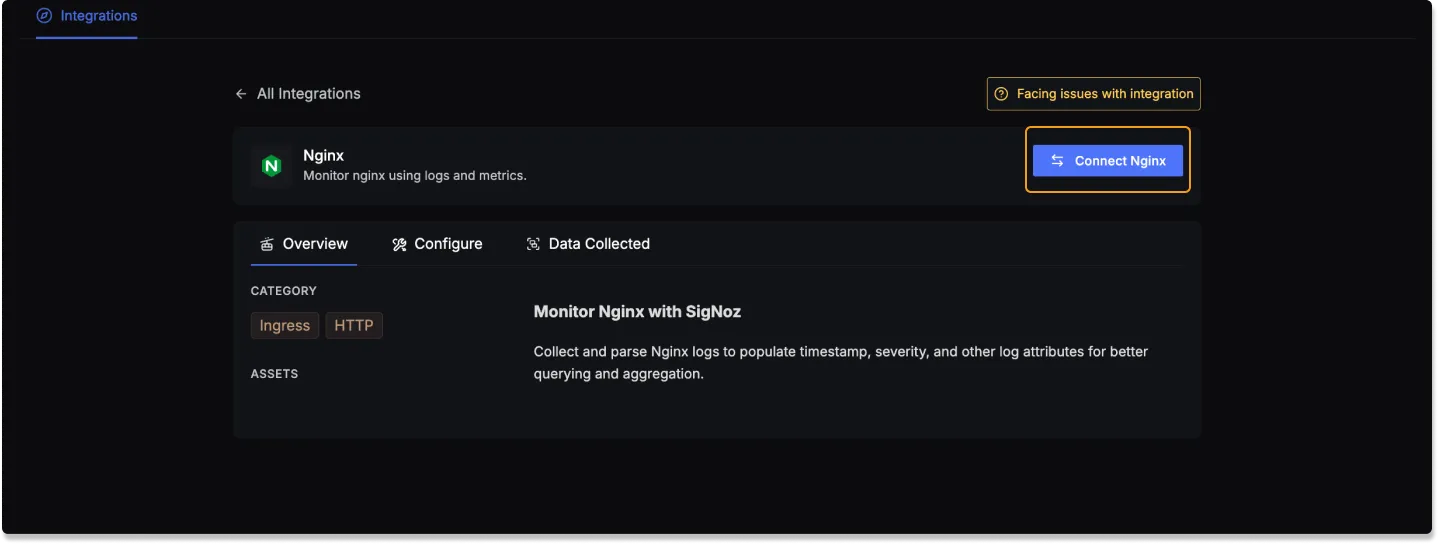
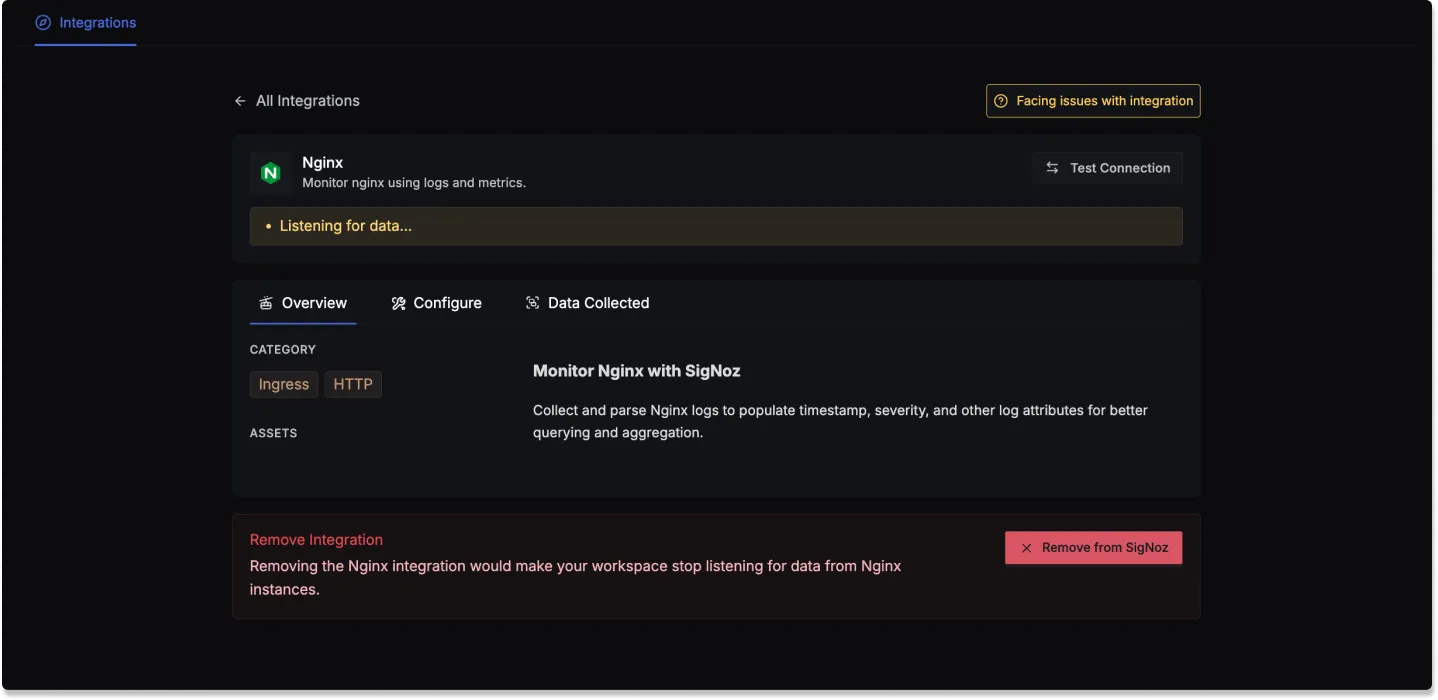
Click on the Connect Nginx Button, and select I have already configured, this will start listening for data from your Nginx server. To stop this, you can select the Remove from SigNoz button.


Data Collected
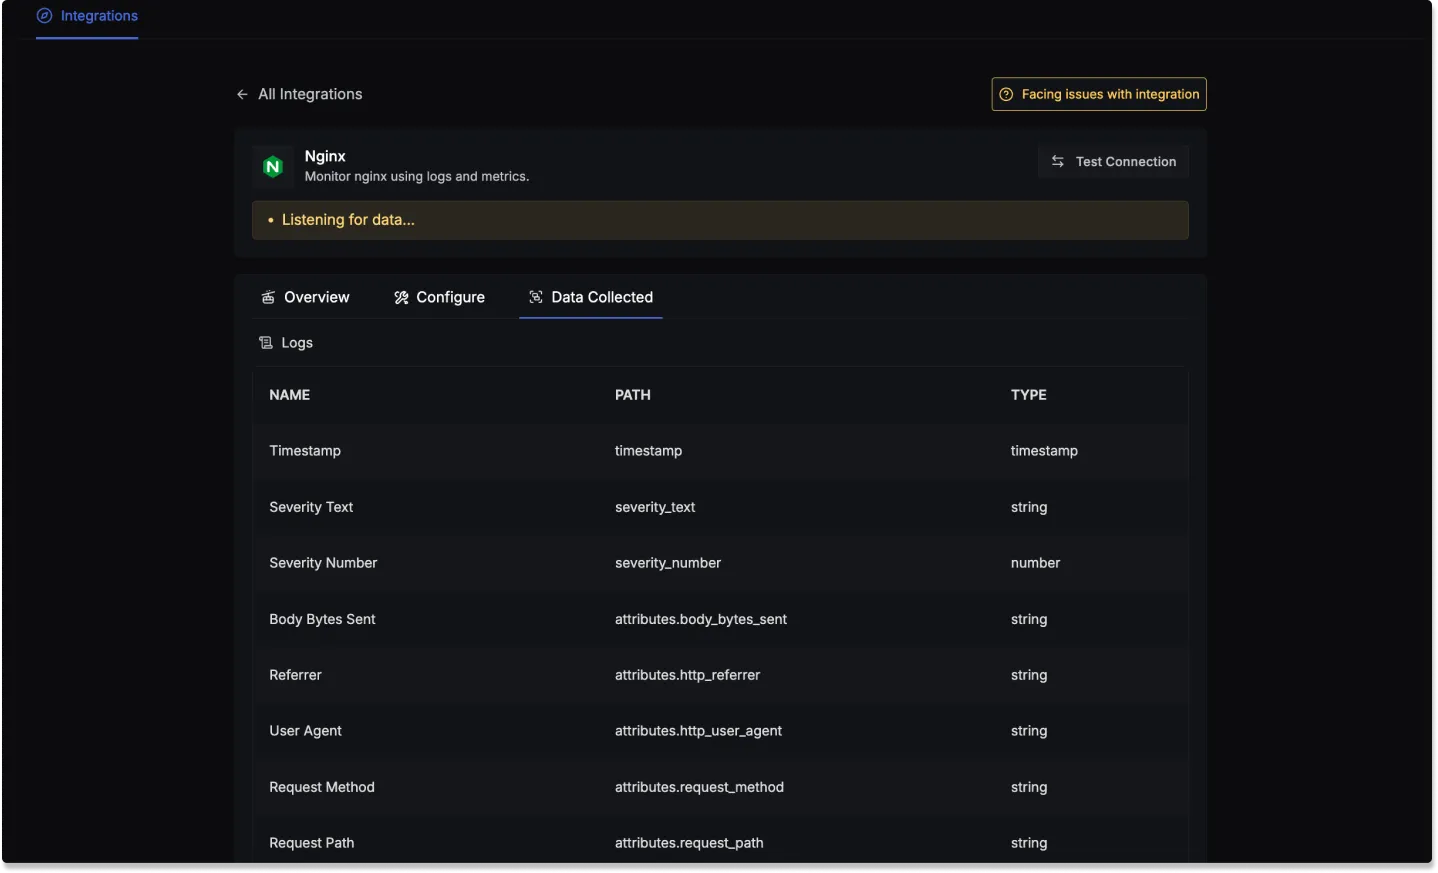
When you switch to the Data Collected tab of your Nginx Integrations, it shows you details about the different log attributes that you can monitor for Nginx. The tables below gives you a list of the different log attributes available.

Nginx log attributes
- Name: The name of the log attribute.
- Path: The specific location or attribute within a log entry where the corresponding data can be found.
- Type: The data type of the log attribute.
| Name | Path | Type |
|---|---|---|
| Timestamp | timestamp | timestamp |
| Severity Text | severity_text | string |
| Severity Number | severity_number | number |
| Body Bytes Sent | attributes.body_bytes_sent | string |
| Referrer | attributes.http_referrer | string |
| User Agent | attributes.http_user_agent | string |
| Request Method | attributes.request_method | string |
| Request Path | attributes.request_path | string |
| Response Status Code | attributes.status | string |
| Remote Address | attributes.remote_addr | string |
