Overview
This integration helps you to monitor key Postgres metrics and logs, view them with an out-of-the-box dashboard, and parse Postgres logs for better querying and aggregation.
Prerequisites
Before you begin, ensure you have:
A Postgres server running version 9.6 or newer
- You can check the server version with the SQL statement:
SELECT version();
- You can check the server version with the SQL statement:
A Postgres user with required permissions for metrics collection
- To create a monitoring user for Postgres versions 10+, run:
CREATE USER monitoring WITH PASSWORD '<PASSWORD>'; GRANT pg_monitor TO monitoring; GRANT SELECT ON pg_stat_database TO monitoring; - To create a monitoring user for Postgres versions >= 9.6 and < 10, run:
CREATE USER monitoring WITH PASSWORD '<PASSWORD>';
GRANT SELECT ON pg_stat_database TO monitoring;
- To create a monitoring user for Postgres versions 10+, run:
An OpenTelemetry (OTEL) Collector with access to the Postgres server
- Install the OTEL Collector(v0.88.0 or newer) if not done already
- Ensure you can provide config files to the collector and set environment variables
- The collector must be able to access the Postgres server as a client using the monitoring user
- For log collection, the collector must be able to read the Postgres server log file
Collecting Postgres Metrics
Step 1: Create the Collector Config File
Create a file named postgres-metrics-collection-config.yaml with the following content:
receivers:
  postgresql:
    # The endpoint of the postgresql server. Whether using TCP or Unix sockets, this value should be host:port. If transport is set to unix, the endpoint will internally be translated from host:port to /host.s.PGSQL.port
    endpoint: ${env:POSTGRESQL_ENDPOINT}
    # The frequency at which to collect metrics from the Postgres instance.
    collection_interval: 60s
    # The username used to access the postgres instance
    username: ${env:POSTGRESQL_USERNAME}
    # The password used to access the postgres instance
    password: ${env:POSTGRESQL_PASSWORD}
    # The list of databases for which the receiver will attempt to collect statistics. If an empty list is provided, the receiver will attempt to collect statistics for all non-template databases
    databases: []
    # # Defines the network to use for connecting to the server. Valid Values are `tcp` or `unix`
    # transport: tcp
    tls:
      # set to false if SSL is enabled on the server
      insecure: true
    #   ca_file: /etc/ssl/certs/ca-certificates.crt
    #   cert_file: /etc/ssl/certs/postgres.crt
    #   key_file: /etc/ssl/certs/postgres.key
    metrics:
      postgresql.database.locks:
        enabled: true
      postgresql.deadlocks:
        enabled: true
      postgresql.sequential_scans:
        enabled: true

processors:
  # enriches the data with additional host information
  # see https://github.com/open-telemetry/opentelemetry-collector-contrib/tree/main/processor/resourcedetectionprocessor#resource-detection-processor
  resourcedetection/system:
    # add additional detectors if needed
    detectors: ["system"]
    system:
      hostname_sources: ["os"]

exporters:
  # export to SigNoz cloud
  otlp/postgres:
    endpoint: "${env:OTLP_DESTINATION_ENDPOINT}"
    tls:
      insecure: false
    headers:
      "signoz-ingestion-key": "${env:SIGNOZ_INGESTION_KEY}"

  # export to local collector
  # otlp/postgres:
  #   endpoint: "localhost:4317"
  #   tls:
  #     insecure: true

service:
  pipelines:
    metrics/postgresql:
      receivers: [postgresql]
      # note: remove this processor if the collector host is not running on the same host as the postgres instance
      processors: [resourcedetection/system]
      exporters: [otlp/postgres]
Step 2: Set Environment Variables
Set the following environment variables:
# user name for Postgres monitoring user"
export POSTGRESQL_USERNAME="monitoring"

# password for Postgres monitoring user"
export POSTGRESQL_PASSWORD="<PASSWORD>"

# Postgres endpoint reachable from the otel collector"
export POSTGRESQL_ENDPOINT="host:port"

# region specific SigNoz cloud ingestion endpoint
export OTLP_DESTINATION_ENDPOINT="ingest.{REGION}.signoz.cloud:443"

# your SigNoz ingestion key
export SIGNOZ_INGESTION_KEY="signoz-ingestion-key"
You can find more details about ingestion keys and Regions here
Step 3: Use the Collector Config File
Add the following flag to your collector run command:
--config postgres-metrics-collection-config.yaml
Note: The collector can use multiple config files by specifying multiple --config flags.
Collecting Postgres Logs
Step 1: Create the Collector Config File
Create a file named postgres-logs-collection-config.yaml with the following content:
receivers:
  filelog/postgresql:
    include: ["${env:POSTGRESQL_LOG_FILE}"]
    operators:
      # Parse default postgresql text log format.
      # `log_line_prefix` postgres setting defaults to '%m [%p] ' which logs the timestamp and the process ID
      # See https://www.postgresql.org/docs/current/runtime-config-logging.html#GUC-LOG-LINE-PREFIX for more details
      - type: regex_parser
        if: body matches '^(?P<ts>\\d{4}-\\d{2}-\\d{2} \\d{2}:\\d{2}:\\d{2}.?[0-9]*? [A-Z]*) \\[(?P<pid>[0-9]+)\\] (?P<log_level>[A-Z]*). (?P<message>.*)$'
        parse_from: body
        regex: '^(?P<ts>\d{4}-\d{2}-\d{2} \d{2}:\d{2}:\d{2}.?[0-9]*? [A-Z]*) \[(?P<pid>[0-9]+)\] (?P<log_level>[A-Z]*). (?P<message>.*)$'
        timestamp:
          parse_from: attributes.ts
          layout: '%Y-%m-%d %H:%M:%S %Z'
        severity:
          parse_from: attributes.log_level
          mapping:
            debug:
              - DEBUG1
              - DEBUG2
              - DEBUG3
              - DEBUG4
              - DEBUG5
            info:
              - INFO
              - LOG
              - NOTICE
              - DETAIL
            warn: WARNING
            error: ERROR
            fatal:
              - FATAL
              - PANIC
        on_error: send
      - type: move
        if: attributes.message != nil
        from: attributes.message
        to: body
      - type: remove
        if: attributes.log_level != nil
        field: attributes.log_level
      - type: remove
        if: attributes.ts != nil
        field: attributes.ts
      - type: add
        field: attributes.source
        value: postgres

processors:
  batch:
    send_batch_size: 10000
    send_batch_max_size: 11000
    timeout: 10s

exporters:
  # export to SigNoz cloud
  otlp/postgres-logs:
    endpoint: "${env:OTLP_DESTINATION_ENDPOINT}"
    tls:
      insecure: false
    headers:
      "signoz-ingestion-key": "${env:SIGNOZ_INGESTION_KEY}"

  # export to local collector
  # otlp/postgres-logs:
  #   endpoint: "localhost:4317"
  #   tls:
  #     insecure: true

service:
  pipelines:
    logs/postgresql:
      receivers: [filelog/postgresql]
      processors: [batch]
      exporters: [otlp/postgresql-logs]
Step 2: Set Environment Variables
Set the following environment variables:
# path of Postgres server log file. must be accessible by the otel collector
# typically found in /usr/local/var/log/postgresql on macOS
# running `SELECT pg_current_logfile();` can also give you the location of postgresql log file
export POSTGRESQL_LOG_FILE=/var/log/postgresql/postgresql.log

# region specific SigNoz cloud ingestion endpoint
export OTLP_DESTINATION_ENDPOINT="ingest.{REGION}.signoz.cloud:443"

# your SigNoz ingestion key
export SIGNOZ_INGESTION_KEY="signoz-ingestion-key"
You can find more details about ingestion keys and Regions here
Step 3: Use the Collector Config File
Add the following flag to your collector run command:
--config postgres-logs-collection-config.yaml
Note: The collector can use multiple config files by specifying multiple --config flags in the collector run command.
Connect PostgreSQL
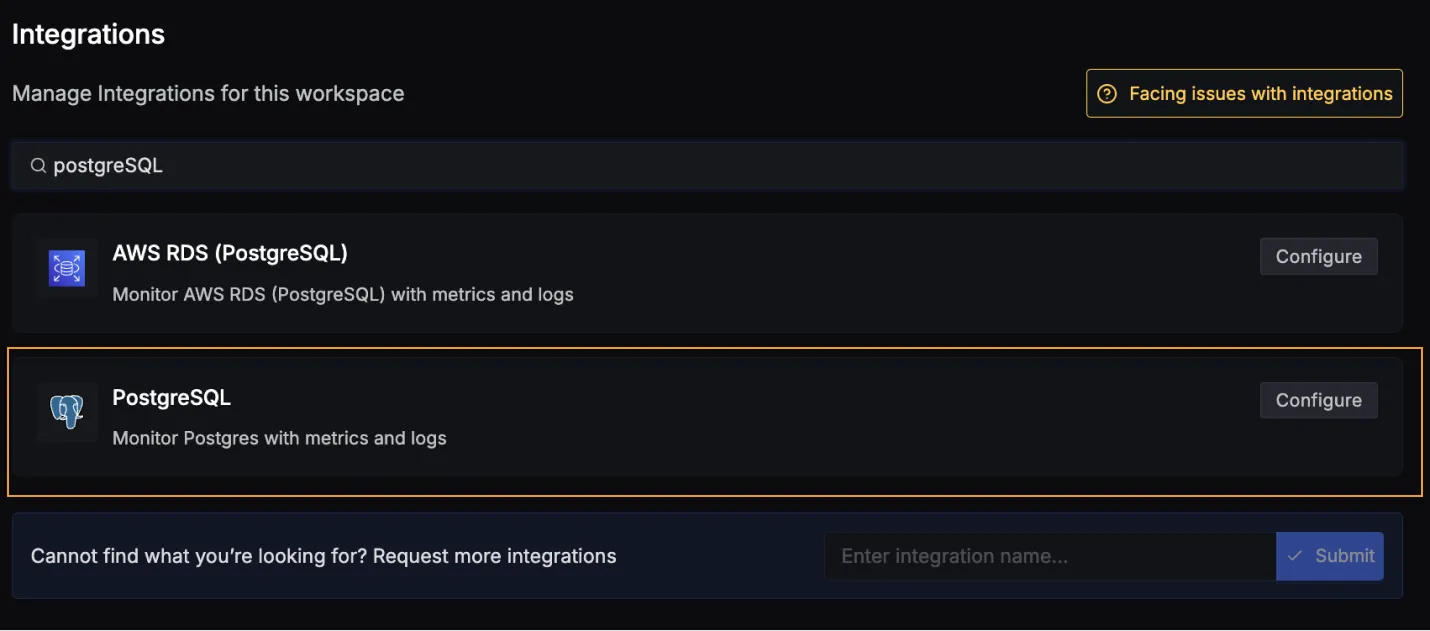
Once you're done with setting up PostgreSQL for collecting metrics and logs, head over to the intergrations tab in SigNoz and search for the PostgreSQL integration.
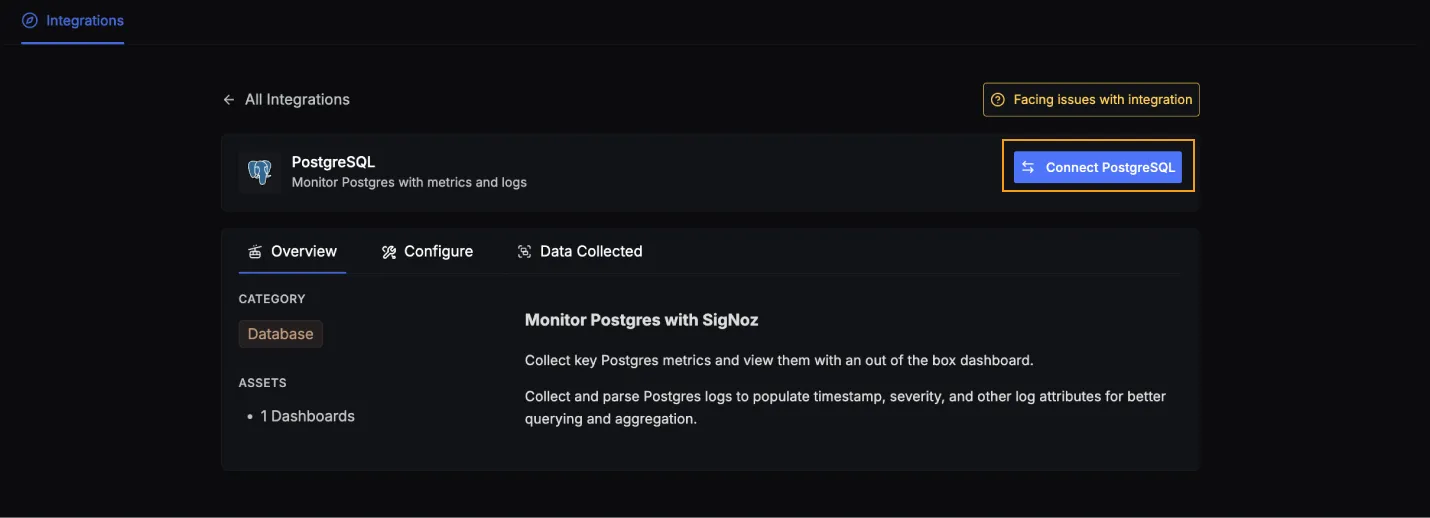
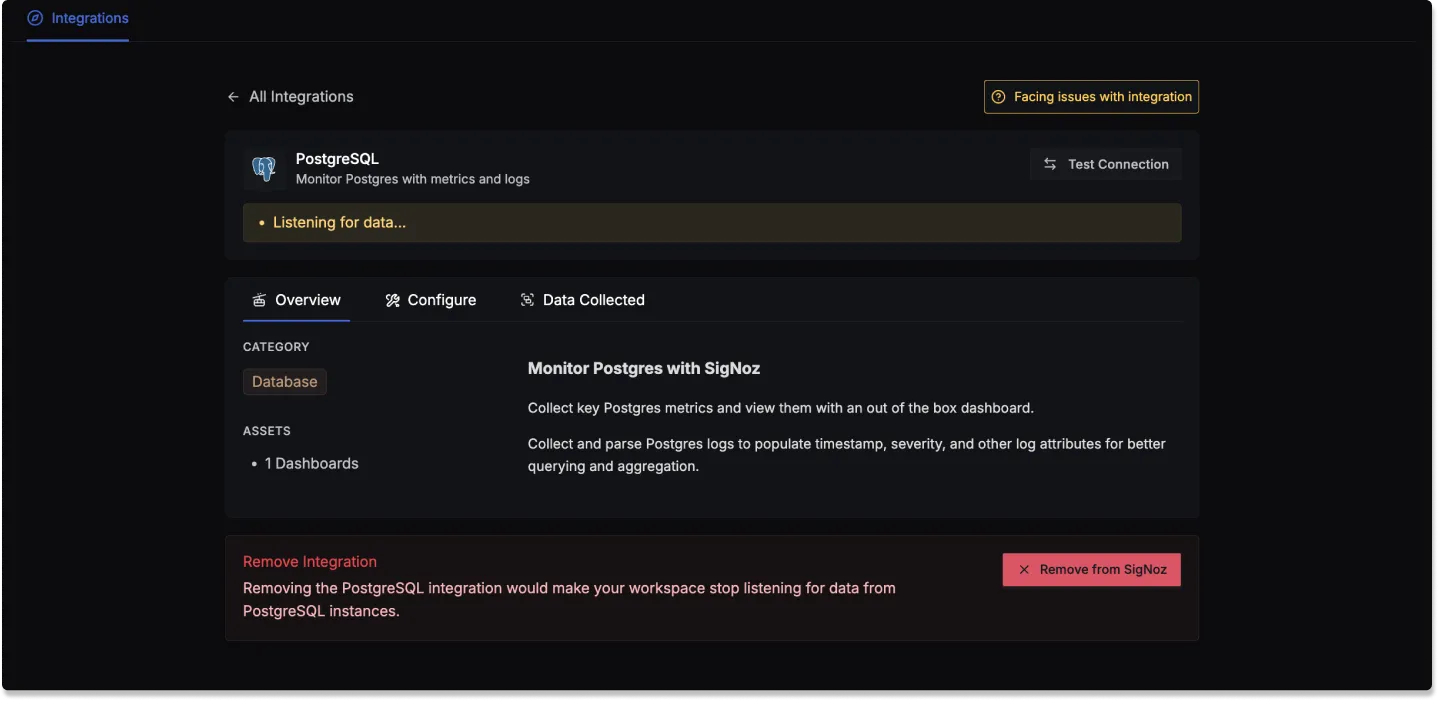
Click on the Connect PostgreSQL Button, and select I have already configured, this will start listening for data from your PostgreSQL instance. To stop this, you can select the Remove from SigNoz button.
PostgreSQL dashboard
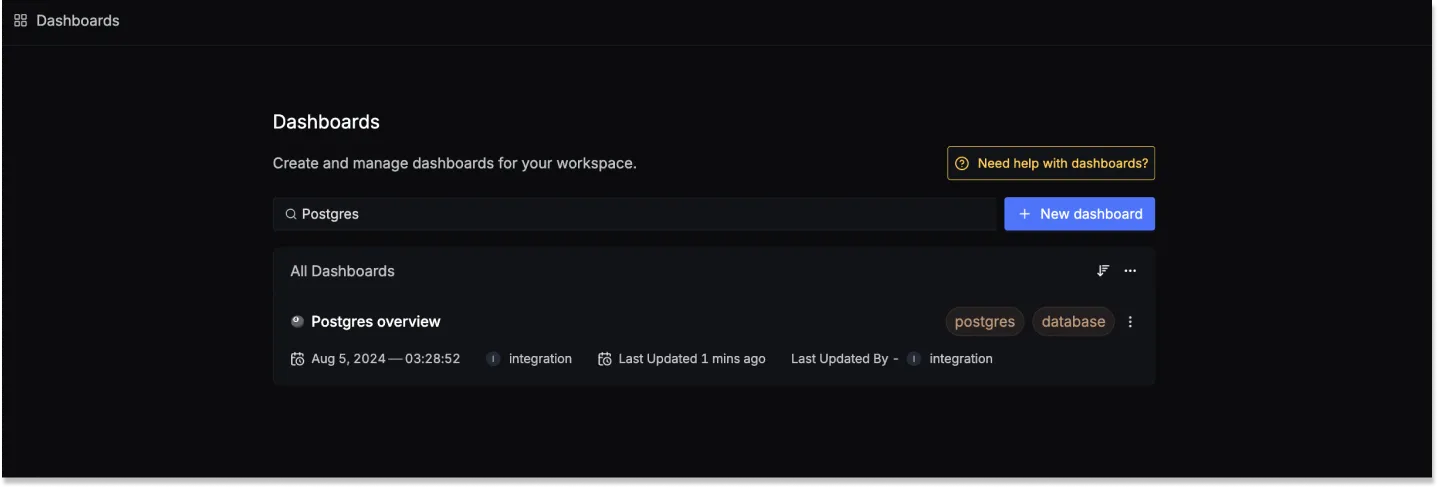
Once SigNoz has started listening to your PostgreSQL data, head over to the Dashboards tab and search for Postgres, this will show you a newly created dashboard which shows different PostgreSQL metrics.
Dashboard asset
You can also manually create the above PostgreSQL Dashboard by importing the JSON file available here. To learn how to create Dashboards, checkout this documentation.
Data Collected
When you switch to the Data Collected tab of your PostgreSQL Integrations, it shows you details about the different logs attributes and the metrics types that you can monitor for your PostgreSQL instance. The tables below gives you a list of the different logs attributes and metrics available.
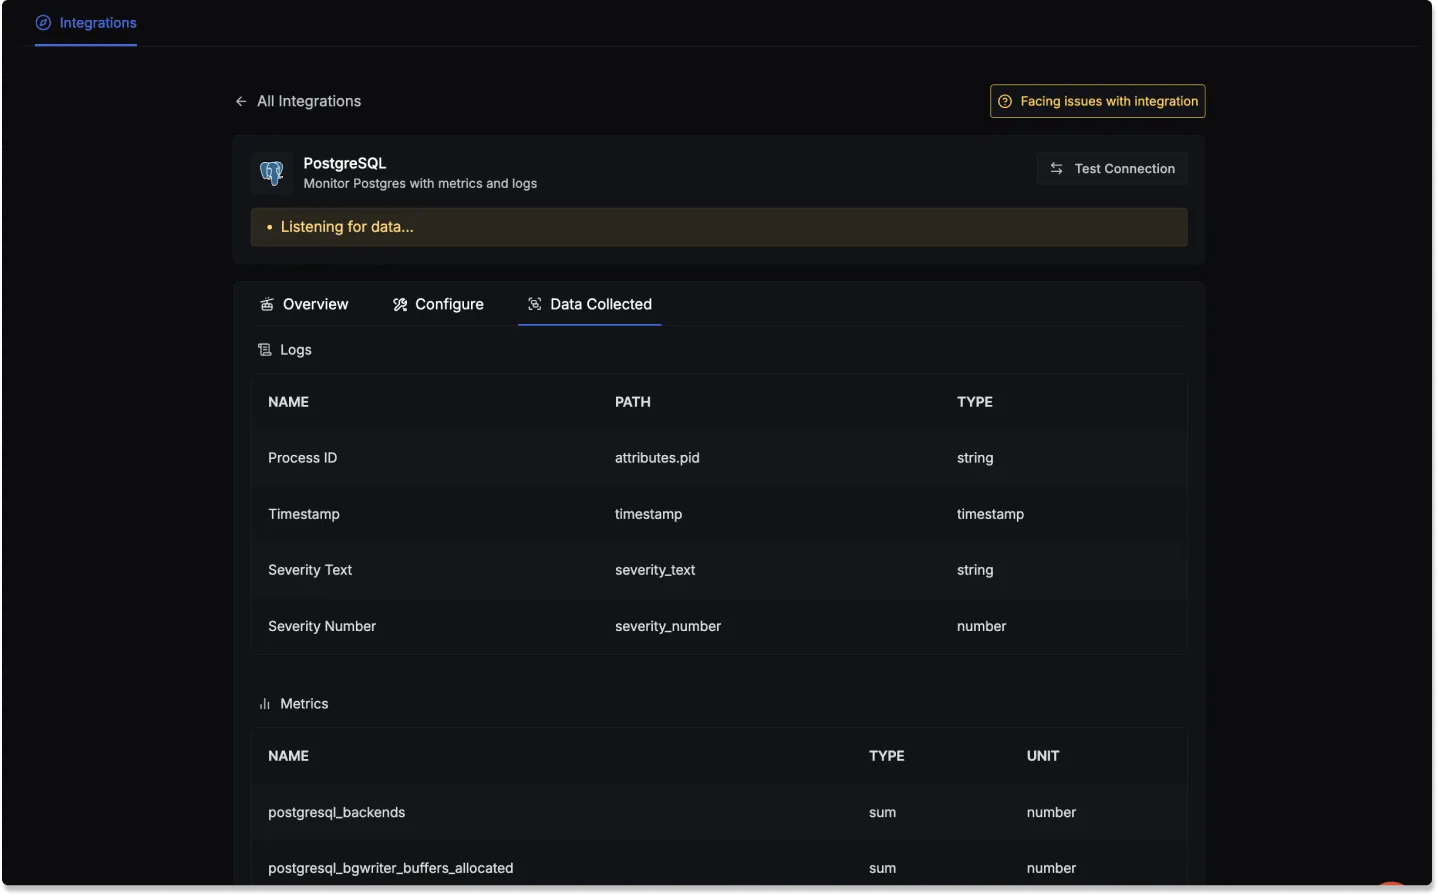
PostgreSQL log attributes
- Name: The name of the log attribute.
- Path: The specific location or attribute within a log entry where the corresponding data can be found.
- Type: The data type of the log attribute.
| Name | Path | Type |
|---|---|---|
| Process ID | attributes.pid | string |
| Timestamp | timestamp | timestamp |
| Severity Text | severity_text | string |
| Severity Number | severity_number | number |
PostgreSQL metrics
- Name: The name of the metric.
- Type: The type of the metric (e.g., Sum, Gauge).
- Unit: The unit of measurement for the metric.
- Description: A brief description of what the metric represents.
| Name | Type | Unit | Description |
|---|---|---|---|
| postgresql_backends | sum | number | The number of backends. |
| postgresql_bgwriter_buffers_allocated | sum | number | Number of buffers allocated. |
| postgresql_bgwriter_buffers_writes | sum | number | Number of buffers written. |
| postgresql_bgwriter_checkpoint_count | sum | number | The number of checkpoints performed. |
| postgresql_bgwriter_duration | sum | milliseconds | Total time spent writing and syncing files to disk by checkpoints. |
| postgresql_bgwriter_maxwritten | sum | number | Number of times the background writer stopped a cleaning scan because it had written too many buffers. |
| postgresql_blocks_read | sum | number | The number of blocks read. |
| postgresql_commits | sum | number | The number of commits. |
| postgresql_connection_max | gauge | number | Configured maximum number of client connections allowed |
| postgresql_database_count | sum | number | Number of user databases. |
| postgresql_database_locks | gauge | number | The number of database locks. |
| postgresql_db_size | sum | Bytes | The database disk usage. |
| postgresql_deadlocks | sum | number | The number of deadlocks. |
| postgresql_index_scans | sum | number | The number of index scans on a table. |
| postgresql_index_size | gauge | Bytes | The size of the index on disk. |
| postgresql_operations | sum | number | The number of db row operations. |
| postgresql_replication_data_delay | gauge | Bytes | The amount of data delayed in replication. |
| postgresql_rollbacks | sum | number | The number of rollbacks. |
| postgresql_rows | sum | number | The number of rows in the database. |
| postgresql_sequential_scans | sum | number | The number of sequential scans. |
| postgresql_table_count | sum | number | Number of user tables in a database. |
| postgresql_table_size | sum | Bytes | Disk space used by a table. |
| postgresql_table_vacuum_count | sum | number | Number of times a table has manually been vacuumed. |
| postgresql_temp_files | sum | number | The number of temp files. |
| postgresql_wal_age | gauge | seconds | Age of the oldest WAL file. |
| postgresql_wal_delay | gauge | seconds | Time between flushing recent WAL locally and receiving notification that the standby server has completed an operation with it. |
| postgresql_wal_lag | gauge | seconds | Time between flushing recent WAL locally and receiving notification that the standby server has completed an operation with it. |
