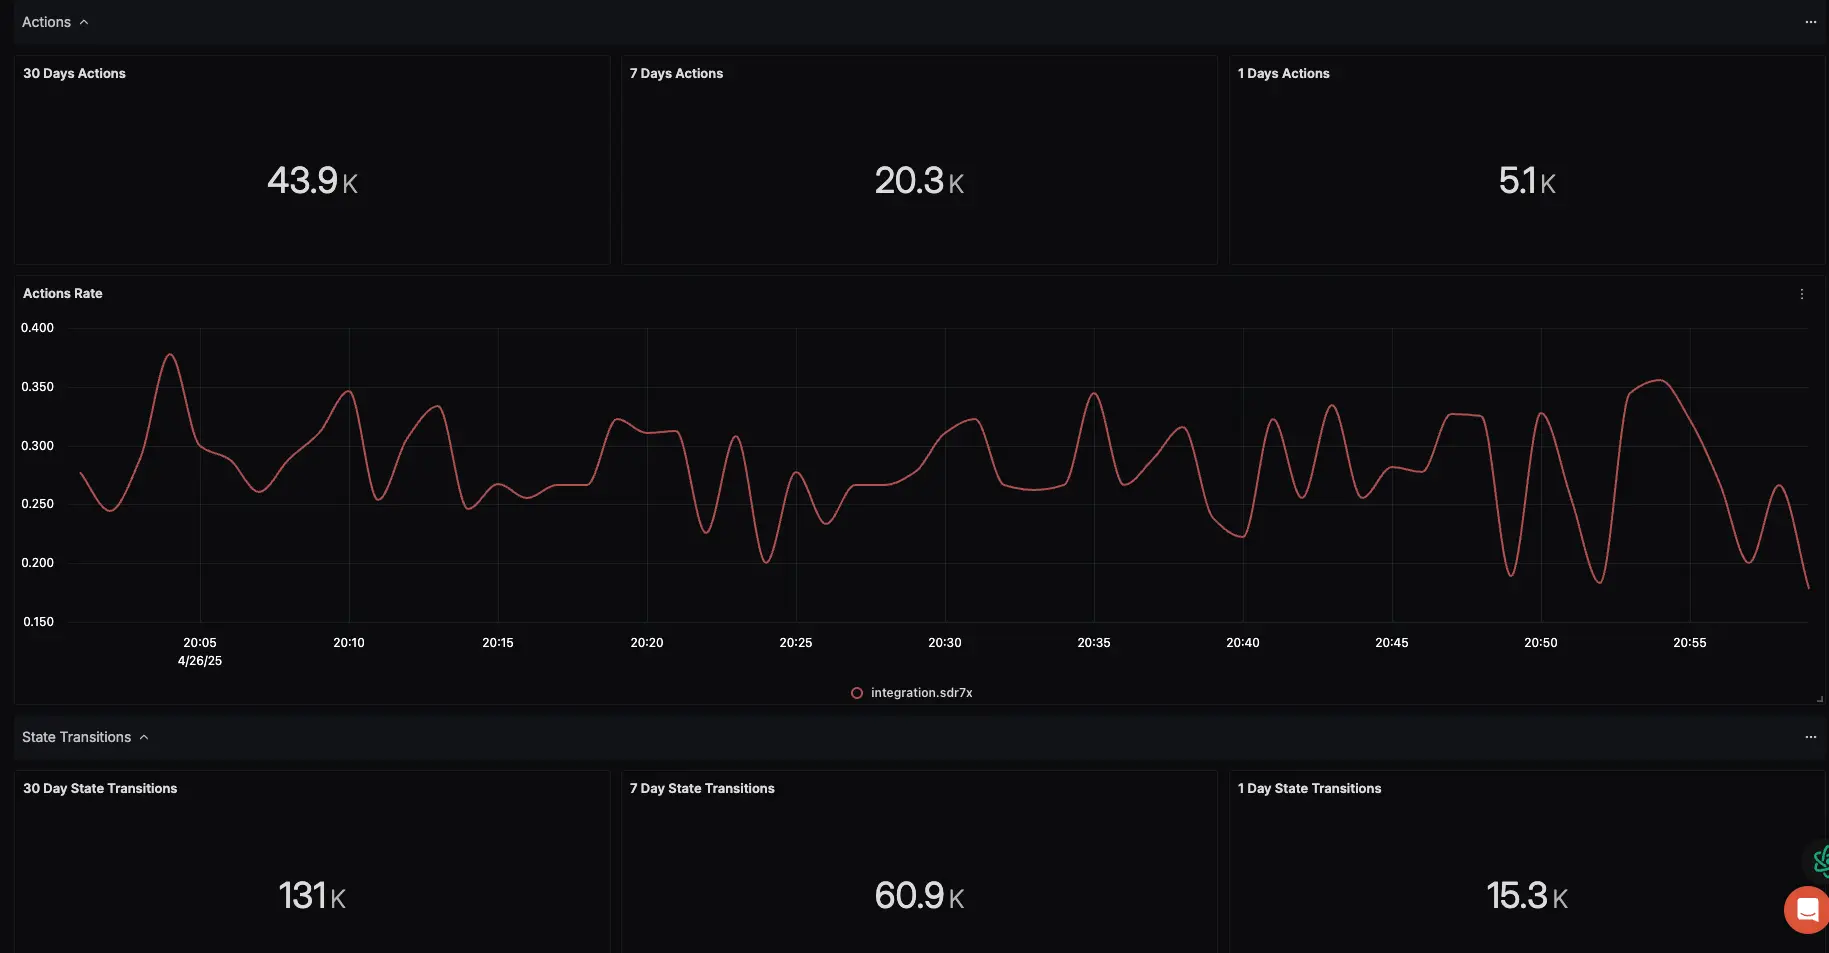
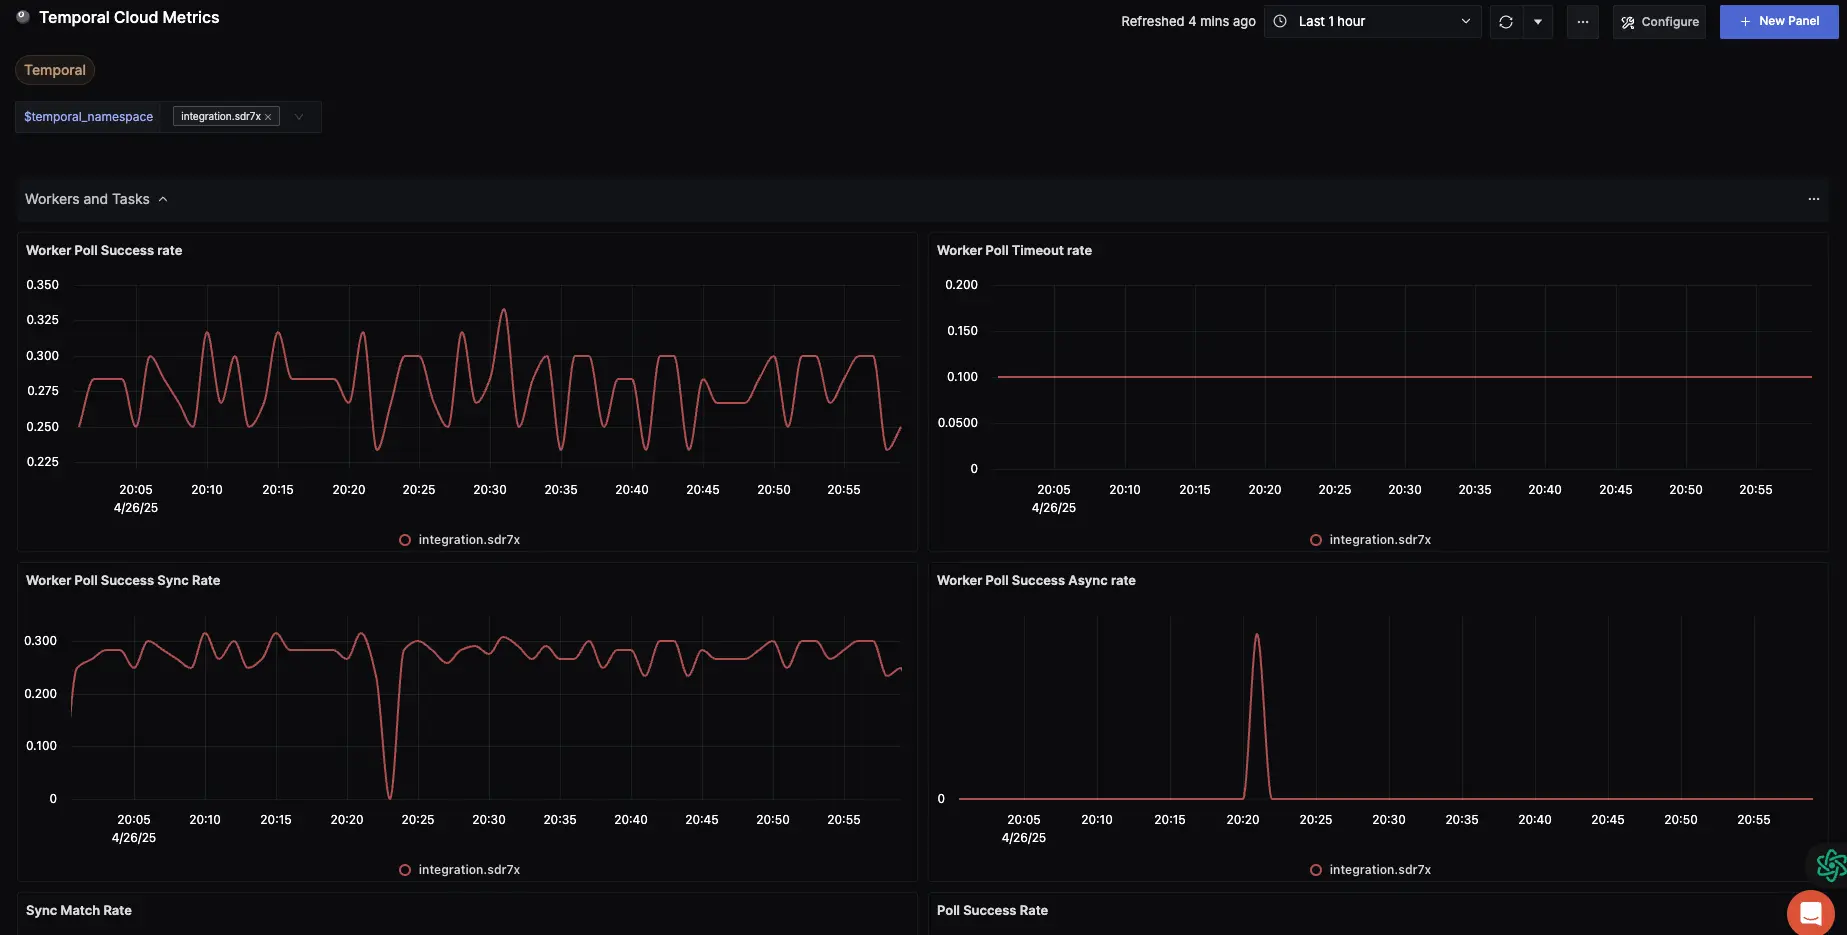
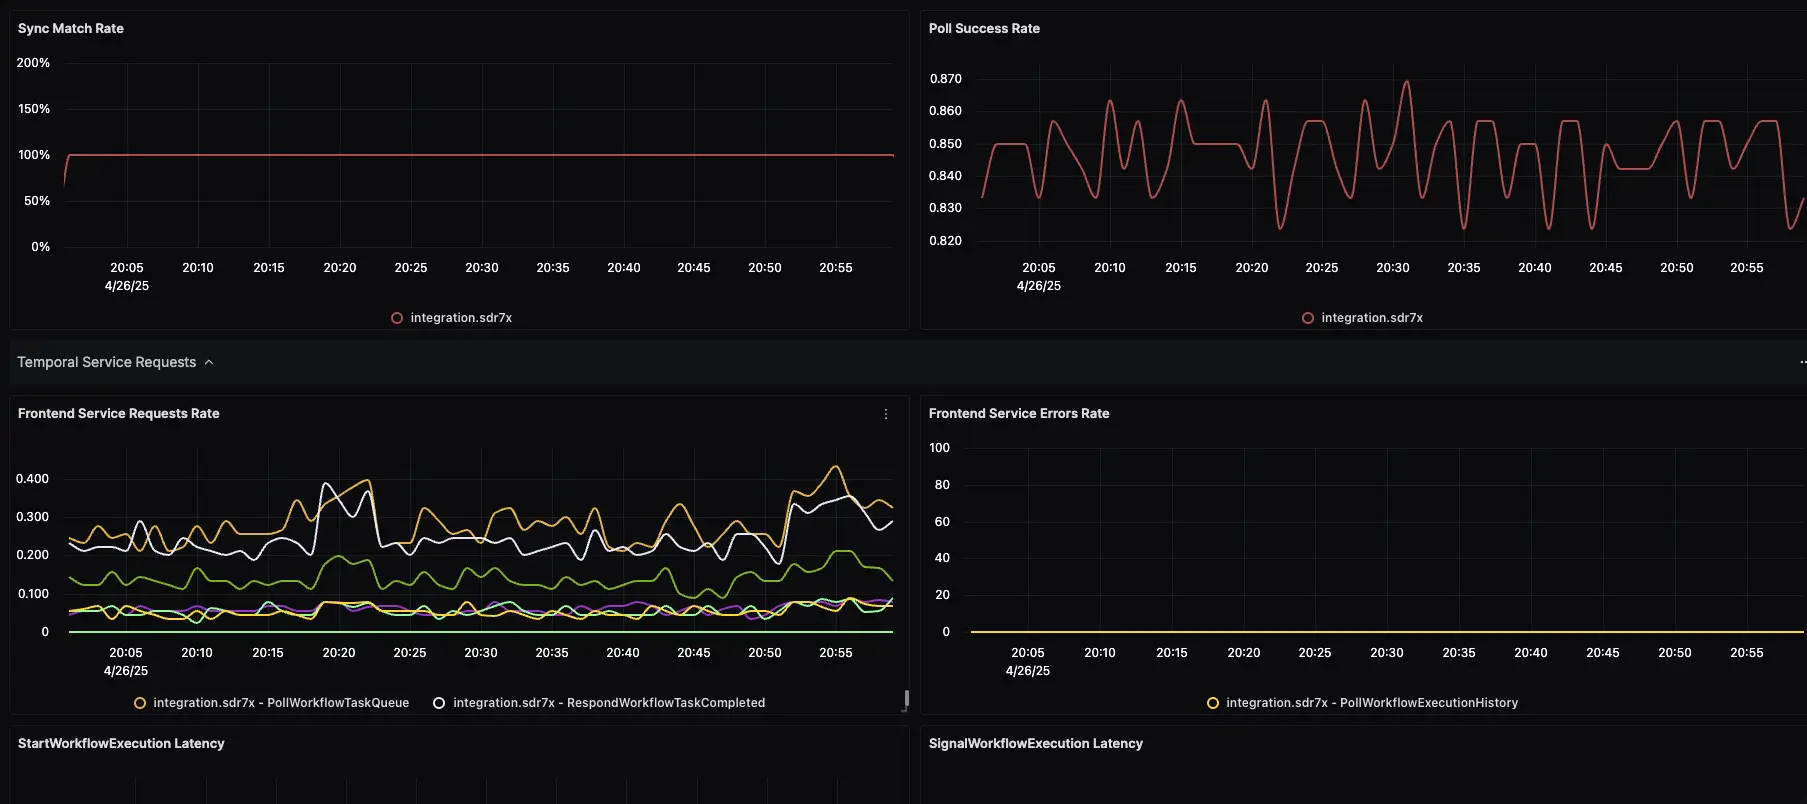
We need to configure metrics endpoint using Temporal Cloud UI. The steps are available at https://docs.temporal.io/production-deployment/cloud/metrics/general-setup. After this you should have:
- Temporal metrics endpoint
- The certificate and key files
Step 1: Run promql-to-scrape to expose metrics to endpoint
https://github.com/SigNoz/samples-server/blob/main/cloud/observability/promql-to-scrape/
go mod tidy
go build -o promql-to-scrape cmd/promql-to-scrape/main.go
./promql-to-scrape --client-cert=/path/to/client.crt --client-
key=/path/to/tls.key --prom-endpoint=https://<account>.tmprl.cloud/prometheus --config-file examples/config.yaml --debug
You metrics would now be available at http://localhost:9001/metrics for getting scraped
Relevant yaml files to run in k8s are at:
- Deployment. Configure these args to your environment
- ConfigMap
- Secret. Add your cert and key here
Step 2: Run otel-collector to scrape the metrics
Install otel-collector:
- Using Binary - https://signoz.io/docs/opentelemetry-collection-agents/vm/install/
- At Kubernetes - https://signoz.io/docs/tutorial/kubernetes-infra-metrics/
This guide can also be useful if you are new to scraping prometheus metrics using otel-collector
Add below scrape config to the otel-collector config
    receivers:
        ...
        prometheus:
            config:
                global:
                    scrape_interval: 30s
                scrape_configs:
                    - job_name: temporal-cloud
                        static_configs:
                            - targets:
                                - localhost:9001
Replace localhost:9001 with the endpoint where your metrics are available for scrape after Step 1.
Also, add prometheus to the list of receivers in the metrics pipeline of otel-collector. Keep the remaining part of your config intact.
    ...
    pipelines:
        ...
        metrics:
            receivers: [otlp, prometheus]
            processors: [batch]
            exporters: [otlp]
        ...
Step 3: Import dashboard
Go to Dashboards => New Dashboard => Import JSON
Download JSON from link
Feel free to reach out to us if data does not start appearing in the dashboard after 2-3 minutes. Here are sample screenshots from the dashboard:


