Overview
This guide walks you through setting up monitoring for Mastra using OpenTelemetry and exporting traces to SigNoz. With this integration, you can observe model performance, capture request/response details, giving you real-time visibility into latency, error rates, and usage trends for your Mastra applications.
Instrumenting Mastra in your AI applications with telemetry ensures full observability across your AI workflows, making it easier to debug issues, optimize performance, and understand user interactions.
Prerequisites
- A SigNoz Cloud account with an active ingestion key
- Internet access to send telemetry data to SigNoz Cloud
- Node.js (v20.0 or higher)
- An API key from a supported Model Provider
Setting Up Mastra Project
You can get the full Mastra installation instructions here.
Step 1: Start the CLI Wizard
Run the following command to start the interactive setup:
npx create-mastra@latest
yarn dlx create-mastra@latest
pnpm create mastra@latest
bun create mastra@latest
Step 2: Add Your API key
Add your API key to the .env file:
OPENAI_API_KEY=<your-api-key>
This example uses OpenAI. Each LLM provider uses a unique name. See Model Capabilities for more information.
Setup an Agent
Step 1: Create an agent in your project.
For example, create a file src/mastra/agents/chefAgent.ts:
import { openai } from "@ai-sdk/openai";
import { Agent } from "@mastra/core/agent";

export const chefAgent = new Agent({
  name: "chef-agent",
  instructions:
    "You are Michel, a practical and experienced home chef" +
    "You help people cook with whatever ingredients they have available.",
  model: openai("gpt-4o-mini"),
});
Step 2: Register the Agent with Mastra
In your src/mastra/index.ts file, register the agent with telemetry enabled:
import { Mastra } from "@mastra/core";
import { chefAgent } from "./agents/chefAgent";
import { OtelExporter } from "@mastra/otel-exporter";


export const mastra = new Mastra({
  agents: { chefAgent },
  observability: {
    configs: {
      otel: {
        serviceName: '<service-name>',
        exporters: [
          new OtelExporter({
            provider: {
              signoz: {
                apiKey: process.env.SIGNOZ_INGESTION_KEY,
                region: 'us', // 'us' | 'eu' | 'in',
              }
            },
          })
        ],
      },
    },
  },
});
<service_name>is the name of your serviceSIGNOZ_INGESTION_KEY→ Your SigNoz ingestion key. Set the value as an environment variable.region→ appropriate region
Step 3: Run Mastra Dev Server and Interact with Agent
npm run dev
You should see some output similar to this:
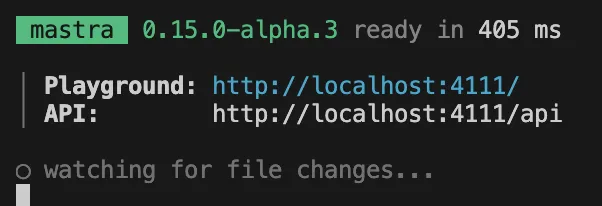
Visit the playground url, and start chatting with the registered agent. All your interactions should be traced and sent to SigNoz under the traces tab.
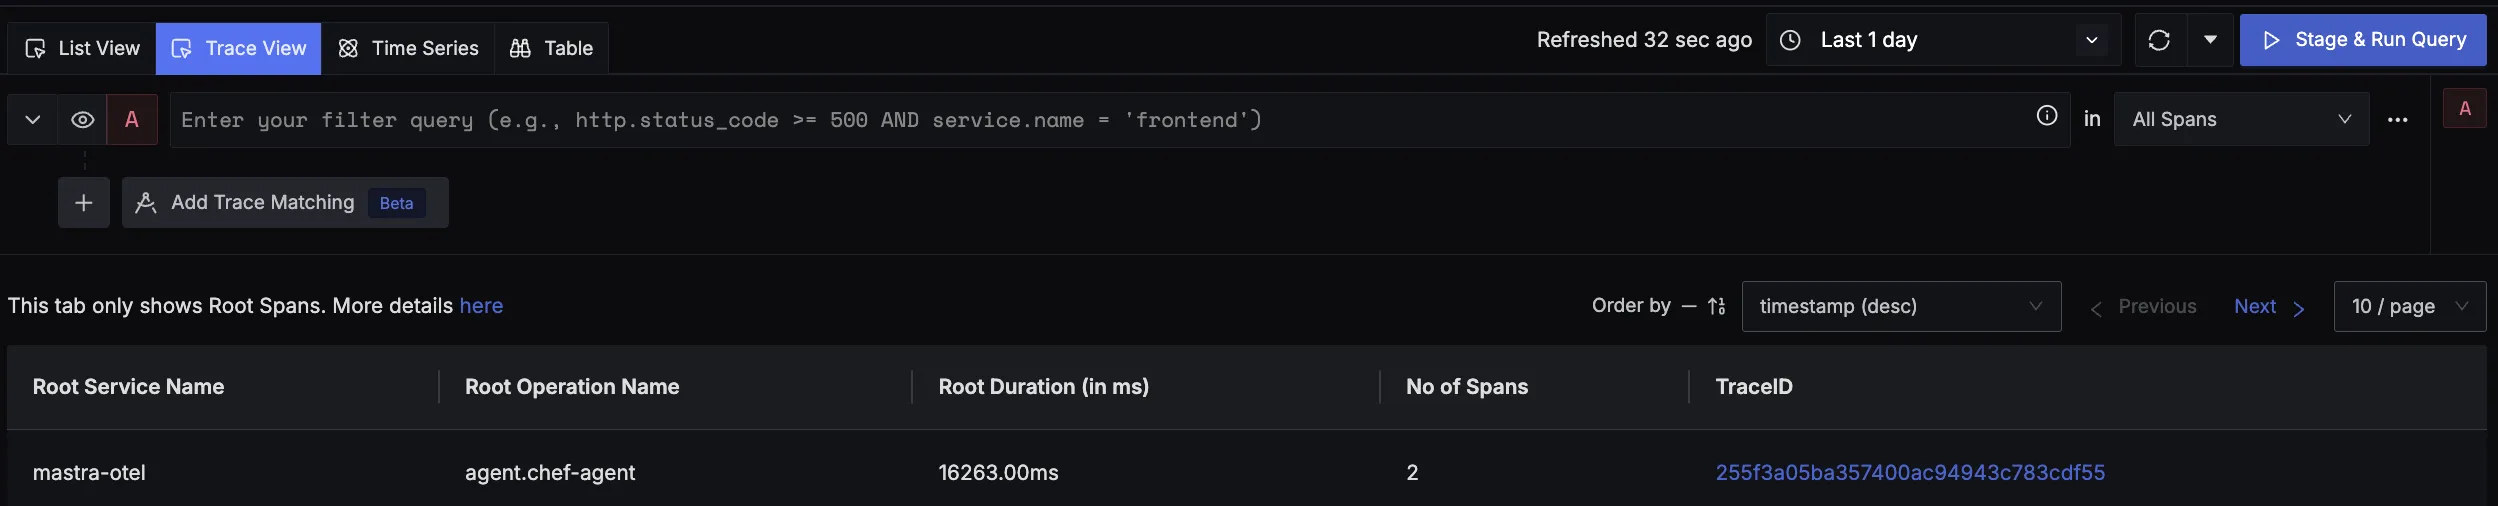
View Traces in SigNoz
Your Mastra interactions should now automatically emit traces.
You should be able to view traces in Signoz Cloud under the traces tab:
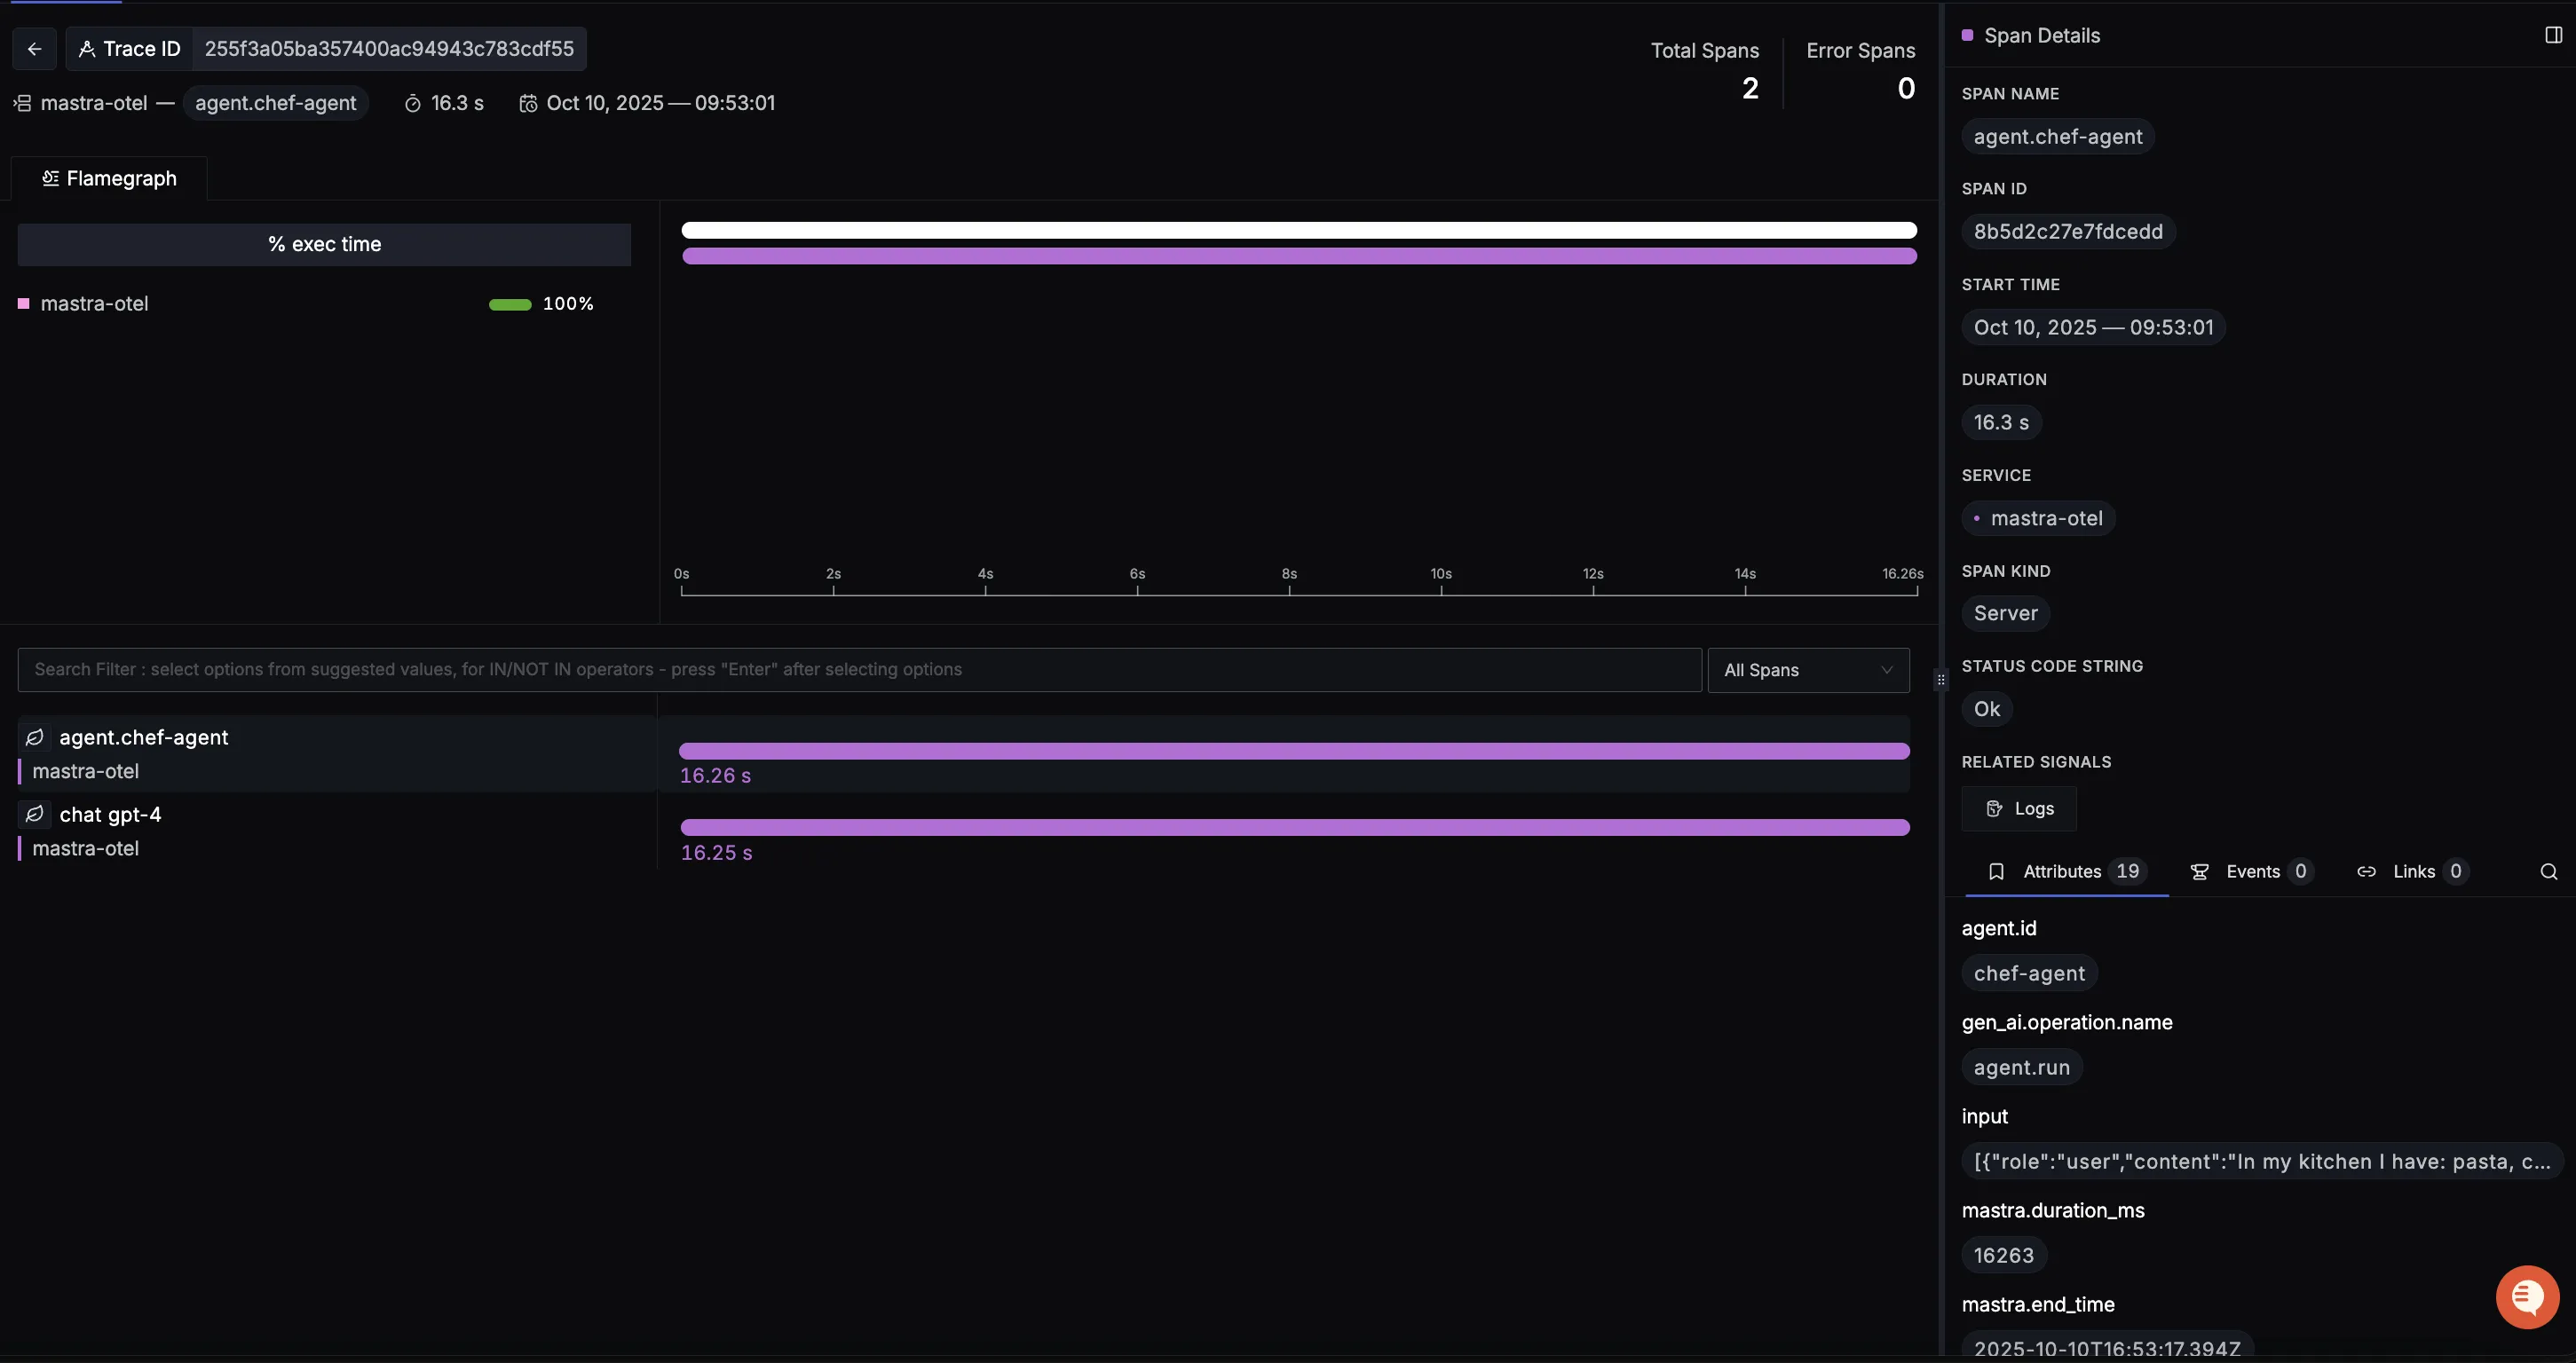
When you click on a trace in SigNoz, you'll see a detailed view of the trace, including all associated spans, along with their events and attributes.
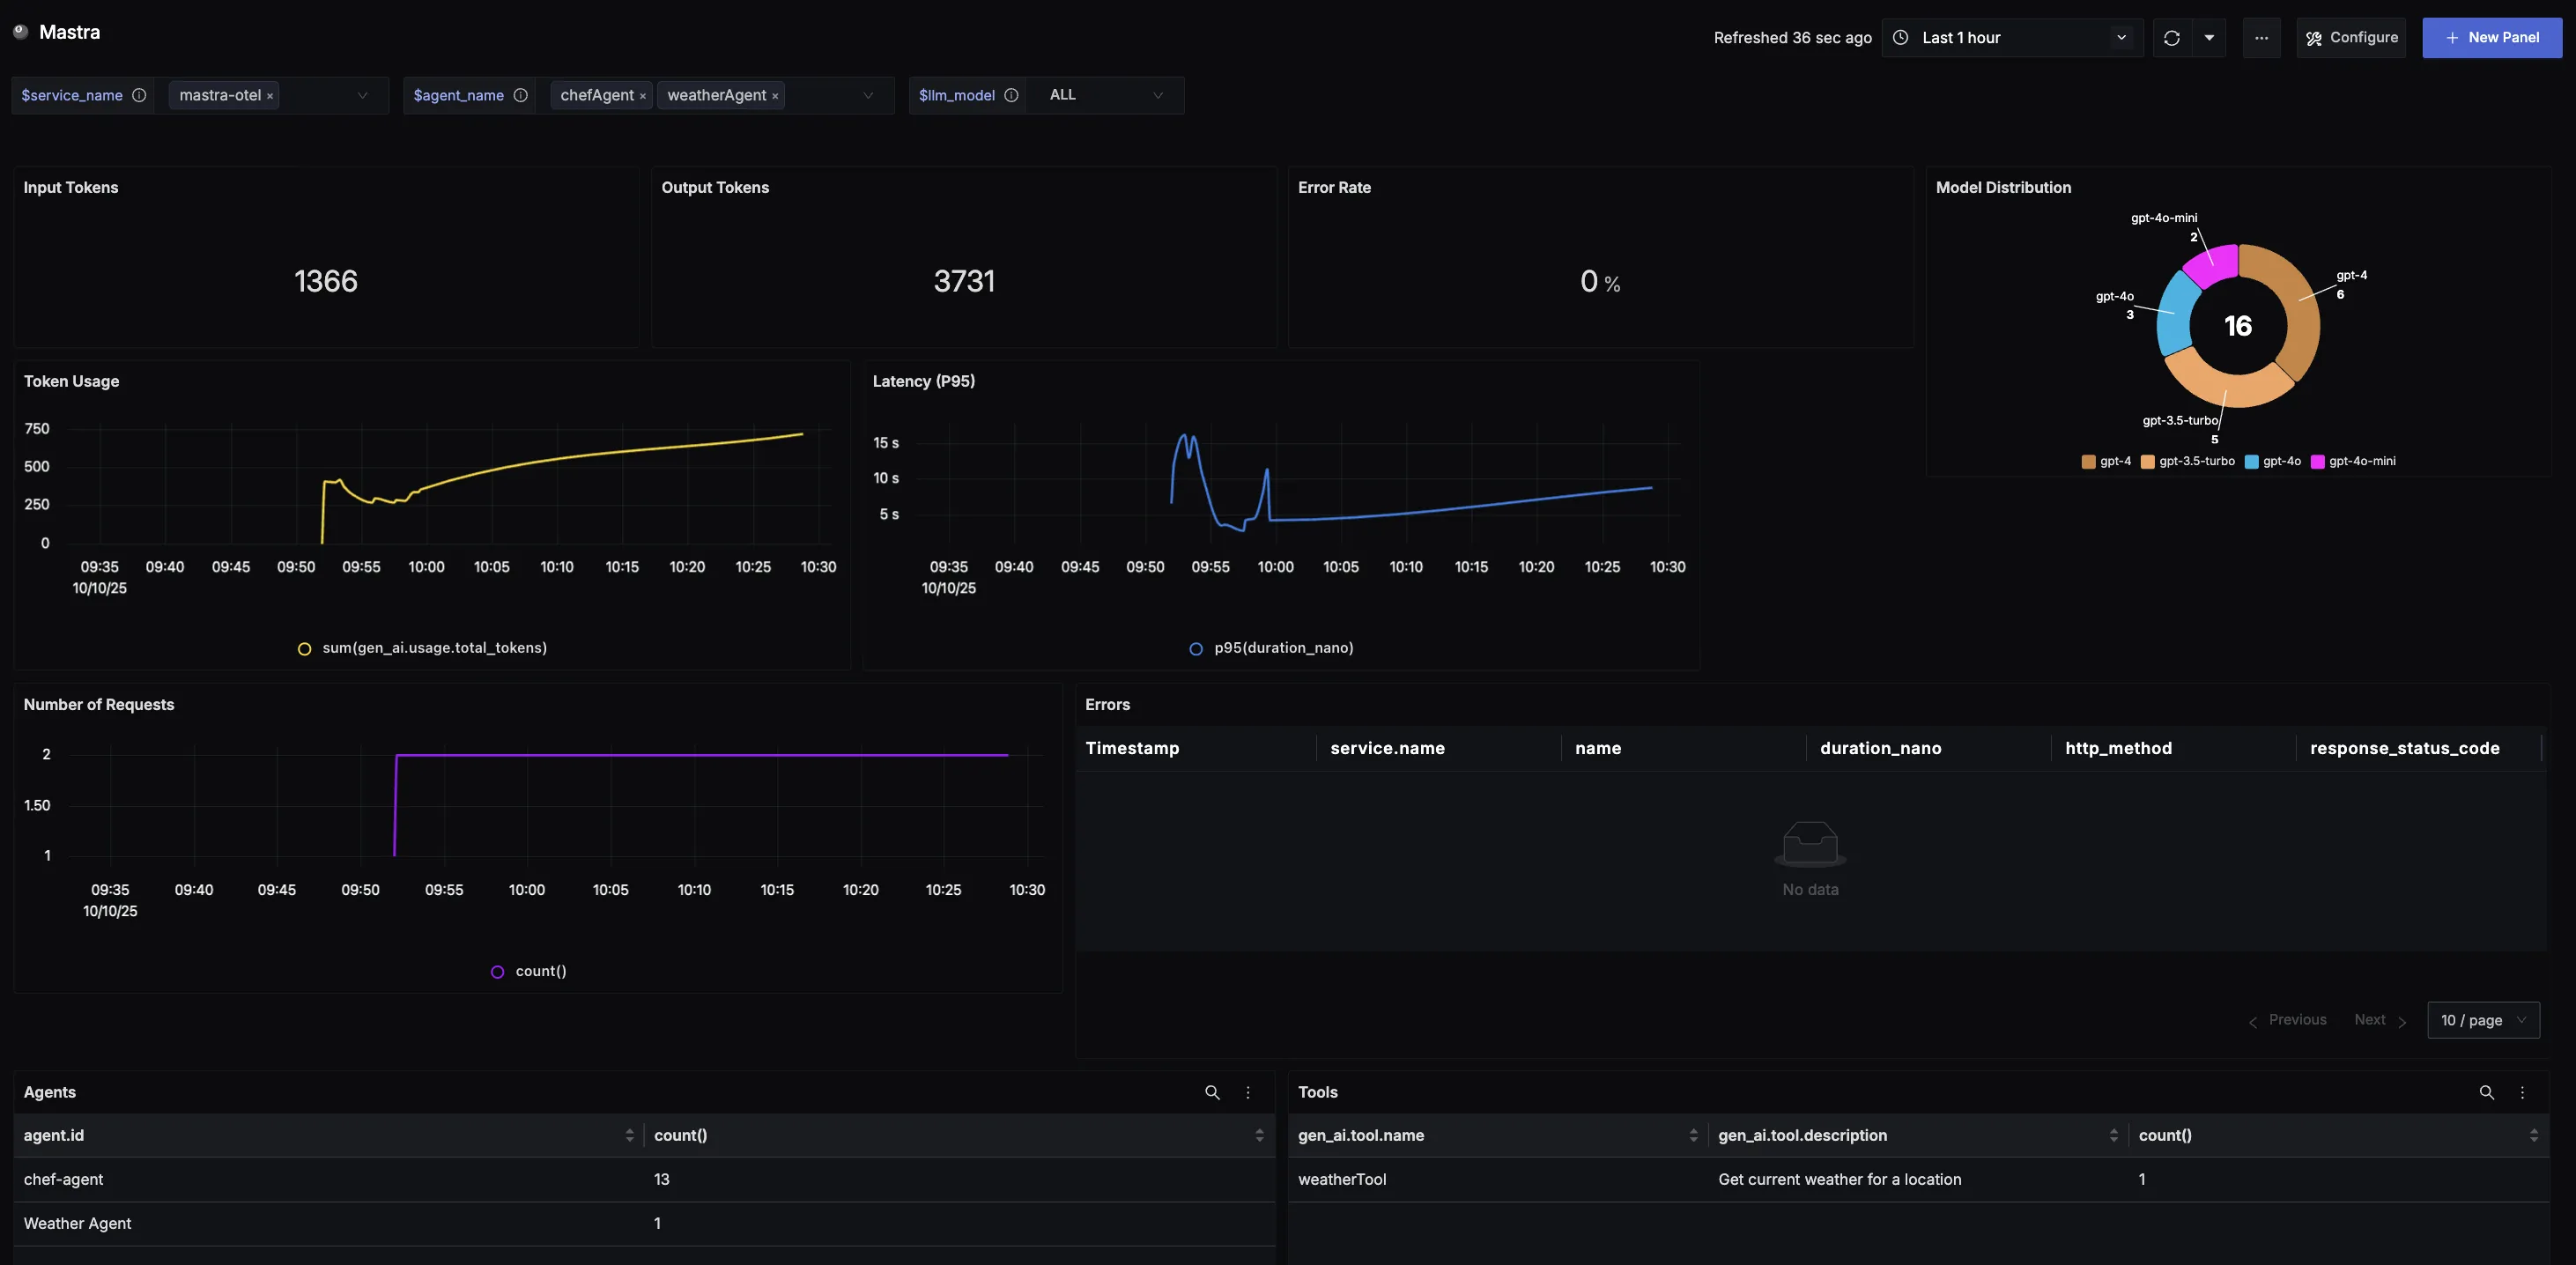
Dashboard
You can also check out our custom Mastra dashboard here which provides specialized visualizations for monitoring your Masrta usage in applications. The dashboard includes pre-built charts specifically tailored for LLM usage, along with import instructions to get started quickly.