Celery Messaging Queues
Celery is a powerful, production-ready asynchronous task queue for Python, enabling resource-intensive or long-running tasks to execute in the background independently from your main application process. It has become especially popular among teams building applications with Large Language Models (LLMs), thanks to Python’s strong presence in the LLM ecosystem.
SigNoz provides out-of-the-box (OOTB) integration with Celery through spans collected via OpenTelemetry. This integration delivers comprehensive visibility into your Celery infrastructure, workers, and tasks, facilitating powerful diagnostics.
Overview Page
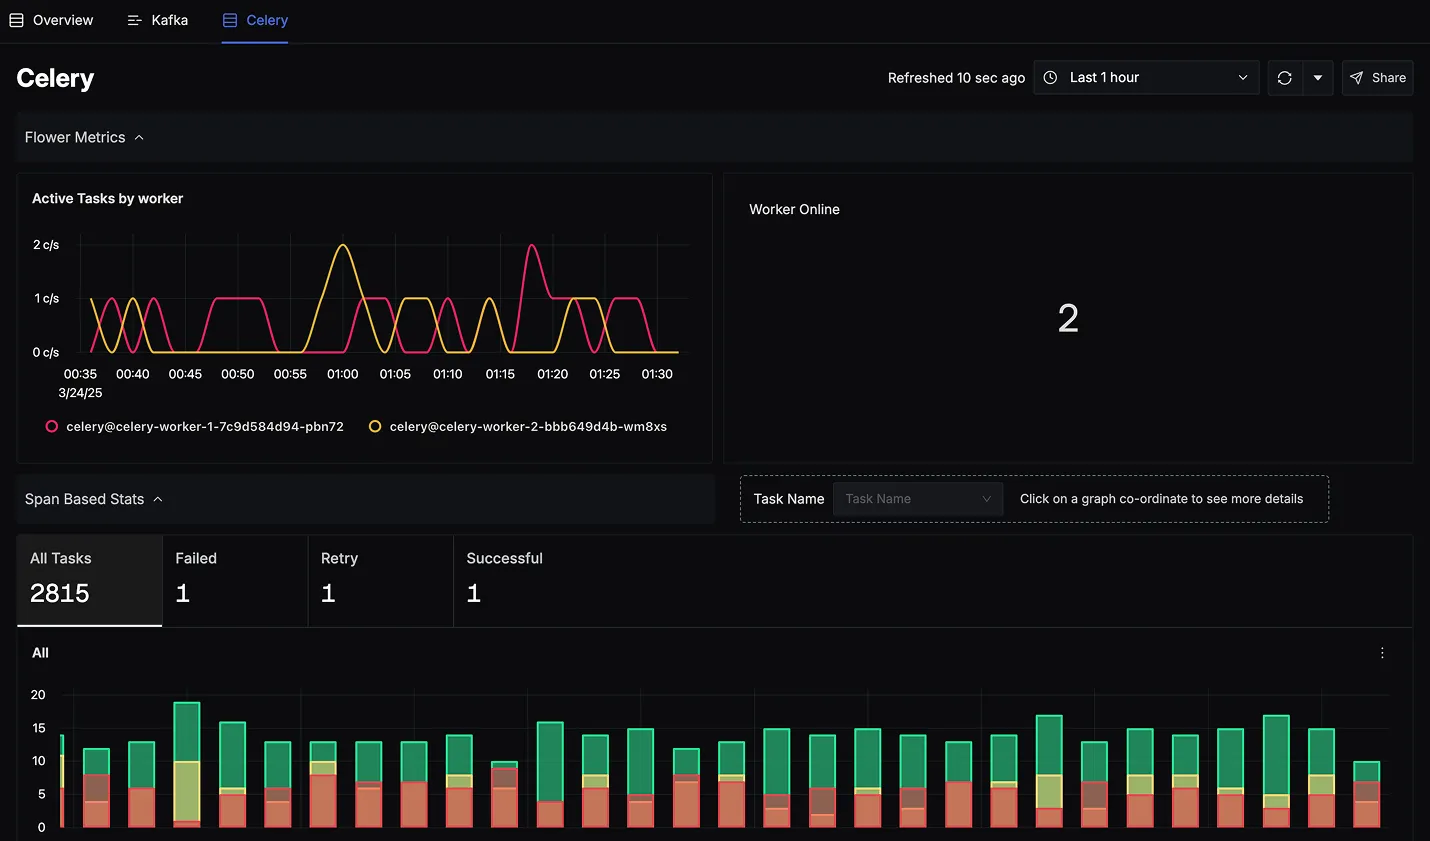
The Celery overview page provides a real-time snapshot of your Celery task infrastructure:
- Active Tasks by Worker: Visualize how many tasks each worker is actively executing over time.
- Worker Online Status: Instantly see how many Celery workers are currently online.
- Span-Based Stats: Get a high-level view of total tasks executed with a breakdown by:
- All Tasks
- Failed Tasks
- Retry Tasks
- Successful Tasks
- Stacked Bar Visualization: For each task state (success, failure, retry), stacked bars show distribution across time.
- Interactive Filtering: Filter metrics by task name or click on specific data points to drill into detailed spans and traces.
Detailed Celery Metrics
Celery metrics are grouped into two primary categories:
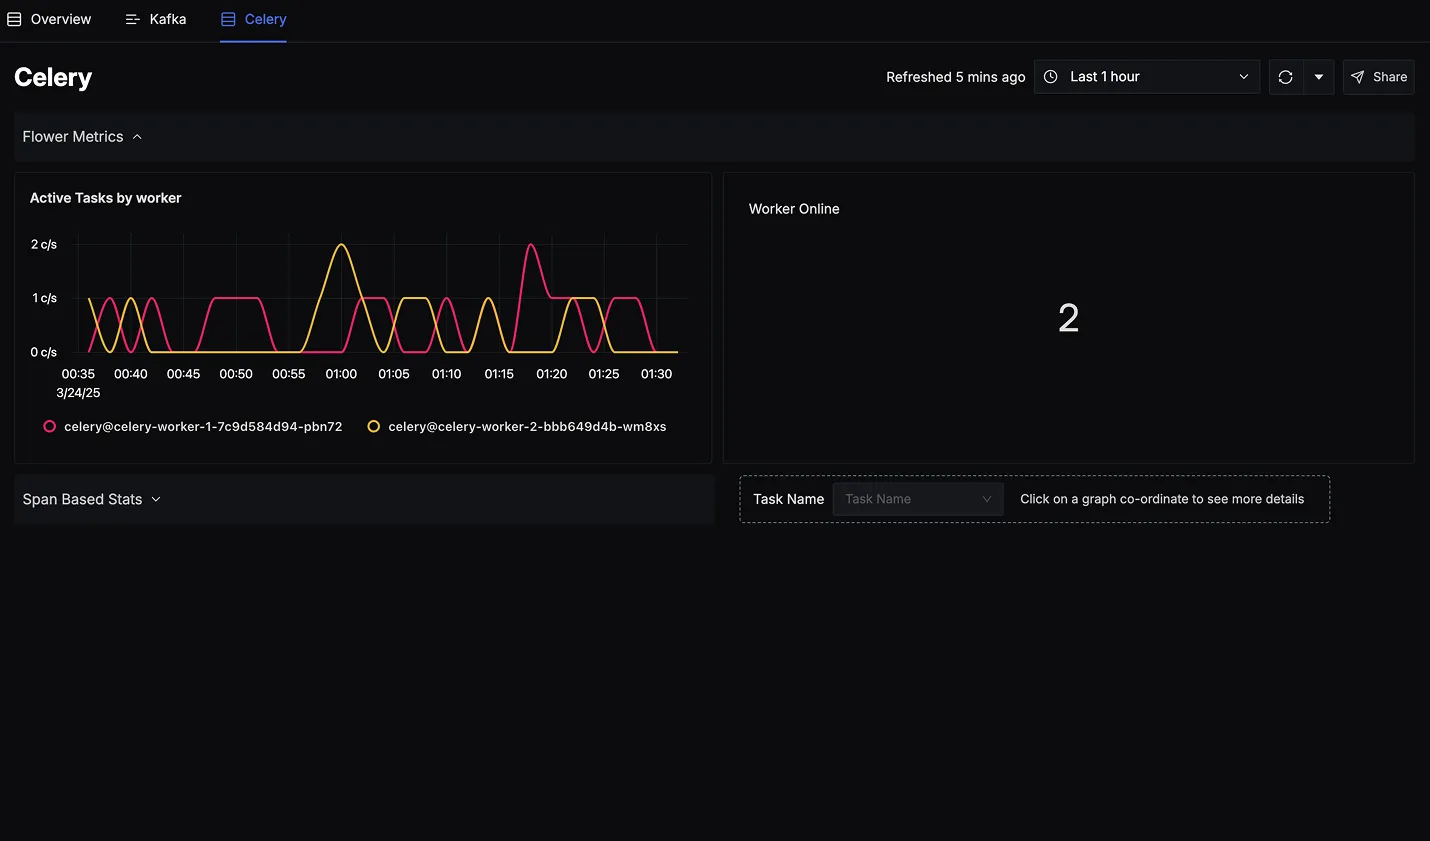
Flower Metrics
These provide a real-time view of active worker performance:
- Active Tasks by Worker: Track how many tasks each Celery worker is executing over time.
- Worker Online Count: Instantly view the number of currently active Celery workers.
- Task Activity Trends: Identify task bursts or idle periods across the cluster.
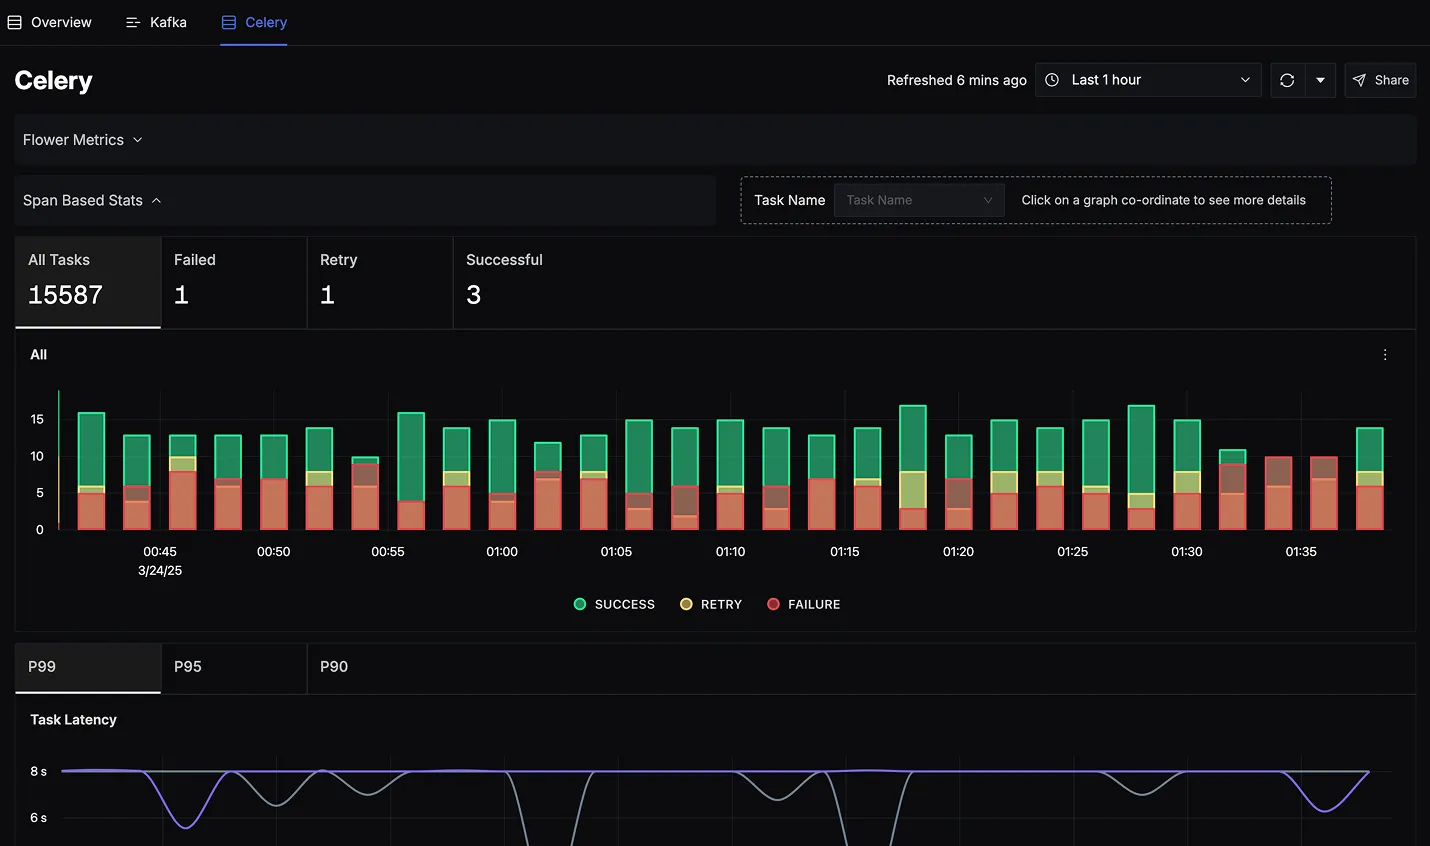
Span Based Stats
Quickly analyze task performance and issues:
- All Tasks: Total tasks executed with success, failure, and retry counts.
- Failed Tasks: Immediate identification of tasks that failed, with direct trace links.
- Retry Tasks: Track retry occurrences to address recurring problems.
- Successful Tasks: Confirm task completion efficiency.
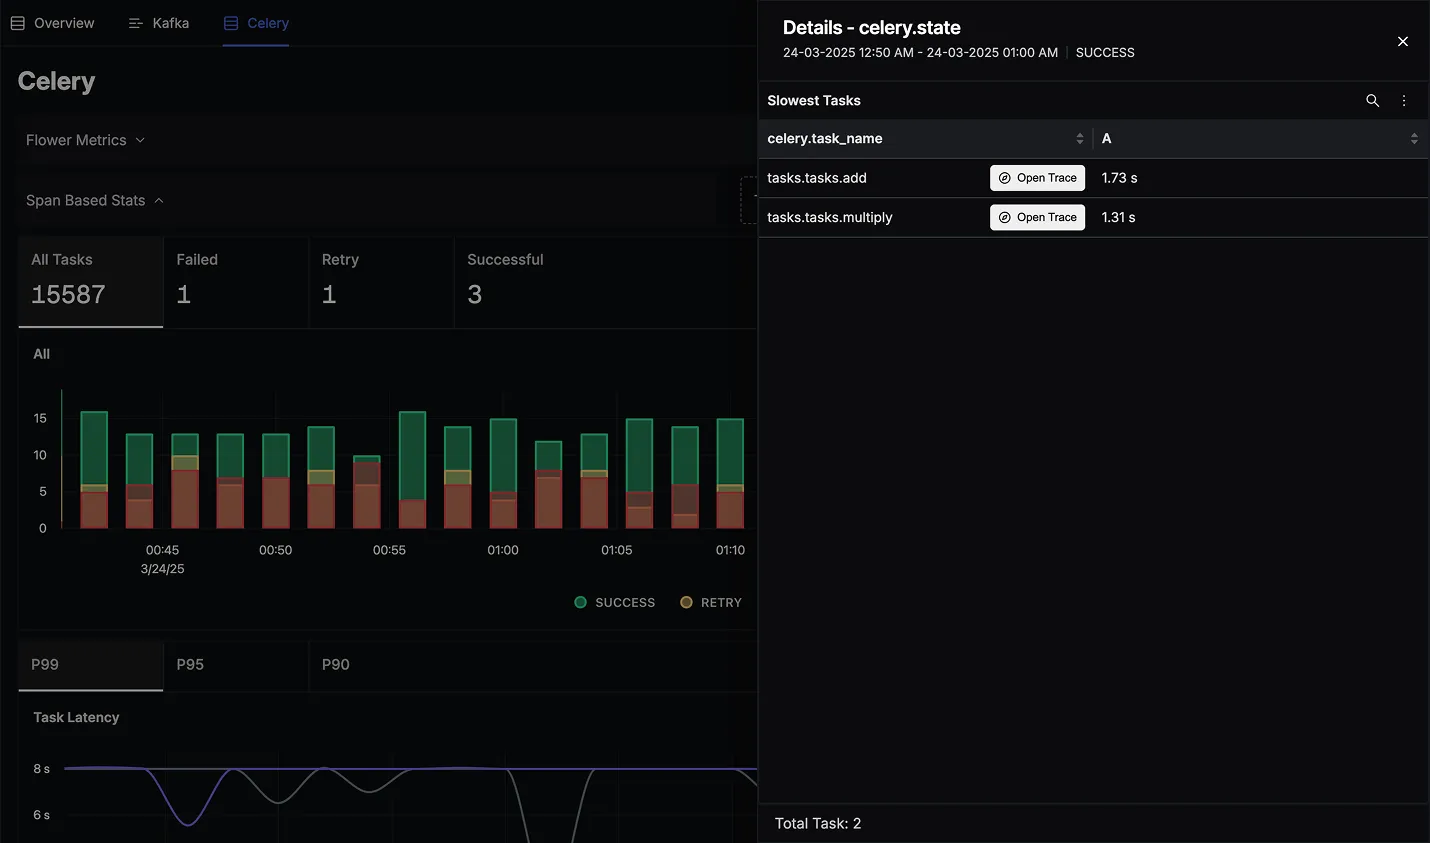
- Trace Drill-down: Clicking task states or latency metrics reveals detailed views of individual tasks, durations, and links to corresponding traces.
- Trace Analysis: Easily pinpoint slow or failing tasks by navigating directly to their detailed traces.
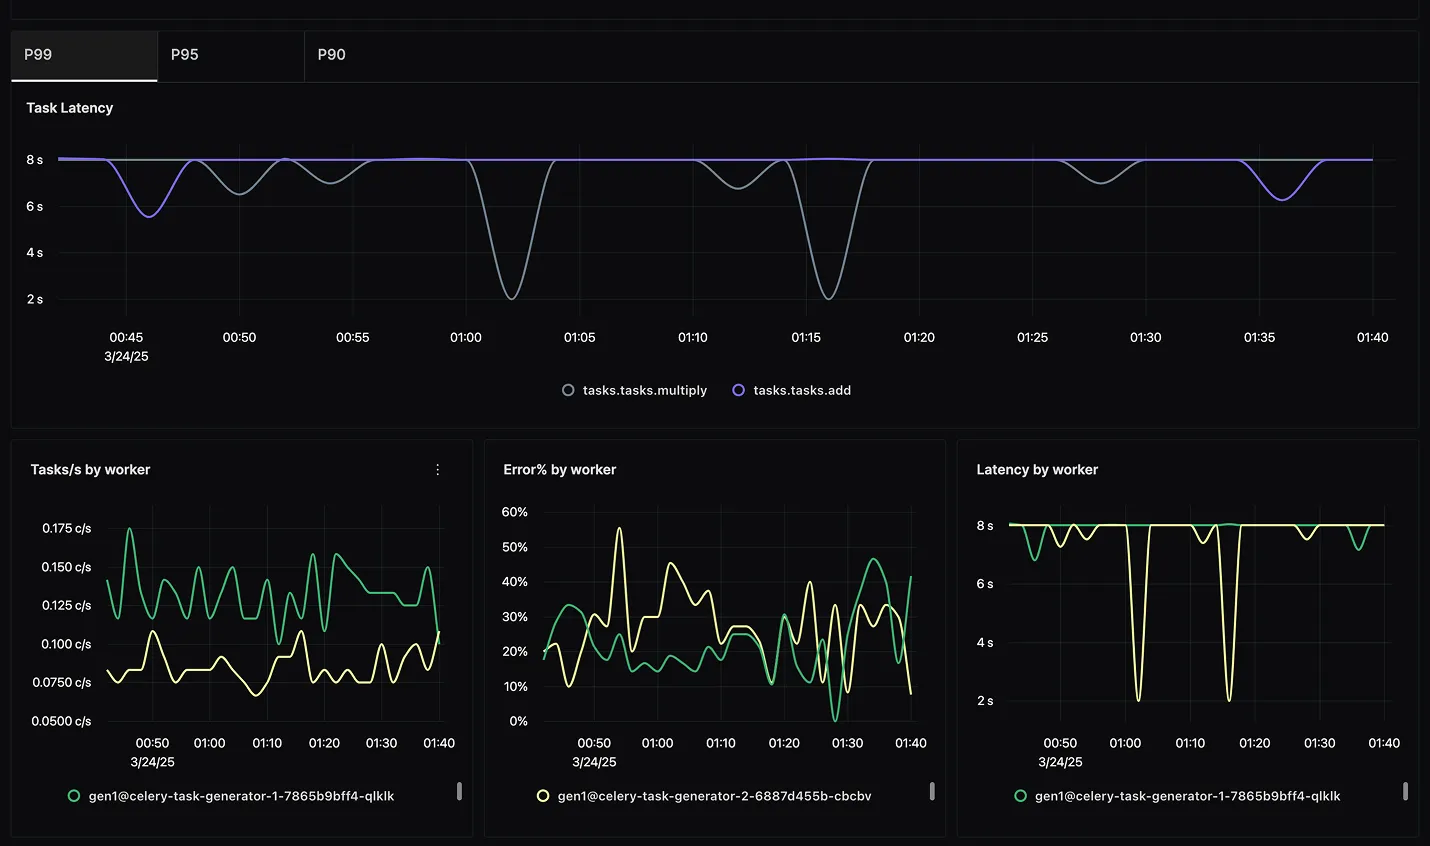
Gain deeper insights at the worker level:
- Tasks per Second by Worker: Monitor real-time throughput per worker.
- Worker Error Percentages: Quickly spot and resolve worker-level errors.
- Latency by Worker: Detect latency spikes for proactive troubleshooting.
Next Steps
Setup you Celery environment to send data to SigNoz. Follow the docs here.
