This document provides an explains how to monitor Docker container Metrics using OTel Collector and SigNoz.
Pre-requisites
- Docker API version 1.22+
- Linux (
docker_statsreceiver does not work on Windows or Mac).
Setup OTel Collector
OpenTelemetry Collector is required to collect metrics from Docker containers. Please refer to this documentation to setup the agent.
Collecting Docker metrics
You will need to configure docker_stats OpenTelemetry receiver for collecting Docker metrics. The receiver queries the local Docker daemon's container stats API for all desired running containers on a configured interval.
Configuring the receiver
Edit the OTel Collector config file to configure the docker_stats receiver as shown below:
receivers:
  docker_stats:
    endpoint: unix:///var/run/docker.sock
    metrics:
      container.cpu.utilization:
        enabled: true
      container.memory.percent:
        enabled: true
      container.network.io.usage.rx_bytes:
        enabled: true
      container.network.io.usage.tx_bytes:
        enabled: true
      container.network.io.usage.rx_dropped:
        enabled: true
      container.network.io.usage.tx_dropped:
        enabled: true
      container.memory.usage.limit:
        enabled: true
      container.memory.usage.total:
        enabled: true
      container.blockio.io_service_bytes_recursive:
        enabled: true
If you are running OTel Collector on the same machine as Docker daemon, you can remove the endpoint line. In case you are running OTel Collector inside a Docker container, make sure you mount the Docker socket from the host machine to the container (-v /var/run/docker.sock:/var/run/docker.sock).
The receiver also supports additional parameters like initial_delay, collection_interval, timeout and others. For more details, refer to the official receiver documentation.
Configuring the processor
To enrich the collected metrics with additional metadata like hostname and OS, you will need to configure Docker Resource Detection Processor by adding the following configuration to the OTel Collector config file:
processors:
  resourcedetection/docker:
    detectors: [env, docker]
    timeout: 2s
    override: false
Configuring the pipelines
Once the receiver and processor is configured, make sure to also enable them in the pipelines section of the OTel Collector config file:
service:
  pipelines:
    metrics:
      receivers: [docker_stats]
      processors: [resourcedetection/docker]
Sending Docker metrics to SigNoz
You will also need to configure exporters in the OTel Collector config file to send metrics to SigNoz. The configuration will be different based on whether you are using a SigNoz Cloud account or a Self-Hosted SigNoz instance.
Configuring the exporter
exporters:
  otlp:
    endpoint: "ingest.{region}.signoz.cloud:443"
    tls:
      insecure: false
    headers:
      signoz-ingestion-key: "{signoz-ingestion-key}"
You would need to replace {region} and {signoz-token} in the above file with the region of your SigNoz Cloud environment and Ingestion Key
exporters:
   otlp:
     endpoint: "{signoz-instance}:4317"
     tls:
       insecure: true
You would need to replace {signoz-instance} with the IP address or FQDN of the machine hosting SigNoz.
Updating the pipelines
You will also need to ensure that this exporter is enabled in the pipelines section of the OTel Collector config file:
service:
  pipelines:
    metrics:
      receivers: [docker_stats]
      exporters: [otlp]
Visualizing Docker Container Metrics
Once you have configured OTel Collector to send Docker metrics to SigNoz, you can start visualizing the metrics in the SigNoz UI.
You can use the pre-configured dashboard for Docker metrics or create your own custom dashboard. To use the pre-configured dashboard, download the dashboard JSON from here and import it to SigNoz by clicking Dashboards → New dashboard → Import JSON:
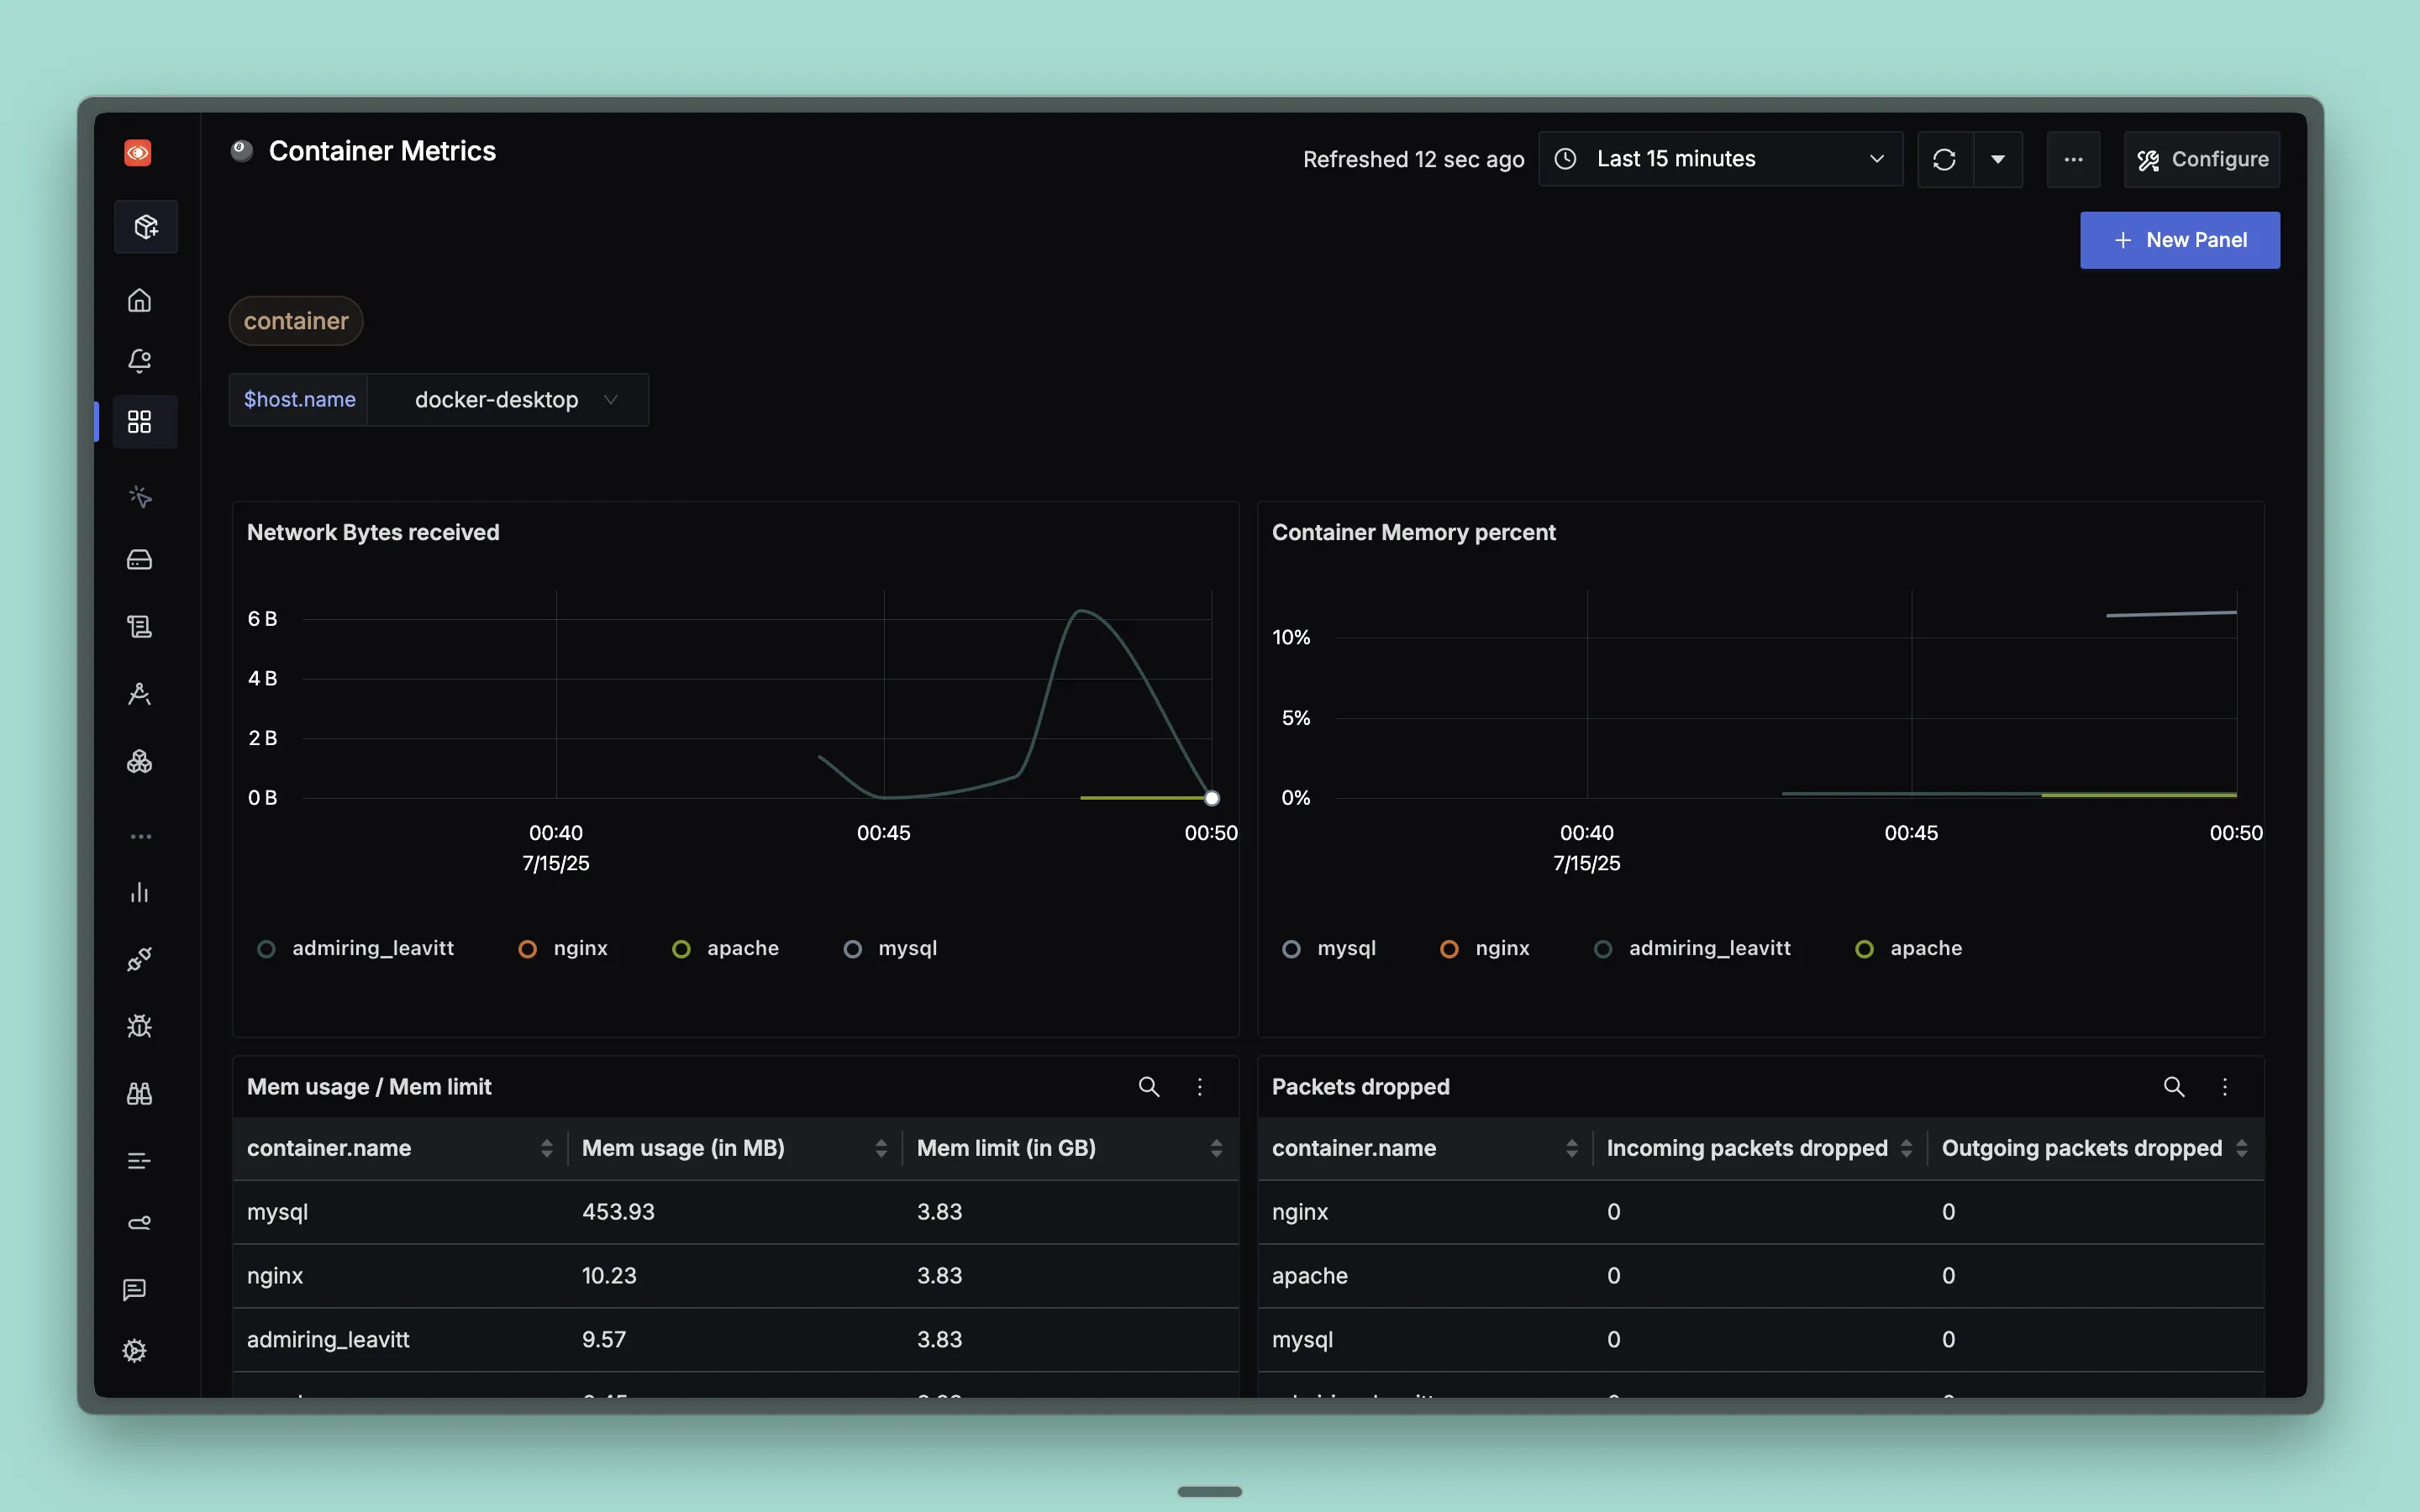
Dashboards → + New dashboard → Import JSON
The pre-defined Container Metrics enables you to select the Docker host from a dropdown list and visualize the following groups of metrics:
- CPU
- Memory
- Network
- Disk
CPU Metrics
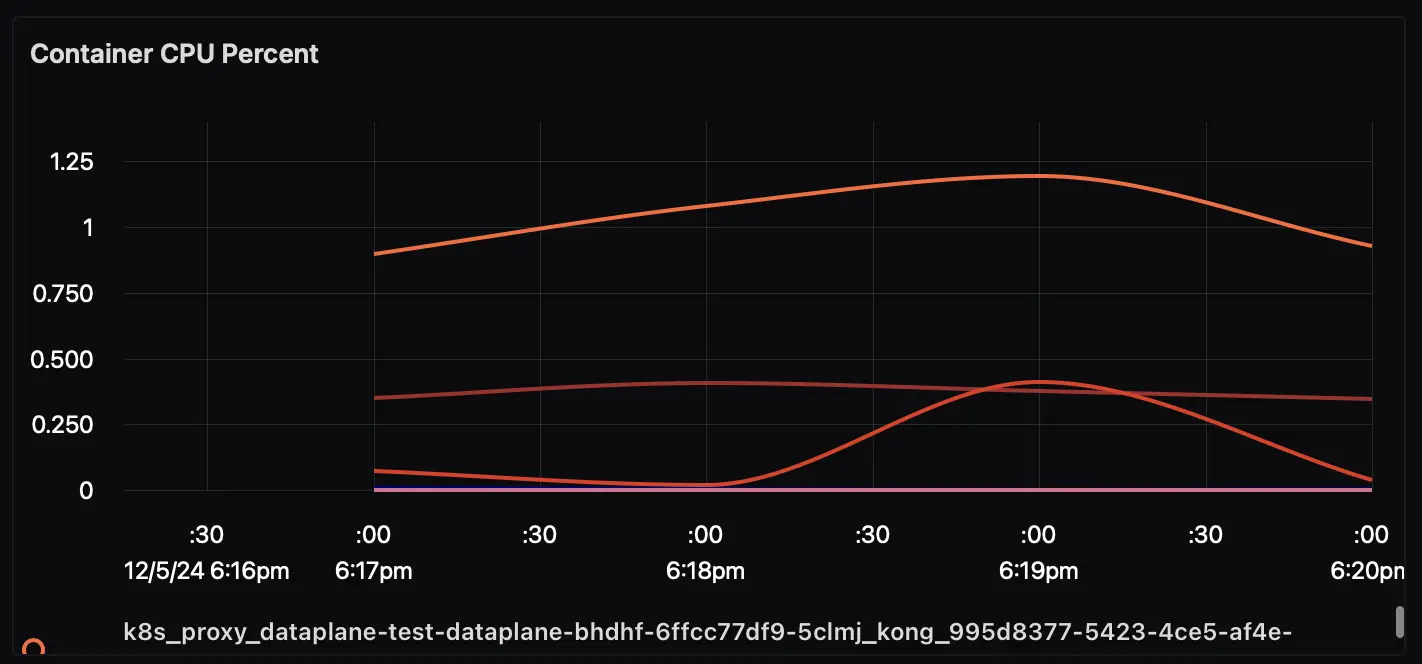
The dashboard contains a panel that shows the percentage of CPU usage (container_cpu_utilization) of the containers:
Memory Metrics
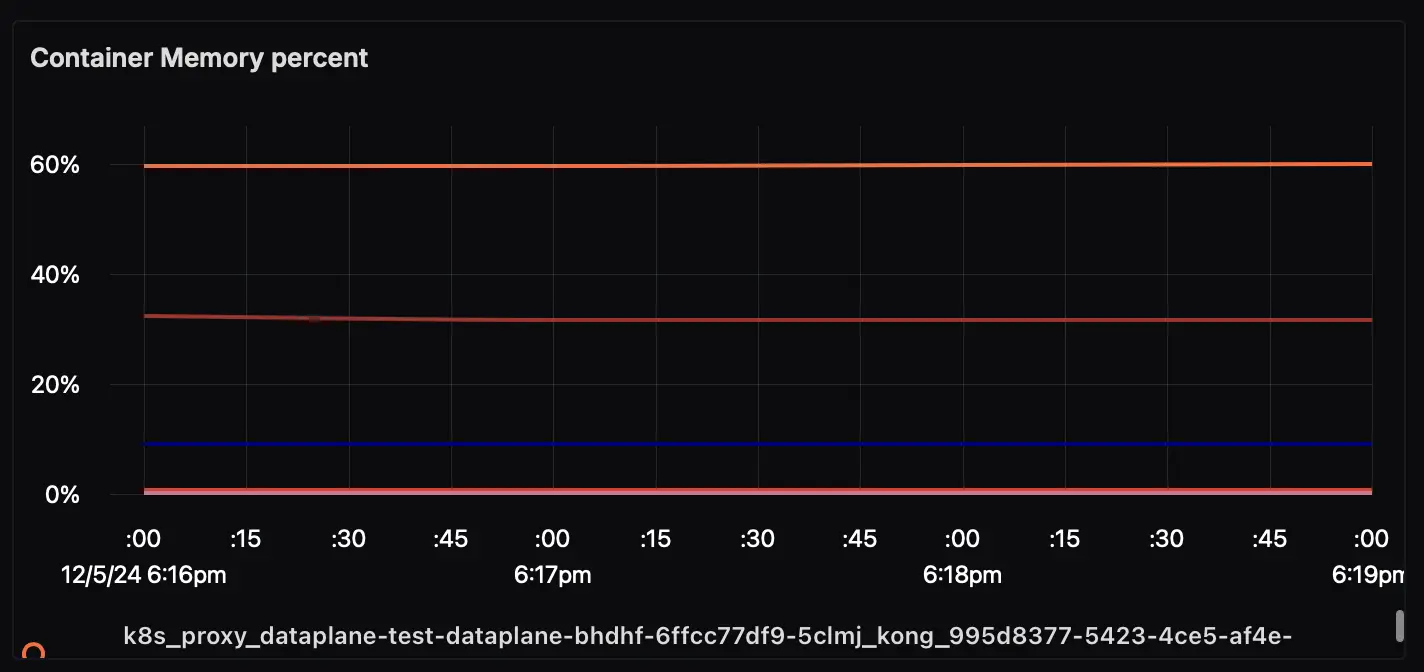
There are couple of panels related to memory. The first panel shows the percentage of memory usage (container_memory_percent) of the containers:
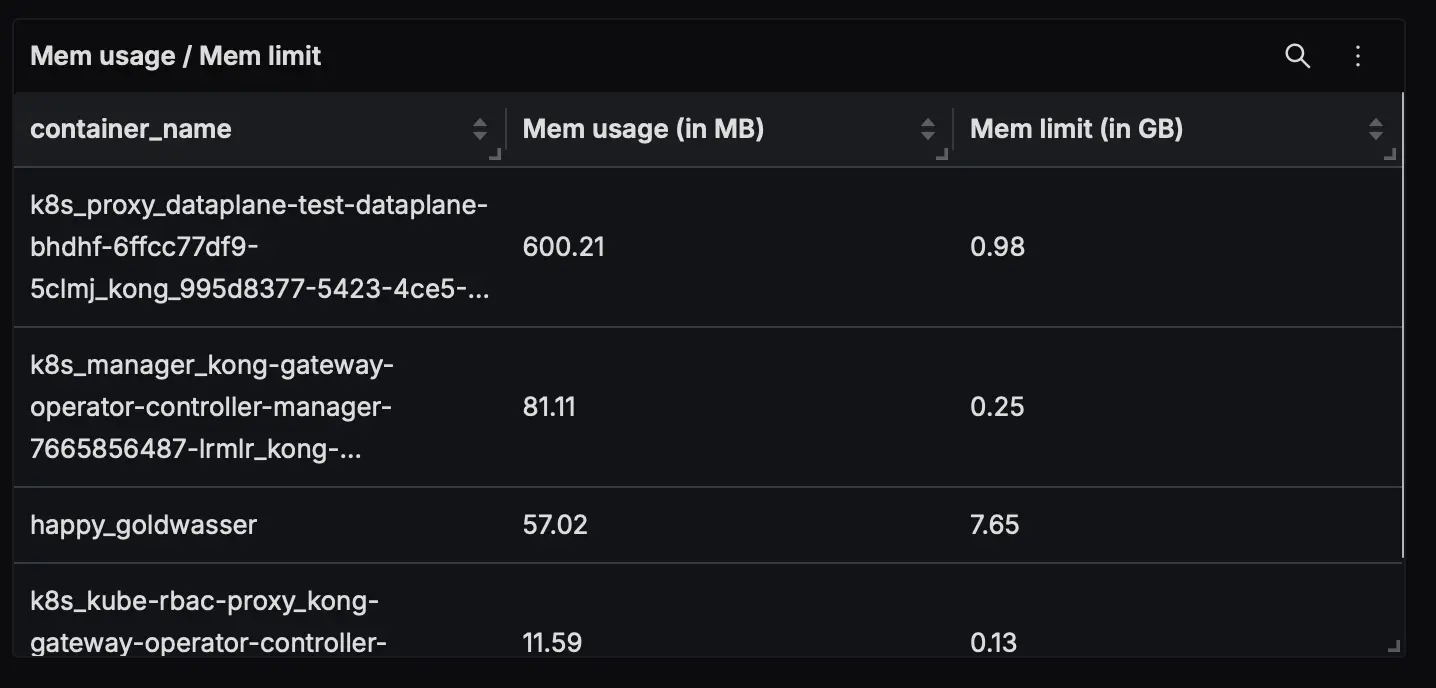
The second panel related to memory shows the memory limits (container_memory_usage_limit) and usage (container_memory_usage_total) of the containers. This is useful to understand if the containers are hitting the memory limits and might need more resources:
Network Metrics
There are two panels that display Network Bytes received and sent by the containers. The panels uses container_network_io_usage_rx_bytes and container_network_io_usage_tx_bytes metrics respectively:

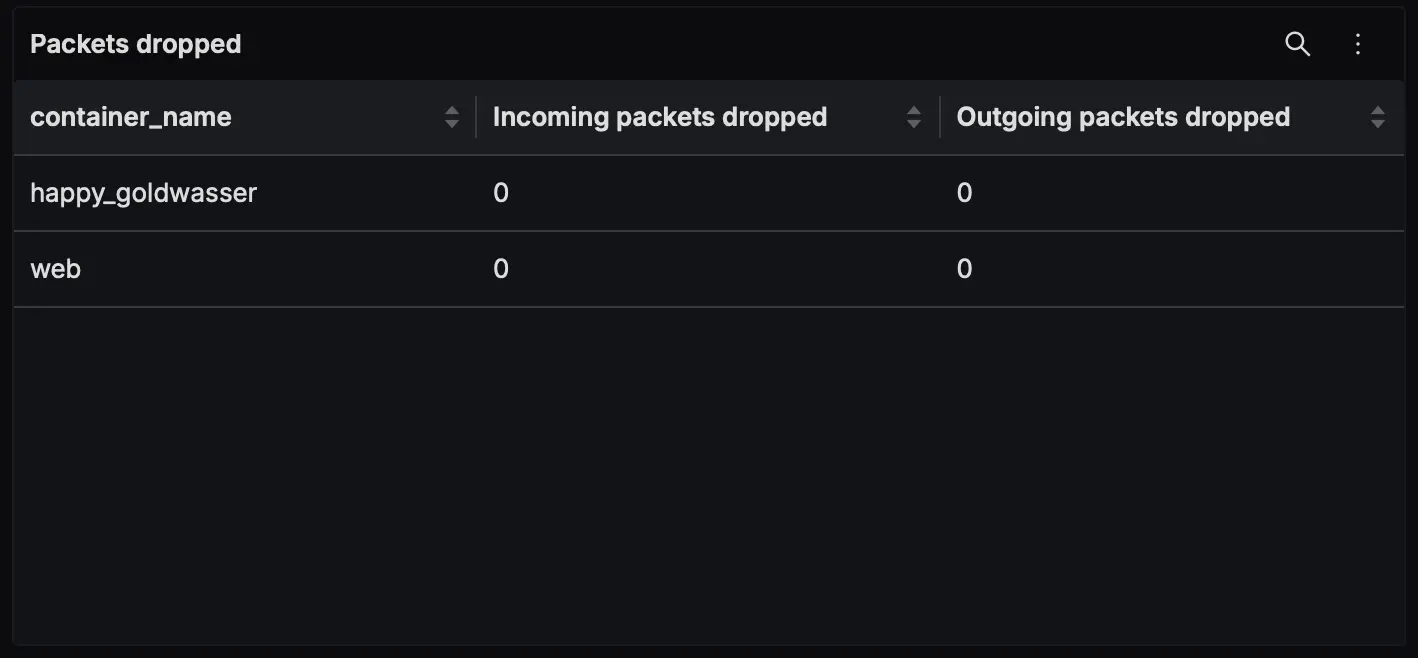
Additionally, there's a panel that shows the number of packets dropped by the containers, which uses container_network_io_usage_rx_dropped and container_network_io_usage_tx_dropped metrics:
Disk Metrics
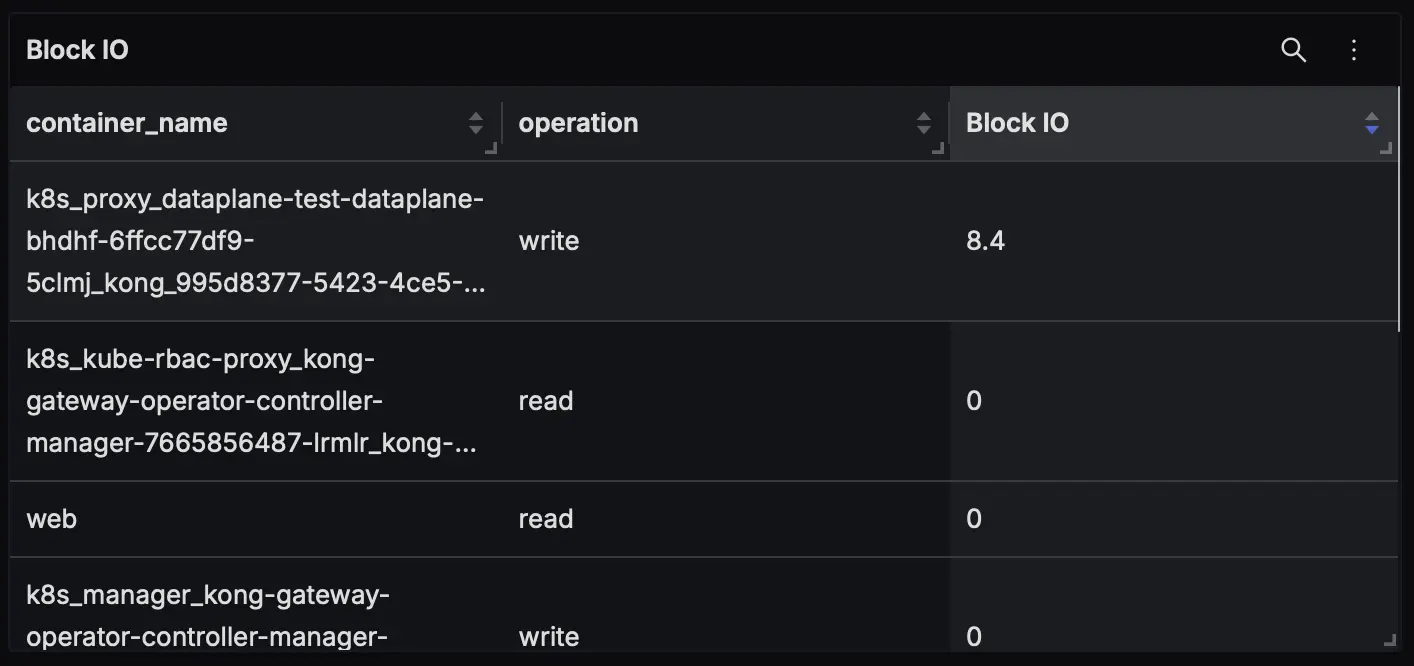
The dashboard also includes a "Block IO" panel based on container.blockio.io_serviced_recursive metric that shows the number of IOs (bio) issued to the block device per second as well as the type of IO operations (read/write):
You can find the full list of metrics collected by the docker_stats receiver and available for querying in dashboards in the official receiver documentation.
