This document explains how to monitor Fly.io application metrics in SigNoz by scraping Fly’s Prometheus federation endpoint with the OpenTelemetry Collector.
Pre-requisites
- A
SigNoz Cloud(or self-hosted) workspace Fly CLI installedand a Fly.io account
Setup
Step 1: Install & log in to Fly.io
macOS:
brew install flyctl
fly auth signup     # or: fly auth login
Linux:
curl -L https://fly.io/install.sh | sh
~/.fly/bin/flyctl auth signup   # or: ~/.fly/bin/flyctl auth login
Verify organizations:
fly orgs list
Sample output:
Name           Slug              Type
----           ----              ----
Your Org       <your-org-slug>   PERSONAL
Team Alpha     team-alpha-123    SHARED
Another Team   team-alpha-456    SHARED
Step 2: Create an org metrics token (for federation)
Generate a token at the org scope:
fly tokens create org --org <your-org-slug>
This prints a value beginning with FlyV1 .... Save only the raw part after FlyV1 to a file (do not include the prefix in the file):
# Save the raw token (without the "FlyV1 " prefix)
echo '<RAW_TOKEN_AFTER_FlyV1>' > fly_federate_token
Step 3: Configure the OpenTelemetry Collector
Follow instructions here to install OpenTelemetry Binary as an agent
Update config.yaml in otelcol-contrib folder and paste the below yaml configuration code in it.
receivers:
  prometheus:
    config:
      scrape_configs:
        - job_name: fly-federate
          scheme: https
          metrics_path: /prometheus/<your-org-slug>/federate   # e.g., /prometheus/personal/federate
          params:
            match[]: ['{__name__=~"fly_.*"}']                  # only Fly metrics
          static_configs:
            - targets: ["api.fly.io"]
          authorization:
            type: FlyV1
            credentials_file: /etc/otel/secret/fly_federate_token
Replace <your-org-slug> with your actual organization slug. Then, add the prometheus receiver to your receivers configuration.
processors:
  transform/fly_metrics:
    error_mode: ignore
    metric_statements:
      - context: datapoint
        statements:
          - 'convert_gauge_to_sum("cumulative", true) where IsMatch(metric.name, "^fly_.*_count$") or metric.name == "fly_instance_cpu" or metric.name == "fly_instance_net_sent_bytes" or metric.name == "fly_instance_net_recv_bytes"'
Add the transform/fly_metrics processor to your processors configuration.
exporters:
  otlphttp:
    endpoint: "https://ingest.{region}.signoz.cloud:443"
    headers:
      signoz-access-token: <YOUR_SIGNOZ_API_KEY>
Replace {region} with your SigNoz Cloud region and <YOUR_SIGNOZ_API_KEY> with your Ingestion Key. If you have already configured the SigNoz exporter, you can skip this step.
service:
  telemetry:
    logs:
      level: debug
  pipelines:
    metrics:
      receivers: [prometheus]
      processors: [transform/fly_metrics, batch]
      exporters: [otlphttp]
Step 4: Run the Collector
From the otelcol-contrib, run the following command:
./otelcol-contrib --config ./config.yaml
Install the OpenTelemetry Collector for Docker.
Update otel.yaml to scrape Fly’s federation endpoint and export to SigNoz.
receivers:
  prometheus:
    config:
      scrape_configs:
        - job_name: fly-federate
          scheme: https
          metrics_path: /prometheus/<your-org-slug>/federate   # e.g., /prometheus/personal/federate
          params:
            match[]: ['{__name__=~"fly_.*"}']                  # only Fly metrics
          static_configs:
            - targets: ["api.fly.io"]
          authorization:
            type: FlyV1
            credentials_file: /etc/otel/secret/fly_federate_token
Replace <your-org-slug> with your actual organization slug. Then, add the prometheus receiver to your receivers configuration.
processors:
  transform/fly_metrics:
    error_mode: ignore
    metric_statements:
      - context: datapoint
        statements:
          - 'convert_gauge_to_sum("cumulative", true) where IsMatch(metric.name, "^fly_.*_count$") or metric.name == "fly_instance_cpu" or metric.name == "fly_instance_net_sent_bytes" or metric.name == "fly_instance_net_recv_bytes"'
Add the transform/fly_metrics processor to your processors configuration.
exporters:
  otlphttp:
    endpoint: "https://ingest.{region}.signoz.cloud:443"
    headers:
      signoz-access-token: <YOUR_SIGNOZ_API_KEY>
Replace {region} with your SigNoz Cloud region and <YOUR_SIGNOZ_API_KEY> with your Ingestion Key. If you have already configured the SigNoz exporter, you can skip this step.
service:
  telemetry:
    logs:
      level: debug
  pipelines:
    metrics:
      receivers: [prometheus]
      processors: [transform/fly_metrics, batch]
      exporters: [otlphttp]
Step 4: Run the Collector (Docker)
docker run --rm -it \
  -v "$(pwd)/otel.yaml:/etc/otel/config.yaml" \
  -v "$(pwd)/fly_federate_token:/etc/otel/secret/fly_federate_token:ro" \
  otel/opentelemetry-collector-contrib:0.103.1 \
  --config /etc/otel/config.yaml
You should see logs indicating the collector started and is sending metrics to the SigNoz ingest endpoint. If you see “failed to scrape” or auth errors, re-check the token step.
Install the SigNoz K8s Infra chart.
- Create the namespace (if needed):
kubectl create namespace signoz
- Create the secret for the Fly token:
kubectl create secret generic fly-federate-token \
  --from-file=fly_federate_token=./fly_federate_token \
  -n signoz
- Create a ConfigMap for
otel.yaml:
kubectl create configmap fly-otel-config \
  --from-file=otel.yaml=./otel.yaml \
  -n signoz
- Update
override-values.yamlwith your cluster details and image version:
global:
  cloud: others
  clusterName: <CLUSTER_NAME>
  deploymentEnvironment: <DEPLOYMENT_ENVIRONMENT>
otelCollectorEndpoint: ingest.{region}.signoz.cloud:443
otelInsecure: false
signozApiKey: <your-ingestion-key>

otelAgent:
  image:
    repository: otel/opentelemetry-collector-contrib
    tag: 0.103.1
  config:
    receivers:
      prometheus:
        config:
          scrape_configs:
            - job_name: fly-federate
              scheme: https
              metrics_path: /prometheus/<your-org-slug>/federate
              params:
                match[]: ['{__name__=~"fly_.*"}']
              static_configs:
                - targets: ["api.fly.io"]
              authorization:
                type: FlyV1
                credentials_file: /etc/otel/secret/fly_federate_token
Replace <your-org-slug> with your actual organization slug. Then, add the prometheus receiver to your receivers configuration.
  processors:
    transform/fly_metrics:
      error_mode: ignore
      metric_statements:
        - context: datapoint
          statements:
            - 'convert_gauge_to_sum("cumulative", true) where IsMatch(metric.name, "^fly_.*_count$") or metric.name == "fly_instance_cpu" or metric.name == "fly_instance_net_sent_bytes" or metric.name == "fly_instance_net_recv_bytes"'
Add the transform/fly_metrics processor to your processors configuration.
  exporters:
    otlphttp:
      endpoint: https://ingest.{region}.signoz.cloud:443
      headers:
        signoz-access-token: <your-ingestion-key>
Replace {region} with your SigNoz Cloud region and <YOUR_SIGNOZ_API_KEY> with your Ingestion Key. If you have already configured the SigNoz exporter, you can skip this step.
    service:
      pipelines:
        metrics:
          receivers: [prometheus]
          processors: [transform/fly_metrics, batch]
          exporters: [otlphttp]
  extraVolumes: # mounts for the config map and secret
    - name: fly-config
      configMap:
        name: fly-otel-config
    - name: fly-token
      secret:
        secretName: fly-federate-token
  extraVolumeMounts:
    - name: fly-config
      mountPath: /etc/otel/config.yaml
      subPath: otel.yaml
    - name: fly-token
      mountPath: /etc/otel/secret/fly_federate_token
      subPath: fly_federate_token
      readOnly: true
- Upgrade the chart:
helm install my-release signoz/k8s-infra -f override-values.yaml
The chart mounts your Fly-specific config, uses the 0.103.1 collector image, and deploys the same pipeline that the Docker/VM instructions run locally.
Manually verify the federation endpoint
Generate a bit of traffic to your app:
for i in {1..30}; do curl -sS https://<your-app-name>.fly.dev >/dev/null; done
Then confirm metrics are returned:
curl -sS -i -G \
  -H "Authorization: FlyV1 $(cat fly_federate_token)" \
  --data-urlencode 'match[]={__name__=~"fly_.*"}' \
  https://api.fly.io/prometheus/<your-org-slug>/federate | head -n 40
You should see lines like fly_instance_cpu_user_seconds_total, fly_instance_memory_resident, etc.
Troubleshooting
Federation or ingestion not working
- The Collector runs, but you don’t see Fly.io metrics in SigNoz, then make sure you used the same
<your-org-slug>value when:- Launching the app with
fly launch --org <your-org-slug> - Configuring
metrics_pathinotel.yaml(for example,/prometheus/<your-org-slug>/federate).
- Launching the app with
Some metrics are not behaving as counters
- You can see some Fly.io metrics, but specific counters don’t appear or behave unexpectedly in Query Builder. It is because of Fly’s
/federateendpoint does not expose metric types, so all metrics are ingested as Gauges by default.- Add those metric names to the
transform/fly_metricsprocessor inotel.yaml, following the examples in this doc, so they are converted from Gauge to Sum - After updating
transform/fly_metrics, restart the Collector and re-check the metrics in Query Builder.
- Add those metric names to the
Collector Version Compatibility
- We have tested this setup with OpenTelemetry Collector Contrib version 0.103.1. If you encounter issues with newer versions, please try reverting to version 0.103 or earlier.
Next steps
- Create alerts: Set up alerts based on fly.io metrics. Learn more.
- Build dashboards: To use the pre-configured dashboard, download the dashboard JSON from Fly.io dashboard JSON .
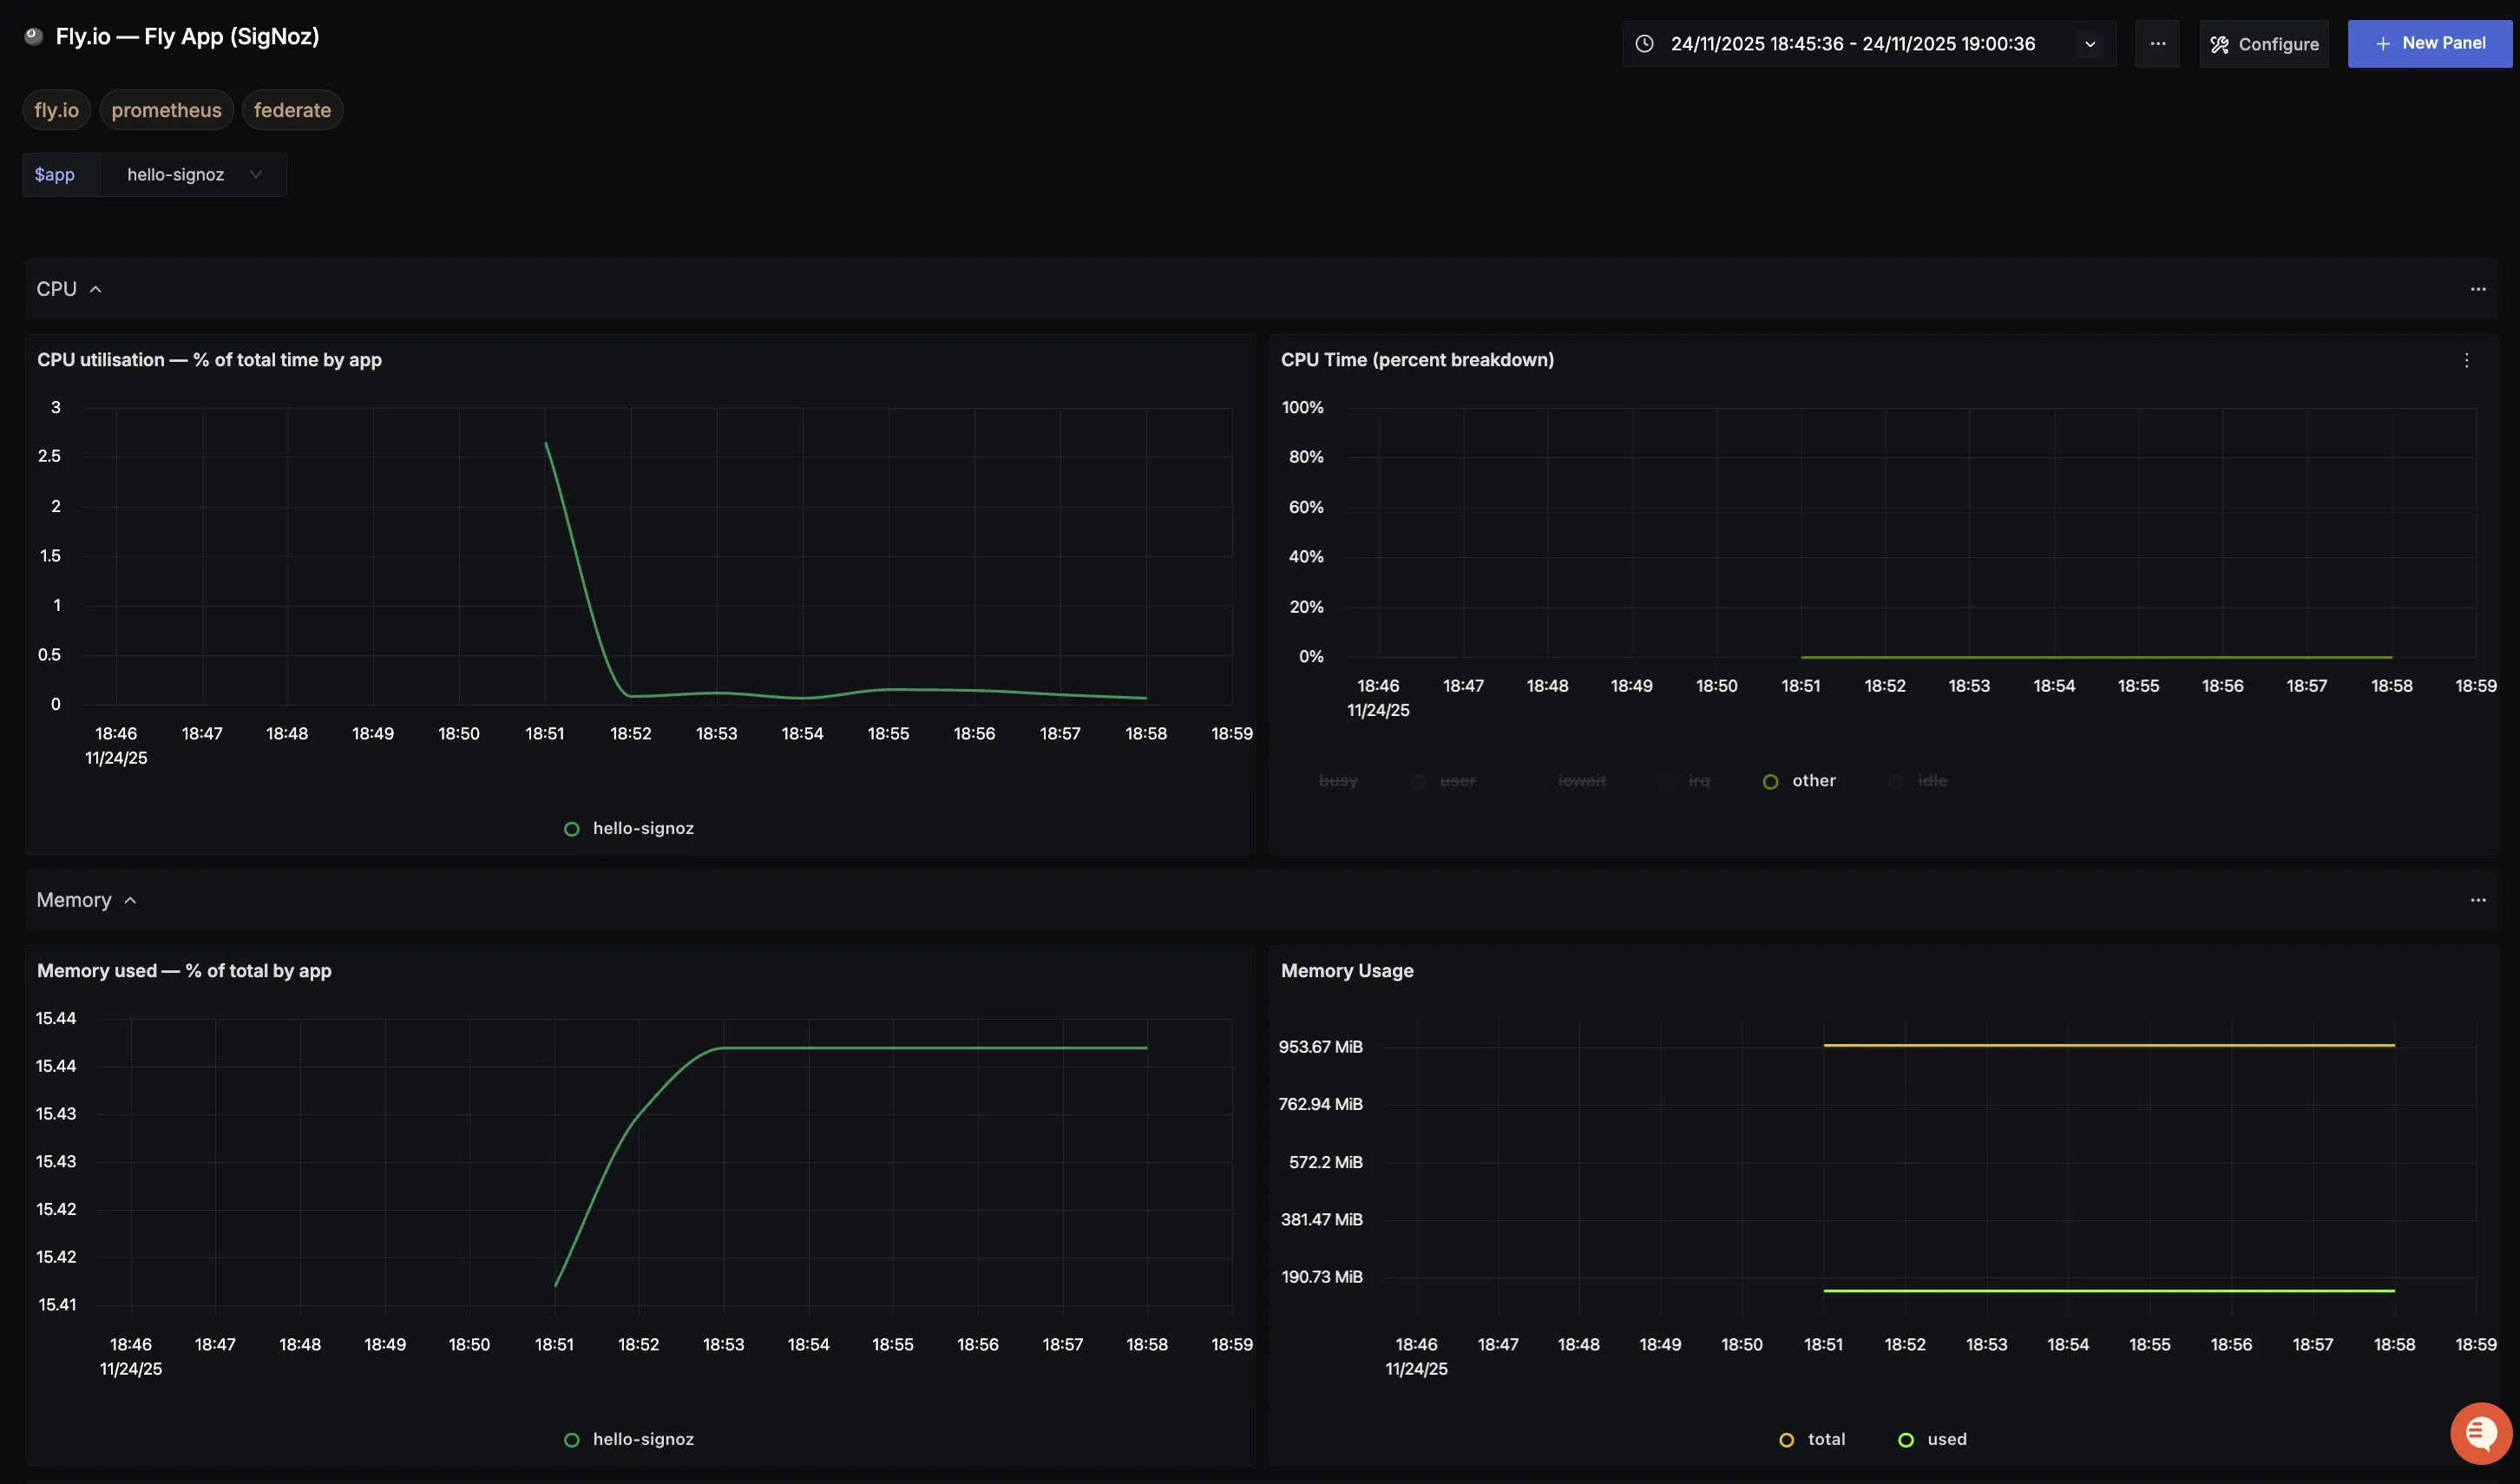
Dashboards → + New dashboard → Import JSON
