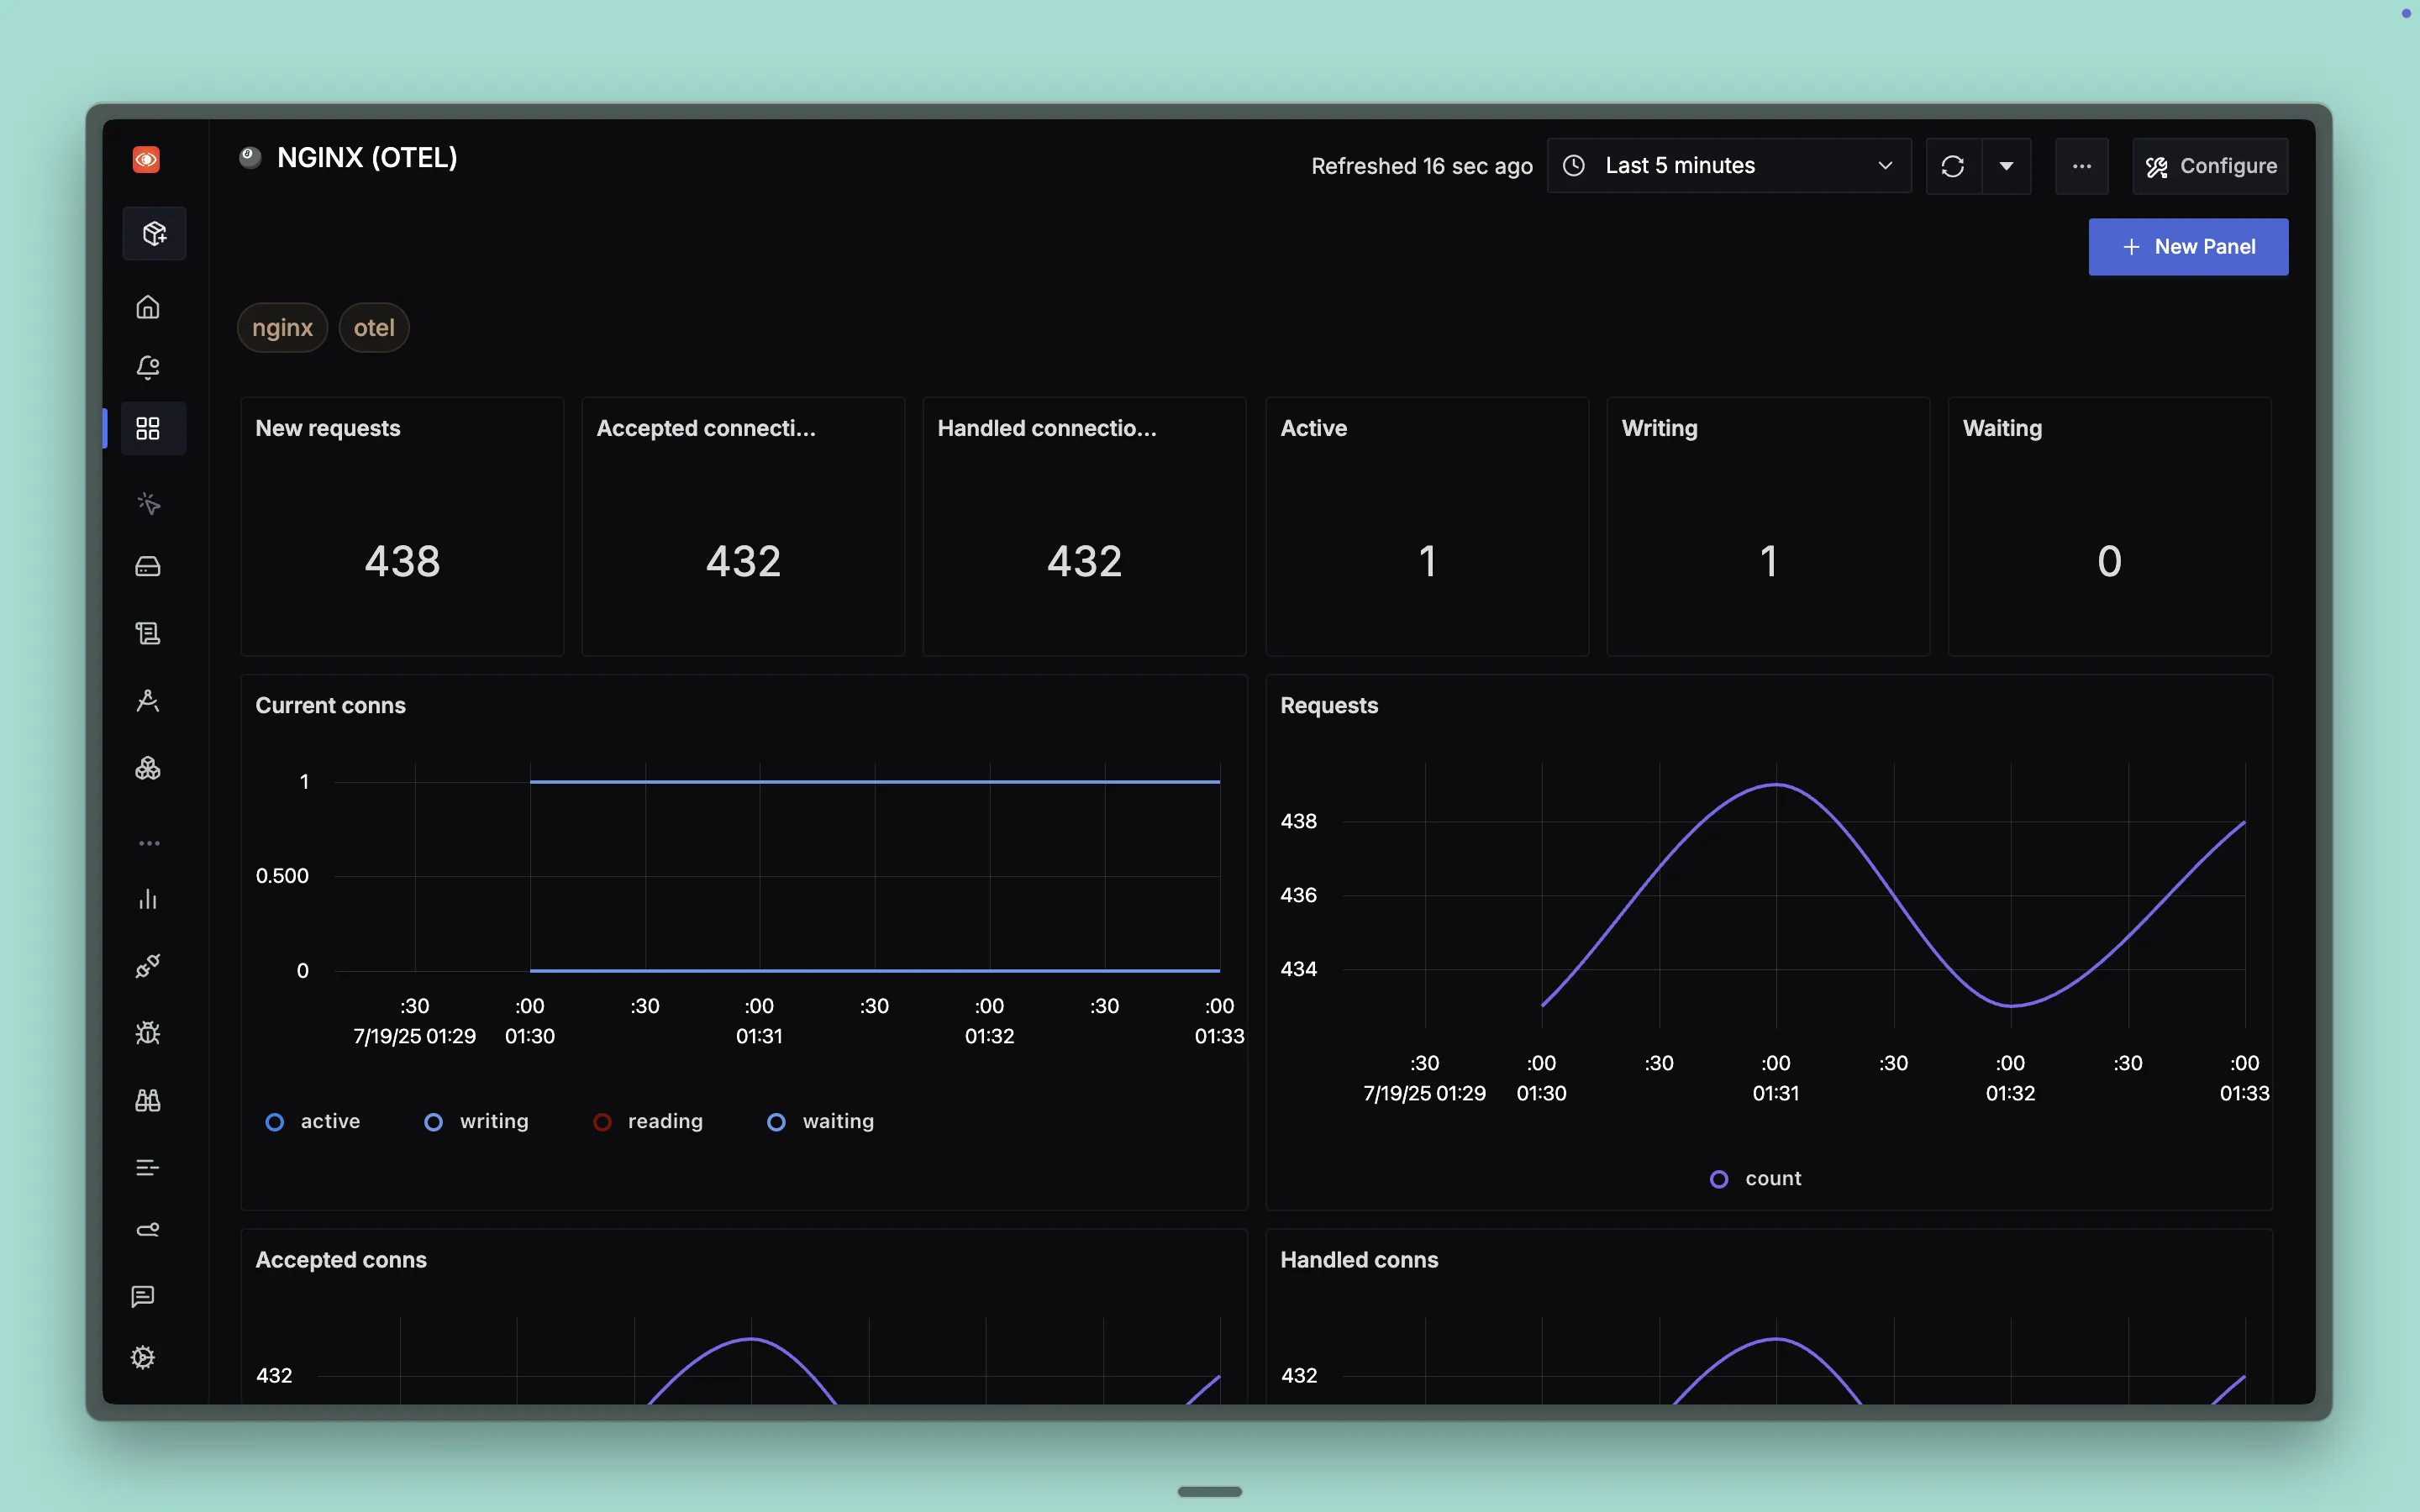
This document provides an explains how to monitor NGINX metrics using OTel Collector and SigNoz.
Pre-requisites
- NGINX with
stub_statusmodule enabled
Setup
Step 1: Setup OTel Collector
OpenTelemetry Collector is required to collect metrics from NGINX. Please refer to this documentation to setup the agent.
Step 2: Preparing NGINX
For the OpenTelemetry Collector to collect NGINX metrics, you need to enable the stub_status module and configure a status endpoint. The stub_status module in NGINX provides real-time server health metrics like active connections, handled requests, and connection states. Refer to this doc for setting up the NGINX stub_status module.
Step 3: Collecting NGINX metrics
You will need to configure the nginx receiver for collecting NGINX metrics. The receiver queries the NGINX status endpoint to collect performance metrics.
Step 4: Configuring the receiver
Edit the OTel Collector config file to configure the nginx receiver as shown below:
receivers:
  nginx:
    endpoint: "<nginx-status-endpoint>" # Example -> http://localhost:80/nginx_status
    collection_interval: 10s
    initial_delay: 1s
    timeout: 60s
Configuration parameters:
endpoint: The URL to the NGINX status page (required)collection_interval: How often to collect metrics (default: 1m)initial_delay: Delay before starting collection (default: 1s)timeout: Request timeout (default: 10s)
You can find more details about the NGINX receiver configuration in the receiver documentation.
Step 5: Configuring the pipelines
Once the receiver and processor is configured, make sure to also enable them in the pipelines section of the OTel Collector config file:
service:
  pipelines:
    metrics:
      receivers: [nginx]
      processors: [resourcedetection, attributes]
Visualizing NGINX Metrics
Once you have configured OTel Collector to send NGINX metrics to SigNoz, you can start visualizing the metrics in the metrics explorer.
You can also use the pre-configured NGINX dashboard to monitor critical NGINX metrics.

Dashboards → + New dashboard → Import JSON
Troubleshooting
Common Issues
No metrics appearing in SigNoz
- Verify NGINX status endpoint is accessible
- Check OTel Collector logs for connection errors
- Ensure firewall allows access to the status endpoint
Permission denied errors
- Check NGINX access restrictions on the status endpoint
- Verify the IP address of OTel Collector is allowed
Metrics showing zero values
- Confirm NGINX is receiving traffic
- Verify the status endpoint shows non-zero values
- Check if NGINX was recently restarted (counters reset)
