Overview
Envoy is a high-performance edge and service proxy. This guide will help you send metrics from Envoy to SigNoz using the OpenTelemetry (OTel) Collector.
Prerequisites
- OpenTelemetry Collector installed: You need the OpenTelemetry Collector running in your environment. See Installation Guides.
- Access to Configuration: You must be able to edit the
otel-collector-config.yamlfile where the collector is running.
Send Envoy Metrics to SigNoz
Step 1: Configure Envoy with OpenTelemetry Sink
Envoy can send metrics to SigNoz using the OpenTelemetry (OTel) protocol. You can learn more about it at OpenTelemetry Stat Sink.
Update your Envoy configuration:
stats_sinks:
  - name: envoy.stat_sinks.open_telemetry
    typed_config:
      "@type": type.googleapis.com/envoy.extensions.stat_sinks.open_telemetry.v3.SinkConfig
      grpc_service:
        envoy_grpc:
          cluster_name: opentelemetry_collector
      # Optional: emit histogram metrics
      # report_histograms_as_deltas: true
      # report_counters_as_deltas: true

static_resources:
  clusters:
    - name: opentelemetry_collector
      type: STRICT_DNS
      lb_policy: ROUND_ROBIN
      typed_extension_protocol_options:
        envoy.extensions.upstreams.http.v3.HttpProtocolOptions:
          "@type": type.googleapis.com/envoy.extensions.upstreams.http.v3.HttpProtocolOptions
          explicit_http_config:
            http2_protocol_options: {}
      load_assignment:
        cluster_name: opentelemetry_collector
        endpoints:
          - lb_endpoints:
              - endpoint:
                  address:
                    socket_address:
                      address: otel-collector # Update with your collector address
                      port_value: 4317
Step 2: Run Envoy with Docker
You can run Envoy using the official Docker image. For more details, see the Envoy Docker Installation Guide.
Save the above configuration as envoy.yaml and run the following command:
docker run --name=envoy -p 9901:9901 -p 10000:10000 -v $(pwd)/envoy.yaml:/etc/envoy/envoy.yaml envoyproxy/envoy:v1.36-latest
Step 3: Configure OpenTelemetry Collector
Ensure your OpenTelemetry Collector is configured to receive OTLP metrics on port 4317 (gRPC). The SigNoz OTel Collector already listens on port 4317 to receive OTLP metrics by default.
For more details on configuring the collector, refer to the OpenTelemetry Collector Configuration guide.
If you're deploying Envoy on Kubernetes, follow these steps to set up the complete monitoring stack.
Step 1: Configure Envoy with Stats Tags
Add custom tags to your Envoy metrics for better filtering and grouping in SigNoz:
stats_sinks:
  - name: envoy.stat_sinks.open_telemetry
    typed_config:
      '@type': type.googleapis.com/envoy.extensions.stat_sinks.open_telemetry.v3.SinkConfig
      grpc_service:
        envoy_grpc:
          cluster_name: opentelemetry_collector
      emit_tags_as_attributes: true

stats_config:
  stats_tags:
    - tag_name: service.name
      fixed_value: envoy-proxy
    - tag_name: namespace
      fixed_value: default
    - tag_name: deployment_environment
      fixed_value: production
    - tag_name: cluster
      fixed_value: k8s-cluster
Step 2: Deploy the OTel Collector on Kubernetes
You'll need to deploy the OpenTelemetry Collector in your Kubernetes cluster to receive metrics from Envoy. The collector should expose port 4317 for gRPC connections, which Envoy will use to send metrics.
For detailed instructions on deploying the OTel Collector on Kubernetes, including configuration examples and best practices, refer to the Kubernetes OpenTelemetry Collector Guide.
Step 3: Mount Envoy Configuration
Mount your Envoy configuration as a ConfigMap in the Envoy deployment:
volumeMounts:
  - name: envoy-config
    mountPath: /etc/envoy
    readOnly: true

volumes:
  - name: envoy-config
    configMap:
      name: envoy-config
Complete Kubernetes Example
For a complete working example including a test application (httpbin), Envoy proxy, traffic generator, and the OTel collector, check the section below:
Click to see the full Kubernetes Manifest
apiVersion: apps/v1
kind: Deployment
metadata:
  name: httpbin
  namespace: default
  labels:
    app: httpbin
spec:
  replicas: 1
  selector:
    matchLabels:
      app: httpbin
  template:
    metadata:
      labels:
        app: httpbin
    spec:
      containers:
        - name: httpbin
          image: kennethreitz/httpbin
          ports:
            - containerPort: 80
              name: http
              protocol: TCP
          resources:
            requests:
              cpu: 50m
              memory: 64Mi
            limits:
              cpu: 200m
              memory: 256Mi

---
apiVersion: v1
kind: Service
metadata:
  name: httpbin
  namespace: default
  labels:
    app: httpbin
spec:
  type: ClusterIP
  ports:
    - port: 80
      targetPort: 80
      protocol: TCP
      name: http
  selector:
    app: httpbin

---
apiVersion: v1
kind: ConfigMap
metadata:
  name: envoy-config
  namespace: default
data:
  envoy.yaml: |
    admin:
      address:
        socket_address:
          address: 0.0.0.0
          port_value: 9901

    static_resources:
      listeners:
      - name: listener_0
        address:
          socket_address:
            address: 0.0.0.0
            port_value: 10000
        filter_chains:
        - filters:
          - name: envoy.filters.network.http_connection_manager
            typed_config:
              "@type": type.googleapis.com/envoy.extensions.filters.network.http_connection_manager.v3.HttpConnectionManager
              stat_prefix: ingress_http
              codec_type: AUTO
              route_config:
                name: local_route
                virtual_hosts:
                - name: backend
                  domains: ["*"]
                  routes:
                  - match:
                      prefix: "/"
                    route:
                      cluster: service_backend
              http_filters:
              - name: envoy.filters.http.router
                typed_config:
                  "@type": type.googleapis.com/envoy.extensions.filters.http.router.v3.Router

      clusters:
      - name: service_backend
        connect_timeout: 0.25s
        type: STRICT_DNS
        lb_policy: ROUND_ROBIN
        load_assignment:
          cluster_name: service_backend
          endpoints:
          - lb_endpoints:
            - endpoint:
                address:
                  socket_address:
                    address: httpbin
                    port_value: 80

      - name: opentelemetry_collector
        type: STRICT_DNS
        lb_policy: ROUND_ROBIN
        typed_extension_protocol_options:
          envoy.extensions.upstreams.http.v3.HttpProtocolOptions:
            "@type": type.googleapis.com/envoy.extensions.upstreams.http.v3.HttpProtocolOptions
            explicit_http_config:
              http2_protocol_options: {}
        load_assignment:
          cluster_name: opentelemetry_collector
          endpoints:
          - lb_endpoints:
            - endpoint:
                address:
                  socket_address:
                    address: otel-collector
                    port_value: 4317

    stats_sinks:
    - name: envoy.stat_sinks.open_telemetry
      typed_config:
        "@type": type.googleapis.com/envoy.extensions.stat_sinks.open_telemetry.v3.SinkConfig
        grpc_service:
          envoy_grpc:
            cluster_name: opentelemetry_collector
        emit_tags_as_attributes: true

    stats_config:
      stats_tags:
      - tag_name: service.name
        fixed_value: envoy-proxy
      - tag_name: namespace
        fixed_value: default
      - tag_name: deployment_environment
        fixed_value: production
      - tag_name: cluster
        fixed_value: k8s-cluster

---
apiVersion: apps/v1
kind: Deployment
metadata:
  name: envoy-proxy
  namespace: default
  labels:
    app: envoy-proxy
spec:
  replicas: 1
  selector:
    matchLabels:
      app: envoy-proxy
  template:
    metadata:
      labels:
        app: envoy-proxy
    spec:
      containers:
        - name: envoy
          image: envoyproxy/envoy:v1.36-latest
          ports:
            - containerPort: 10000
              name: proxy
              protocol: TCP
            - containerPort: 9901
              name: admin
              protocol: TCP
          volumeMounts:
            - name: envoy-config
              mountPath: /etc/envoy
              readOnly: true
          command: ['/usr/local/bin/envoy']
          args:
            - '-c'
            - '/etc/envoy/envoy.yaml'
            - '--log-level'
            - 'info'
          resources:
            requests:
              cpu: 100m
              memory: 128Mi
            limits:
              cpu: 500m
              memory: 512Mi
          livenessProbe:
            httpGet:
              path: /ready
              port: 9901
            initialDelaySeconds: 10
            periodSeconds: 10
          readinessProbe:
            httpGet:
              path: /ready
              port: 9901
            initialDelaySeconds: 5
            periodSeconds: 5
      volumes:
        - name: envoy-config
          configMap:
            name: envoy-config

---
apiVersion: v1
kind: Service
metadata:
  name: envoy-proxy
  namespace: default
  labels:
    app: envoy-proxy
spec:
  type: LoadBalancer
  ports:
    - port: 80
      targetPort: 10000
      protocol: TCP
      name: proxy
    - port: 9901
      targetPort: 9901
      protocol: TCP
      name: admin
  selector:
    app: envoy-proxy

---
apiVersion: apps/v1
kind: Deployment
metadata:
  name: traffic-generator
  namespace: default
  labels:
    app: traffic-generator
spec:
  replicas: 1
  selector:
    matchLabels:
      app: traffic-generator
  template:
    metadata:
      labels:
        app: traffic-generator
    spec:
      containers:
        - name: curl
          image: curlimages/curl:latest
          command:
            - /bin/sh
            - -c
            - |
              echo "Waiting for Envoy to start..."
              sleep 15
              echo "Starting traffic generation..."
              while true; do
                curl -s http://envoy-proxy/get > /dev/null 2>&1
                curl -s http://envoy-proxy/status/200 > /dev/null 2>&1
                curl -s http://envoy-proxy/status/404 > /dev/null 2>&1
                curl -s http://envoy-proxy/status/500 > /dev/null 2>&1
                curl -s http://envoy-proxy/delay/1 > /dev/null 2>&1
                sleep 3
              done
          resources:
            requests:
              cpu: 10m
              memory: 32Mi
            limits:
              cpu: 50m
              memory: 64Mi

---
apiVersion: v1
kind: ConfigMap
metadata:
  name: otel-collector-config
  namespace: default
data:
  config.yaml: |
    receivers:
      otlp:
        protocols:
          grpc:
            endpoint: 0.0.0.0:4317
          http:
            endpoint: 0.0.0.0:4318

    processors:
      batch:
        timeout: 1s
        send_batch_size: 1024
      resource/add_service_name:
        attributes:
          - key: service.name
            value: "envoy-proxy-collector"
            action: upsert

    exporters:
      otlp:
        endpoint: "ingest.{region}.signoz.cloud:443"
        headers:
          "signoz-ingestion-key": "<SIGNOZ_INGESTION_KEY>"
        tls:
          insecure: false
      debug:
        verbosity: detailed

    service:
      pipelines:
        metrics:
          receivers: [otlp]
          processors: [resource/add_service_name, batch]
          exporters: [otlp, debug]

---
apiVersion: apps/v1
kind: Deployment
metadata:
  name: otel-collector
  namespace: default
  labels:
    app: otel-collector
spec:
  replicas: 1
  selector:
    matchLabels:
      app: otel-collector
  template:
    metadata:
      labels:
        app: otel-collector
    spec:
      containers:
        - name: otel-collector
          image: otel/opentelemetry-collector:0.140.0
          args: ['--config=/etc/otel-collector-config/config.yaml']
          ports:
            - containerPort: 4317
              name: grpc
              protocol: TCP
            - containerPort: 4318
              name: http
              protocol: TCP
          volumeMounts:
            - name: otel-collector-config
              mountPath: /etc/otel-collector-config
          resources:
            requests:
              cpu: 100m
              memory: 128Mi
            limits:
              cpu: 500m
              memory: 512Mi
      volumes:
        - name: otel-collector-config
          configMap:
            name: otel-collector-config

---
apiVersion: v1
kind: Service
metadata:
  name: otel-collector
  namespace: default
  labels:
    app: otel-collector
spec:
  type: ClusterIP
  ports:
    - port: 4317
      targetPort: 4317
      protocol: TCP
      name: grpc
    - port: 4318
      targetPort: 4318
      protocol: TCP
      name: http
  selector:
    app: otel-collector
This manifest includes:
- httpbin: A test HTTP service to generate metrics
- Envoy Proxy: Configured to proxy requests to httpbin and send metrics to the OTel collector
- Traffic Generator: Generates continuous traffic to produce metrics
- OTel Collector: Receives metrics from Envoy and forwards them to SigNoz
Step 4: Deploy to Kubernetes
Apply the complete manifest:
kubectl apply -f envoy-monitoring-stack.yaml
Verify all pods are running:
kubectl get pods -n default
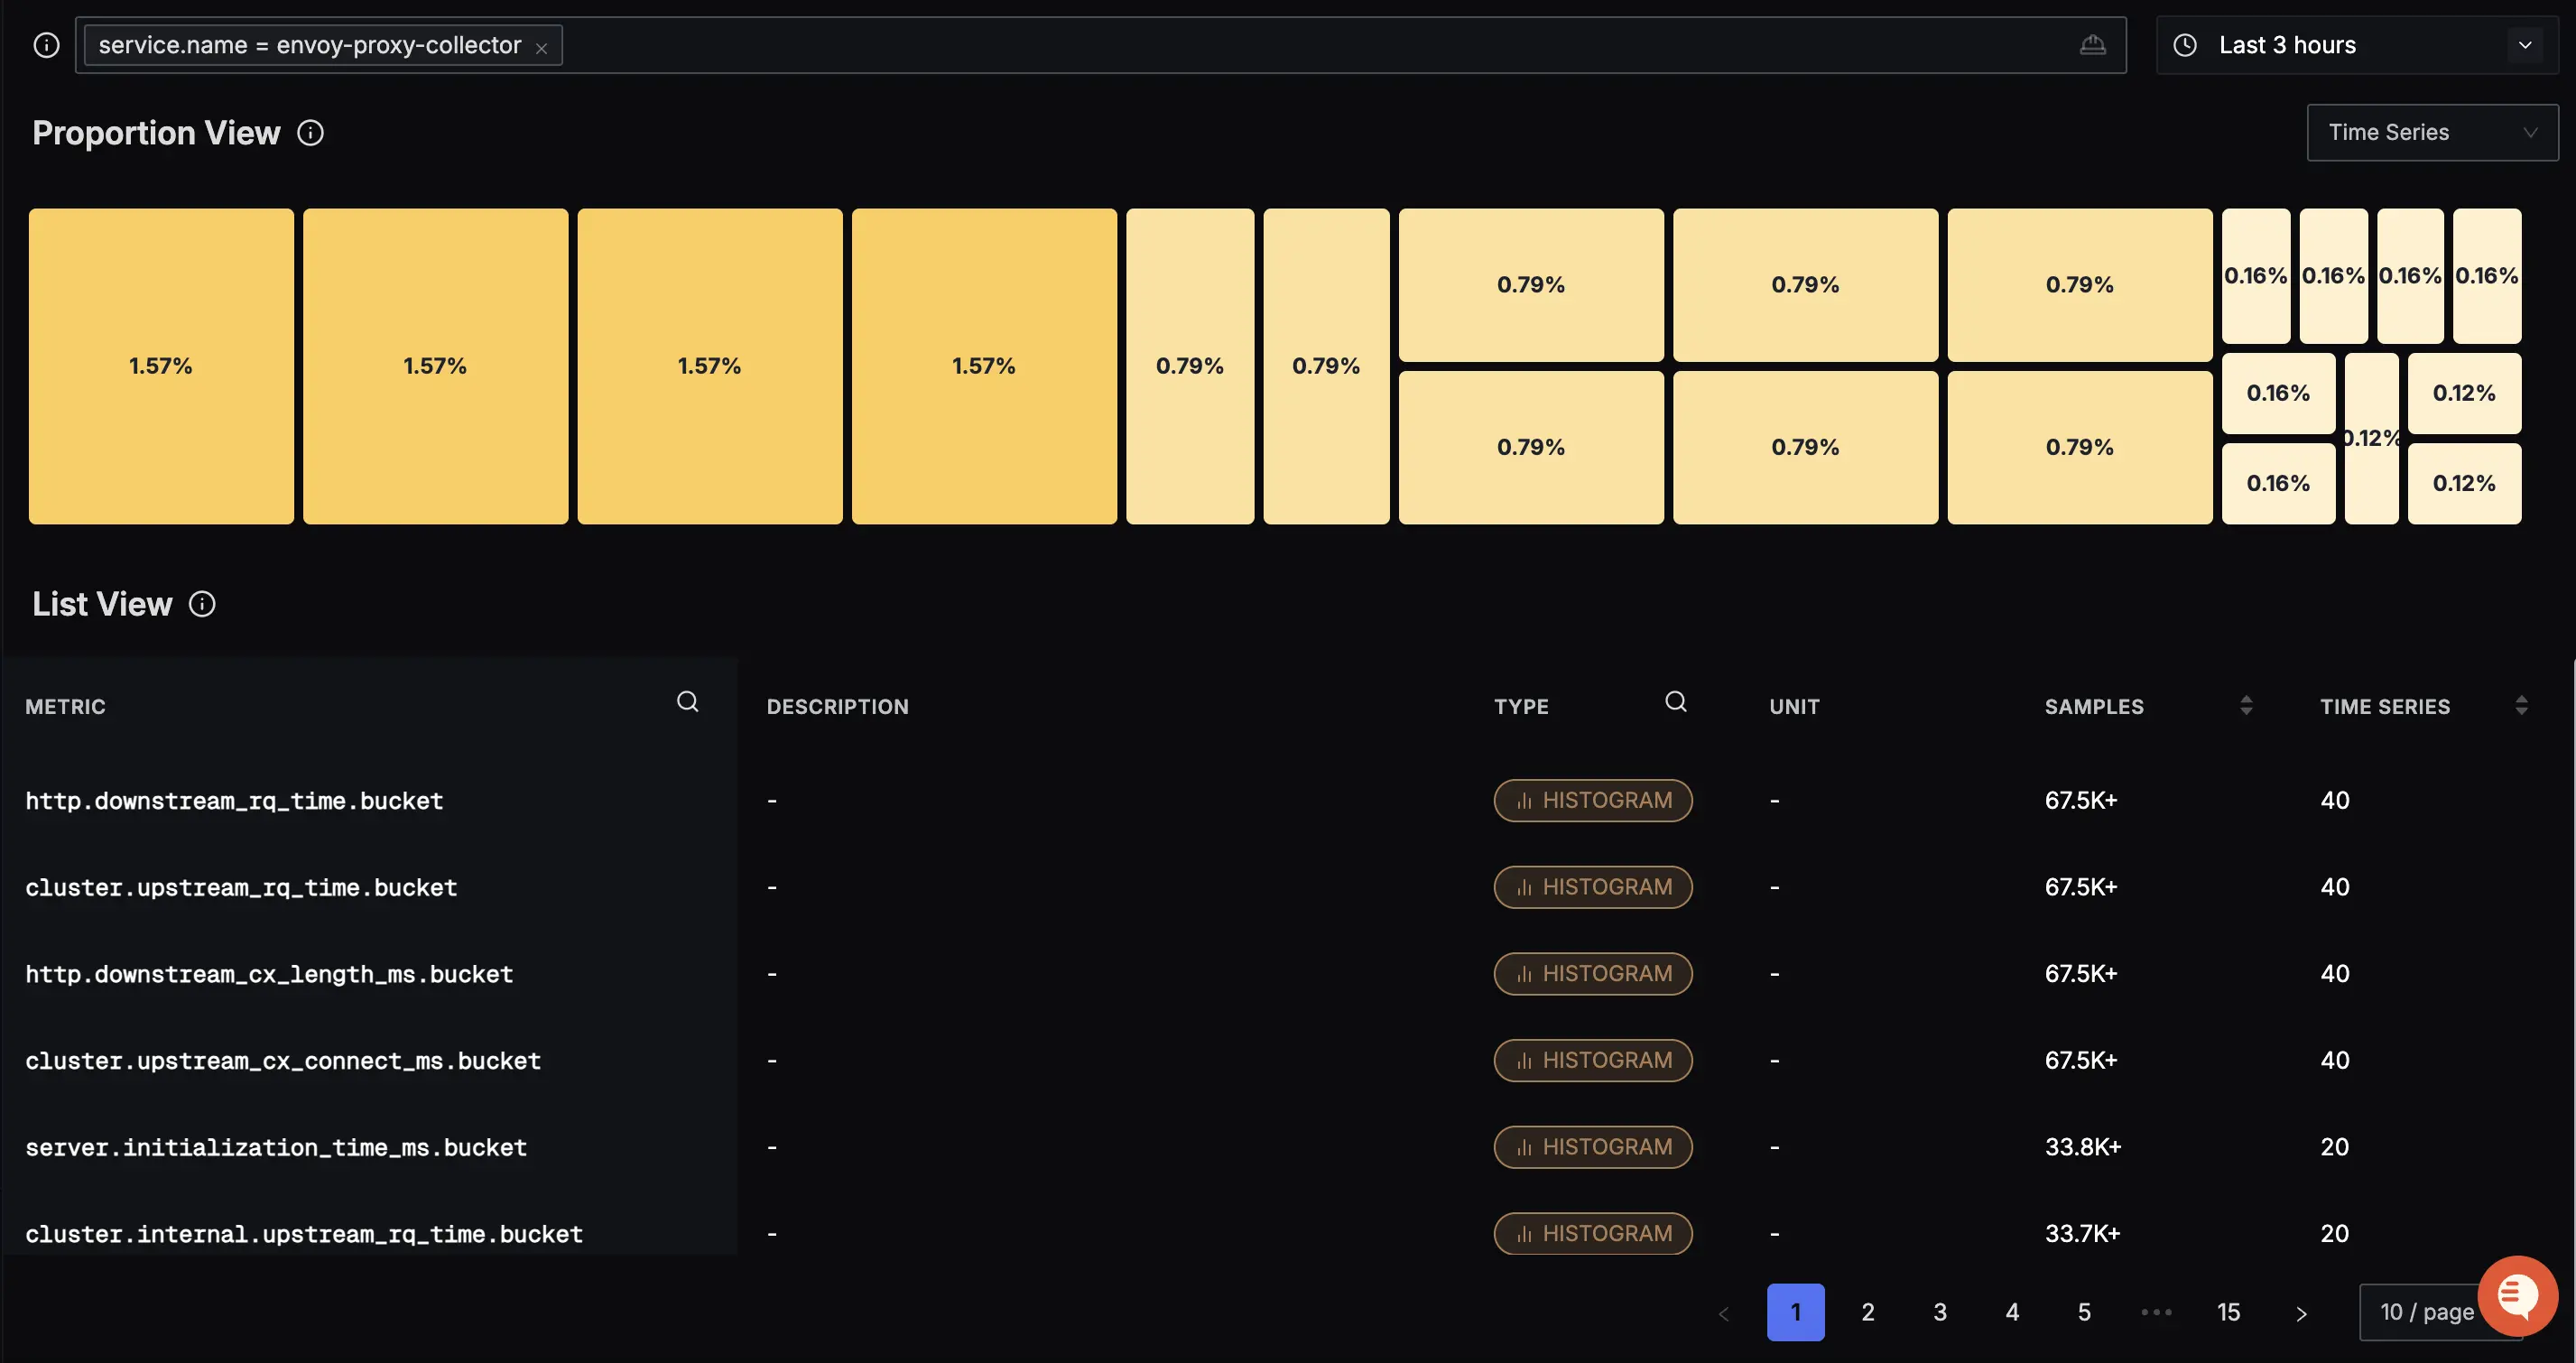
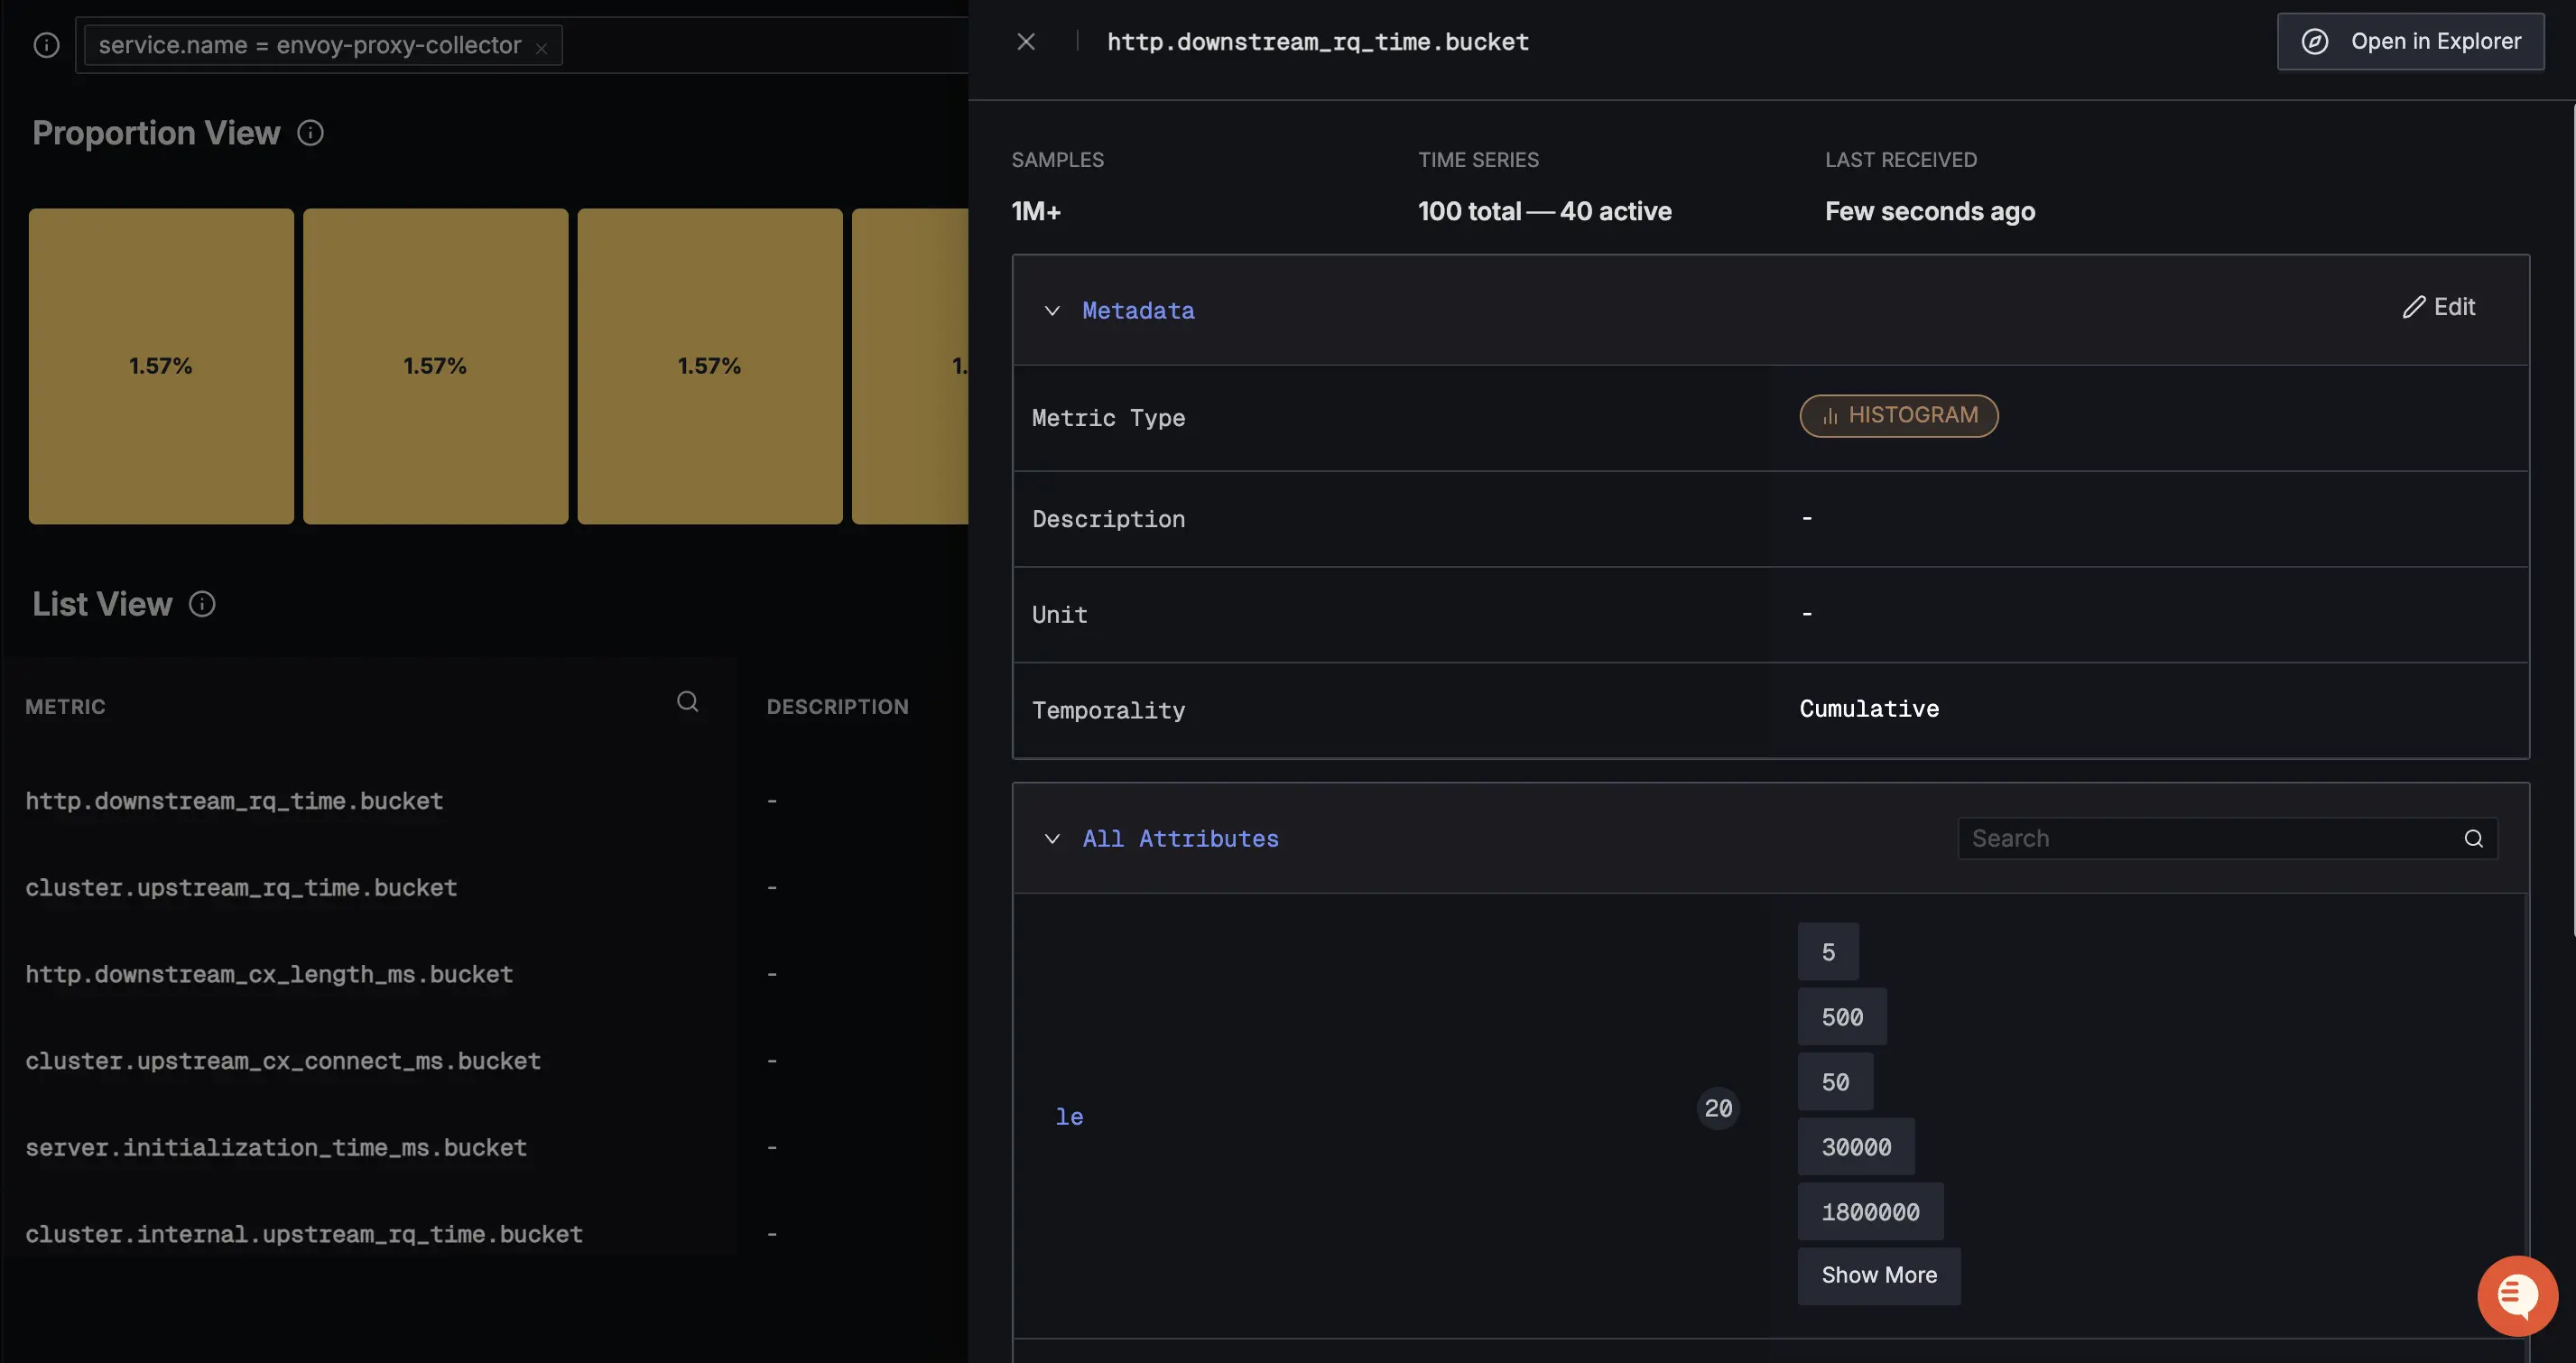
Validate Metrics
After setting up the collector, go to the Metrics Explorer in SigNoz and search for Envoy metrics to confirm data is flowing:
cluster.upstream_rq_per_cxcluster.upstream_cx_connect_mshttp.downstream_rq_timehttp.downstream_cx_length_ms
Next Steps
- Use Pre-built Dashboard: Visualize your Envoy metrics using the Envoy Proxy Dashboard.
- Set Alerts: Configure alerts to get notified when metrics cross a threshold. Learn more.
Troubleshooting
Metrics not appearing in SigNoz
- Check Envoy Logs: Ensure Envoy is starting correctly and not reporting errors related to the
open_telemetrysink. - Verify OTel Collector: Check if the OTel Collector is running and accessible from the Envoy container/pod.
- Check Endpoint: Verify that the
socket_addressin the Envoy config matches the OTel Collector's address and port (default 4317 for gRPC).
Connection Refused Errors
If you see connection refused errors in Envoy logs:
- Ensure the OTel Collector is listening on port 4317.
- If running in Docker, ensure both containers are on the same network.
- If running in Kubernetes, ensure the Service name and namespace are correct.
Get Help
If you need help with the steps in this topic, please reach out to us on SigNoz Community Slack.
If you are a SigNoz Cloud user, please use in product chat support located at the bottom right corner of your SigNoz instance or contact us at cloud-support@signoz.io.
