Google Cloud Monitoring.
Zero switching between GCP Console and your observability stack.
SigNoz Cloud monitors every Google Cloud service - Cloud Run, GKE, Compute Engine, Cloud SQL, Pub/Sub, Cloud Storage, App Engine, Cloud Functions, and more - in a single OTel-native backend.
Correlated metrics, logs, and traces. No per-metric charges. No proprietary agents.
Unify Your Entire Google Cloud Environment
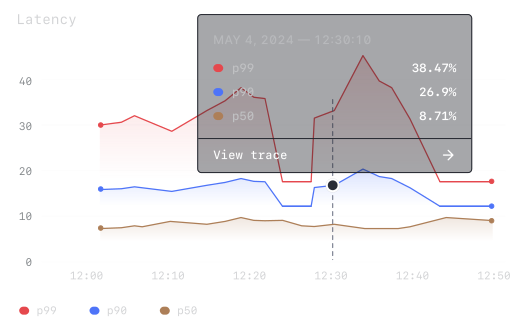
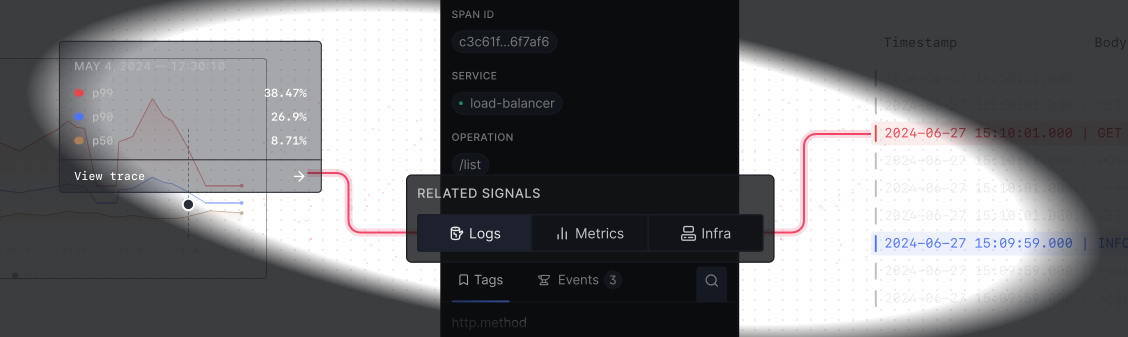
When Cloud Run latency spikes, jump from the GCP infrastructure metric to the application trace to the log line that explains it; without switching to multiple consoles. SigNoz Cloud stores all three signal types in a single ClickHouse backend, so correlation is native, not manual.
Scrape GCP metrics via the OTel Collector with no proprietary exporter
Use the OTel Collector's googlecloudmonitoring receiver to scrape metrics from any GCP service - Cloud SQL, App Engine, BigQuery, Cloud Storage, Pub/Sub - and send them to SigNoz. Select exactly which metrics to collect. No proprietary agents, no vendor lock-in, your config stays yours.
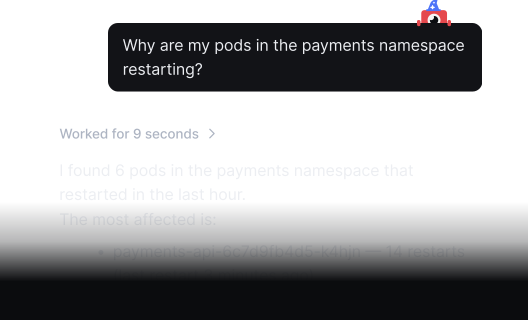
Talk to your GCP infrastructure. In plain English. With Noz AI
SigNoz MCP Server connects to Claude Code, Cursor, and other AI coding agents. Give your agent full GCP context - Cloud Run latency, GKE pod status, Cloud SQL query performance, Pub/Sub backlog - and debug production GCP issues without leaving your terminal.
Resolve Google Cloud Performance Issues Faster
One config. Every GCP service logs automatically. Forever.
Built on OpenTelemetry - Your GCP Instrumentation Stays Yours
APM & Distributed Tracing for Cloud Run
Instrument your Cloud Run service with the OTel SDK. Every request is traced end-to-end: spans, downstream calls, latency per endpoint, errors by service. Correlated with CPU, memory, and instance counts in the same view.


