Overview
This document provides a detailed walkthrough on how to send Google App Engine metrics to SigNoz.
Prerequisites
- A Google Cloud account with administrative privileges or App Engine Admin privileges
- Access to a project in Google Cloud Platform (GCP)
- Cloud Build API is enabled
Setup
Get started with App Engine Configuration
Create the App Engine service using the following steps:
Step 1: Install the Google Cloud CLI.
Step 2: To initialize the gcloud CLI, run the following command:
gcloud initStep 3: Run the following gcloud command to enable App Engine and create the associated application resources. Note that the location you select cannot be changed later.
gcloud app createStep 4: In this example, we will be building the Python 3 application. For this,
- Download the sample application repository using Git:
git clone https://github.com/GoogleCloudPlatform/python-docs-samplesAlternatively, you can download the sample as a zip file and then extract it.
- Navigate to the directory that contains a copy of the files from the previous step:
cd python-docs-samples/appengine/standard_python3/hello_worldNote that we have app.yaml file located in this folder.
- When on this folder which contains
app.yaml, you can deploy your service using the command:
gcloud app deploy- On running the above command, the service will get deployed on the App Engine, and you will get the logs containing the endpoint which can be used to trigger the deployed service (highlighted in red in the screenshot).

Open the URL in the new browser which will invoke the App Engine service.
Deploy OpenTelemetry to scrape the metrics from Google Cloud Monitoring
Step 1: Install and configure OpenTelemetry for scraping the metrics from Google Cloud Monitoring. Follow OpenTelemetry Binary Usage in Virtual Machine guide for detailed instructions.
Step 2: Create config.yaml.
Under the googlecloudmonitoring receiver, you need to specify the metrics that you want to capture in the metrics_list. You can include all the metrics that you would like to capture for App Engine, see the available metrics for App Engine.
Here is the config.yaml file for capturing App Engine metrics:
receivers:
  googlecloudmonitoring:
    collection_interval: 5m # Can be specified in seconds (s), minutes (m), or hours (h)
    project_id: my-project-id
    metrics_list:
      - metric_name: "appengine.googleapis.com/flex/instance/cpu/utilization"
      - metric_name: "appengine.googleapis.com/flex/instance/network/received_bytes_count"
      - metric_name: "appengine.googleapis.com/flex/instance/network/sent_bytes_count"
      - metric_name: "appengine.googleapis.com/flex/instance/nginx/connections/current"
      - metric_name: "appengine.googleapis.com/http/server/response_count"
      - metric_name: "appengine.googleapis.com/http/server/response_latencies"
processors:
  resource/env:
    attributes:
    - key: deployment.environment
      value: prod
      action: upsert
  batch: {}
exporters:
  otlp:
    endpoint: "ingest.{region}.signoz.cloud:443"
    tls:
      insecure: false
    headers:
      "signoz-ingestion-key": "<your-ingestion-key>"
service:
  pipelines:
    metrics:
      receivers: [googlecloudmonitoring]
      processors: [resource/env, batch]
      exporters: [otlp]
Depending on the choice of your region for SigNoz cloud, the otlp endpoint will vary according to this table.
| Region | Endpoint |
|---|---|
| US | ingest.us.signoz.cloud:443 |
| IN | ingest.in.signoz.cloud:443 |
| EU | ingest.eu.signoz.cloud:443 |
After successful configuration start the OTel Collector using following command:
./otelcol-contrib --config ./config.yaml &> otelcol-output.log & echo "$!" > otel-pidStep 3: If the configurations are configured correctly, you can see the output logs from OpenTelemtry as follows:

Send and Visualize the metrics obtained by OpenTelemetry in SigNoz
Step 1: Go to the SigNoz Cloud URL and head over to the dashboard.
Step 2: If not already created, create a new dashboard. You can create the dashboard and multiple panel under it by following the instructions here.
Step 3: While creating the panel, select metric for App Engine.
All metrics starting with appengine_googleapis_com_ have been collected from App Engine.
Here is the sample dashboard for App Engine:

Troubleshooting
If you run into any problems while setting up monitoring for your App Engine's metrics with SigNoz, consider these troubleshooting steps:
- Verify Configuration: Double-check your
config.yamlfile to ensure all settings, including the ingestion key and endpoint, are correct. - Review Logs: Look at the logs of both App Engine and the OpenTelemetry Collector to identify any error messages or warnings that might provide insights into what’s going wrong.
- Update Dependencies: Ensure all relevant packages and dependencies are up-to-date to avoid compatibility issues.
- Consult Documentation: Review the SigNoz and OpenTelemetry documentation for any additional troubleshooting of the common issues.
Prerequisites
- A Google Cloud account with administrative privileges or App Engine Admin privileges
- Access to a project in Google Cloud Platform (GCP)
- Cloud Build API is enabled
Setup
Get started with App Engine Configuration
Create the App Engine service using the following steps:
Step 1: Install the Google Cloud CLI.
Step 2: To initialize the gcloud CLI, run the following command:
gcloud initStep 3: Run the following gcloud command to enable App Engine and create the associated application resources. Note that the location you select cannot be changed later.
gcloud app createStep 4: In this example, we will be building the Python 3 application. For this,
- Download the sample application repository using Git:
git clone https://github.com/GoogleCloudPlatform/python-docs-samplesAlternatively, you can download the sample as a zip file and then extract it.
- Navigate to the directory that contains a copy of the files from the previous step:
cd python-docs-samples/appengine/standard_python3/hello_worldNote that we have app.yaml file located in this folder.
- When on this folder which contains
app.yaml, you can deploy your service using the command:
gcloud app deploy- On running the above command, the service will get deployed on the App Engine, and you will get the logs containing the endpoint which can be used to trigger the deployed service (highlighted in red in the screenshot).
Open the URL in the new browser which will invoke the App Engine service.
Deploying a Self-Hosted SigNoz in a Docker container
Step 1: The deployment process of the Self-Hosted SigNoz can be found in official documentation.
Step 2: Make sure all the containers are running in a Healthy state.
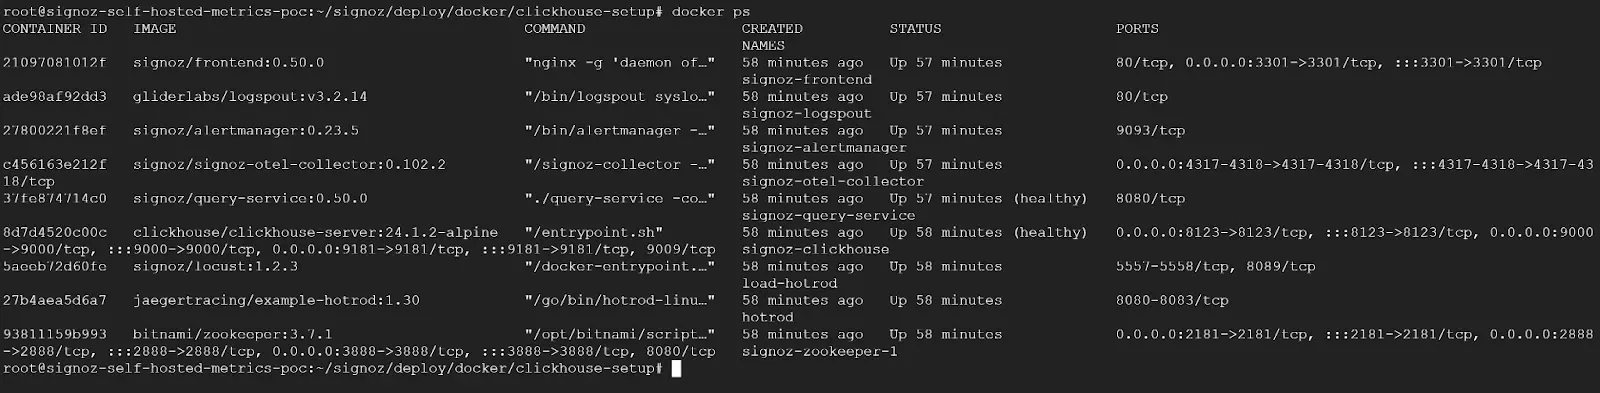
SigNoz Self-Hosted using Docker
The self-hosted SigNoz setup also includes the OTel collector in the bundle. Docker will deploy the OTel collector beside SigNoz as a container. The same OTel collector can be used to directly receive any signals, otherwise, if one more OTel Collector is required for a more granular collection, we can add an additional independent OTel collector, see Using Central OTel collector in between tab.
Apart from using the native OTel collector present in the docker from the previous method, we can also deploy an additional independent OTel collector which can act as an additional collector in this setup for more granular metrics collection.
Step 1: Install and configure OpenTelemetry to scrape the metrics from Google Cloud Monitoring. Add the following code block to the OpenTelemetry configuration file. Under exporters, we should have an exporter pointing to our SigNoz self-host setup. For example, in the below snippet, the endpoint-ip would be the address of the VM in which the SigNoz self-host setup is present.
exporters:
  otlp:
	endpoint: "<endpoint-ip>:4317"
	tls:
  	   insecure: true
  debug:
verbosity: normalStep 2: After successful configuration, start the OTel service.
Configuring config.yaml
Here is the config.yaml file for capturing App Engine metrics:
receivers:
  googlecloudmonitoring:
    collection_interval: 5m # Can be specified in seconds (s), minutes (m), or hours (h)
    project_id: my-project-id
    metrics_list:
      - metric_name: "appengine.googleapis.com/flex/instance/cpu/utilization"
      - metric_name: "appengine.googleapis.com/flex/instance/network/received_bytes_count"
      - metric_name: "appengine.googleapis.com/flex/instance/network/sent_bytes_count"
      - metric_name: "appengine.googleapis.com/flex/instance/nginx/connections/current"
      - metric_name: "appengine.googleapis.com/http/server/response_count"
      - metric_name: "appengine.googleapis.com/http/server/response_latencies"
processors:
  resource/env:
    attributes:
    - key: deployment.environment
      value: prod
      action: upsert
  batch: {}
exporters:
  otlp:
    endpoint: "<IP of machine hosting SigNoz>:4317"
    tls:
      insecure: true
service:
  pipelines:
    metrics:
      receivers: [googlecloudmonitoring]
      processors: [resource/env, batch]
      exporters: [otlp]
You can include all the metrics that you would like to capture for App Engine, see the available metrics for App Engine.
If the configurations are configured correctly, you can see the output logs from OpenTelemtry as follows:
Visualize the metrics in Self-Hosted SigNoz
Step 1: Go to your Self-Hosted SigNoz UI, and navigate to the Self-Hosted SigNoz dashboard. Click on the Dashboards section to view the metrics. Create a new dashboard (If not already present ). The default Self-Hosted SigNoz dashboard endpoint would be http://<Self-Hosted SigNoz-host-ip>:3301, however, the URL can be different based on how you have set up the infrastructure.
Step 2: If not already created, create a new dashboard. You can create the dashboard and multiple panel under it by following the instructions here.
Step 3: While creating the panel, select metric for App Engine.
All metrics starting with appengine_googleapis_com_ have been collected from App Engine.
Here is the sample dashboard for App Engine:
Troubleshooting
If you run into any problems while setting up monitoring for your App Engine's metrics with SigNoz, consider these troubleshooting steps:
- Verify Configuration: Double-check your
config.yamlfile to ensure all settings, including the ingestion key and endpoint, are correct. - Verify Docker container logs: Check if all the containers are running properly, and not unexpectedly crashed.
- Review Logs: Look at the logs of both App Engine and the OpenTelemetry Collector to identify any error messages or warnings that might provide insights into what’s going wrong.
- Update Dependencies: Ensure all relevant packages and dependencies are up-to-date to avoid compatibility issues.
- Consult Documentation: Review the SigNoz and OpenTelemetry documentation for any additional troubleshooting of the common issues.


