API Observability - Enhancing Monitoring and Performance
In today's API-driven world, understanding the behavior and performance of your APIs is crucial. Traditional monitoring methods often fall short in providing the deep insights needed to manage complex, distributed systems effectively. This is where API observability comes in. But what exactly is API observability, and how does it differ from conventional monitoring approaches?
What is API Observability?
API observability refers to the comprehensive ability to understand and analyze an API system's internal states and behaviors based on the data it generates. It originates from control systems theory and extends beyond simple monitoring to provide in-depth insights into API behavior, performance, and user interactions.
Unlike traditional monitoring, which focuses on predefined metrics and thresholds, API observability allows you to ask new questions about your system's behavior without deploying new code or instrumentation. It relies on four key pillars:
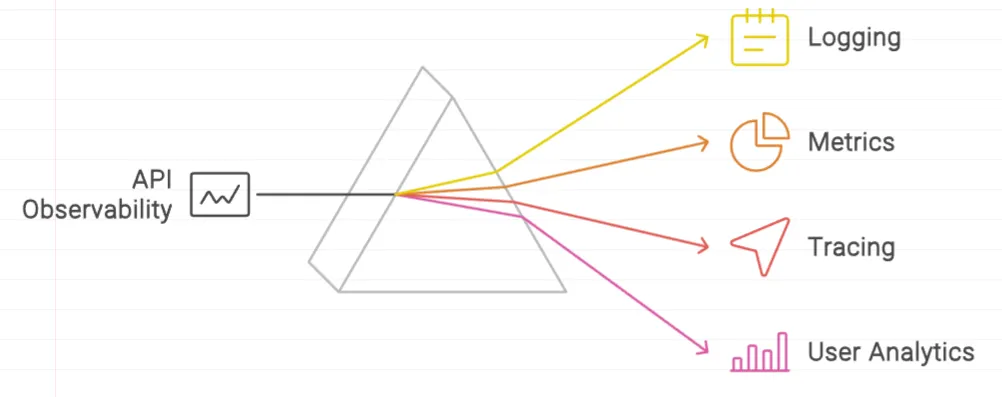
- Logs: Detailed records of events and actions within the system
Example:
2023-10-01 12:00:00 INFO User 'john_doe' logged in from IP 192.168.1.1
2023-10-01 12:05:23 ERROR Database connection timeout after 30 seconds
2023-10-01 12:10:45 WARN Disk space running low on server 'web01'
- Metrics: Quantitative measurements of system performance and behavior
Example:
CPU Usage: 75%
Memory Usage: 65%
Request Rate: 120 requests per second
Error Rate: 2 errors per minute
- Traces: End-to-end tracking of requests as they flow through the system
Example:
Trace ID: 12345
Start Time: 2023-10-01 12:00:00
Duration: 150ms
Span 1: Service A -> Service B (50ms)
Span 2: Service B -> Service C (70ms)
Span 3: Service C -> Service D (30ms)
- User Analytics: Insights into how users interact with your APIs
Example:
Total API Calls: 10,000 per day
Most Popular Endpoint: /api/v1/products with 4,000 calls per day
Average Response Time: 200ms
User Demographics: 60% from North America, 25% from Europe, 15% from Asia
API observability is critical in modern, API-driven applications where complexity and scale make traditional monitoring insufficient.
Why API Observability Matters in an API-First World
The rise of microservices and distributed systems has increased application complexity, leading to challenges such as:
- Debugging Across Services: Identifying issues across interconnected services can be tricky. For example, if a payment gateway intermittently fails, pinpointing whether the issue lies with the API, database, or external services is challenging.
- Maintaining Performance and Reliability: Ensuring consistent performance as the application scales is crucial. For instance, if a user authentication API starts experiencing latency, it can affect the overall user experience.
- Ensuring Security and Compliance: Monitoring for security threats across a complex API ecosystem is essential. For example, unusual access patterns or anomalies in API usage might signal a potential security breach.
API observability addresses these challenges by enabling:
- Rapid Issue Resolution: Quickly identify and fix problems, such as tracing a spike in error rates to a specific service.
- Proactive Performance Optimization: Optimize performance by monitoring real-time data and addressing potential bottlenecks.
- Enhanced Security Monitoring: Detect and respond to threats with greater visibility into API interactions.
Overall, API observability supports faster development, reliable operations, and robust security, making it essential in a complex, API-driven world.
Key Components of API Observability
Structured Logs
Structured logging involves capturing logs in a predefined format or schema, often in JSON or key-value pairs. This structured format allows logs to be easily parsed and queried, rather than being free-form text.
For example, instead of a log entry like "Error occurred in API", a structured log might look like this:
{
  "timestamp": "2024-08-09T10:00:00Z",
  "level": "ERROR",
  "message": "API request failed",
  "endpoint": "/api/v1/resource",
  "userId": "12345"
}
Why It Matters?
Structured logs play a crucial role in observability by providing a clear and consistent format for tracking API requests, errors, and performance metrics. The following are the major benefits:
- Consistency: Every log entry follows the same format, making it easier to aggregate and analyze logs from various sources.
- Searchability: Fields like
level,endpoint, anduserIdcan be used to filter and search logs effectively. - Automation: Structured logs can be processed by automated tools for monitoring and alerting.
To implement structured logging in your APIs:
- Use a logging framework that supports structured output (e.g., JSON)
- Include relevant context with each log entry (e.g., request ID, user ID, timestamp)
- Standardize log formats across all services
Metrics
API metrics are quantitative measurements that track various aspects of API performance and usage. They play a crucial role in observability by providing insights into how well your API is functioning and where issues may arise. Metrics help you monitor things like response times, error rates, and request volumes, offering a clear view of your API’s health and efficiency.
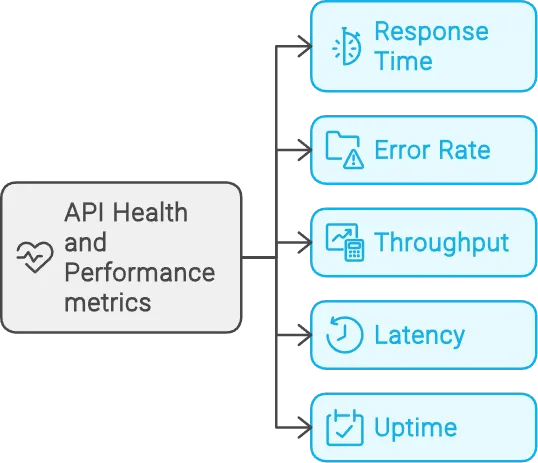
Key metrics associated with API Health and Performance include:
- Response Time: Measures how long it takes for an API to respond to a request. Shorter times indicate better performance.
- Error Rate: The percentage of API requests that result in errors. A higher error rate can signal issues with the API or underlying services.
- Throughput: The number of requests handled by the API over a given period. Higher throughput indicates the API’s ability to handle traffic.
- Latency: The time taken for a request to travel from the client to the server and back. Lower latency means faster communication.
- Uptime: The percentage of time the API is available and operational. High uptime is essential for reliability.
To collect and analyze API metrics:
- Use a metrics collection agent (e.g., Prometheus, StatsD)
- Define custom metrics for business-specific KPIs
- Set up dashboards for real-time monitoring
- Implement alerting for anomalies or threshold breaches
Metrics are essential for capacity planning and performance optimization. They help you identify trends and potential issues before they impact users.
Distributed Tracing
In a microservices architecture, a single API request might pass through multiple services before completion. Distributed tracing tags and tracks each step of the request, creating a trace that shows the entire journey from start to finish.
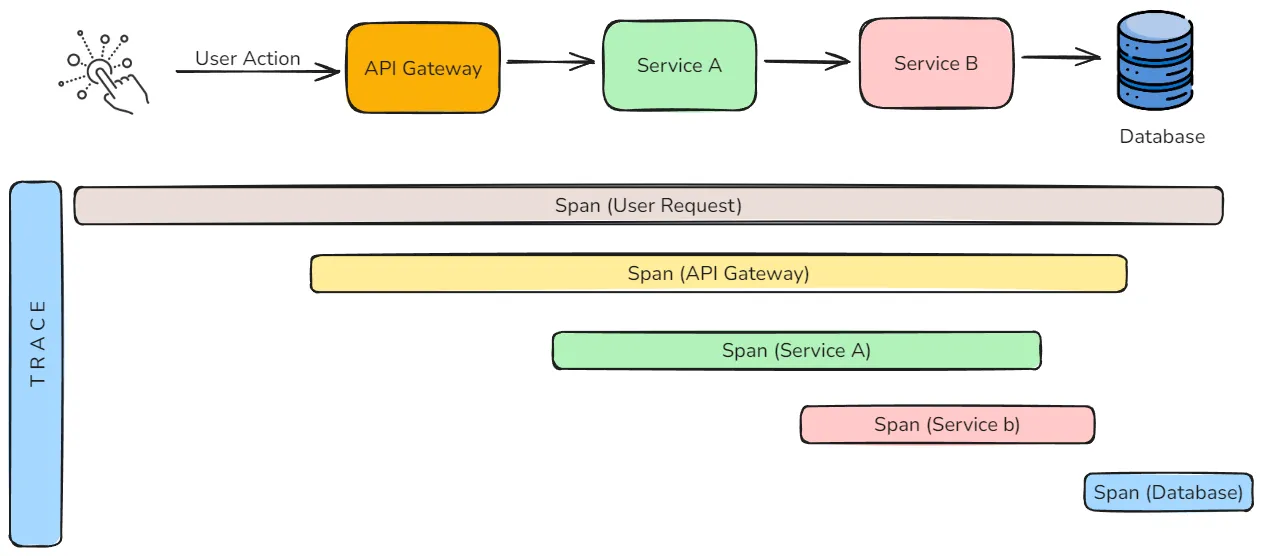
This visibility is crucial for understanding how services interact, identifying bottlenecks, and diagnosing issues. For example, if a request takes too long, tracing can reveal which service caused the delay and why.
To implement distributed tracing:
- Instrument your code with a tracing library (e.g., OpenTelemetry)
- Propagate trace context between services
- Collect and store trace data in a centralized system
- Analyze traces to identify slow components or error-prone paths
Tracing helps you understand the full context of each request, making it easier to diagnose issues and optimize performance across your entire API ecosystem.
User Analytics
User analytics focuses on understanding how your APIs are being used. User behavior analytics provides insights into how users interact with your API, revealing patterns that can inform decisions on performance, usability, and feature development. This includes:
- Popular endpoints and features
- User behavior patterns
- Error rates and types from the user perspective
- API response times as experienced by users
Analytics data can guide API design decisions by highlighting areas where users struggle or drop off. For example, if users frequently encounter errors at a specific endpoint, it may indicate a need for better documentation or a redesign of that part of the API.
To implement user analytics:
- Instrument your client-side code to capture user interactions
- Use API gateways to collect usage data
- Implement user identification and session tracking
- Analyze data to improve API design and user experience
While user analytics provide valuable insights, balancing this with privacy concerns is crucial. Always be transparent about data collection and comply with relevant regulations.
API Observability Tools
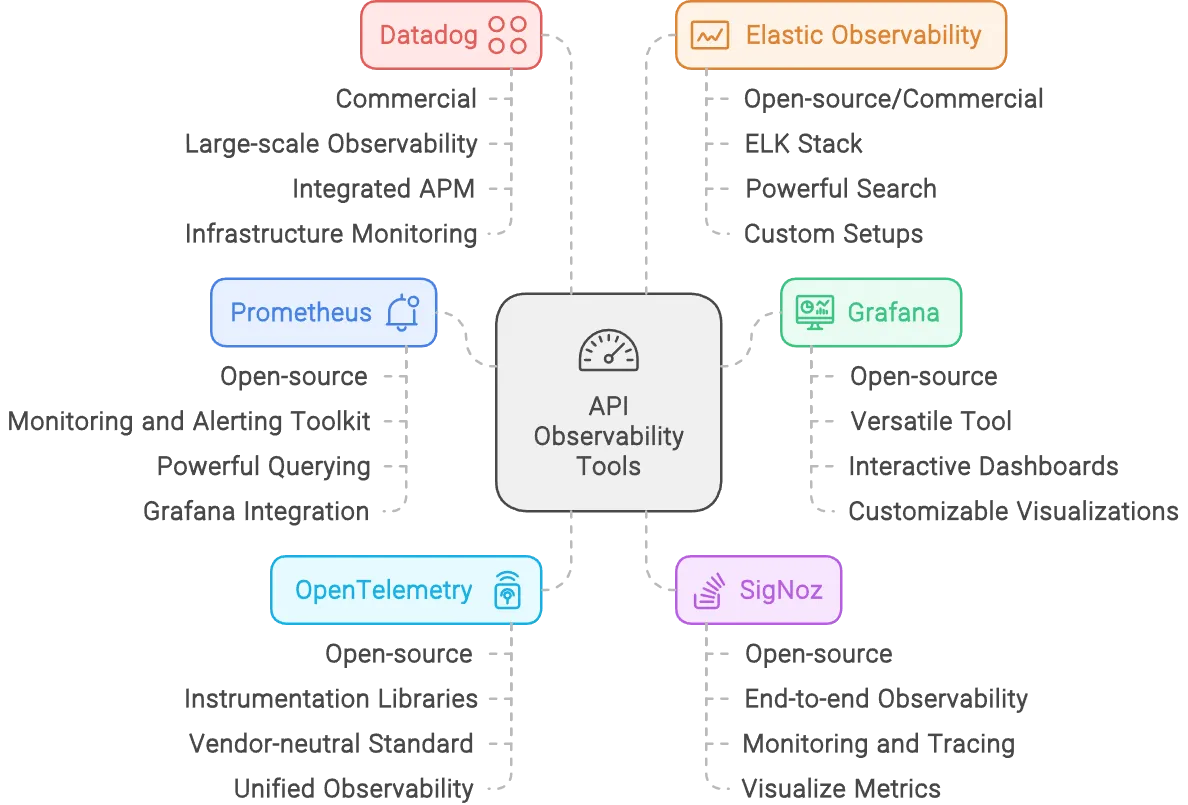
Here’s a list of popular API observability tools, both open-source and commercial, that can help you monitor, trace, and analyze the performance and health of your APIs:
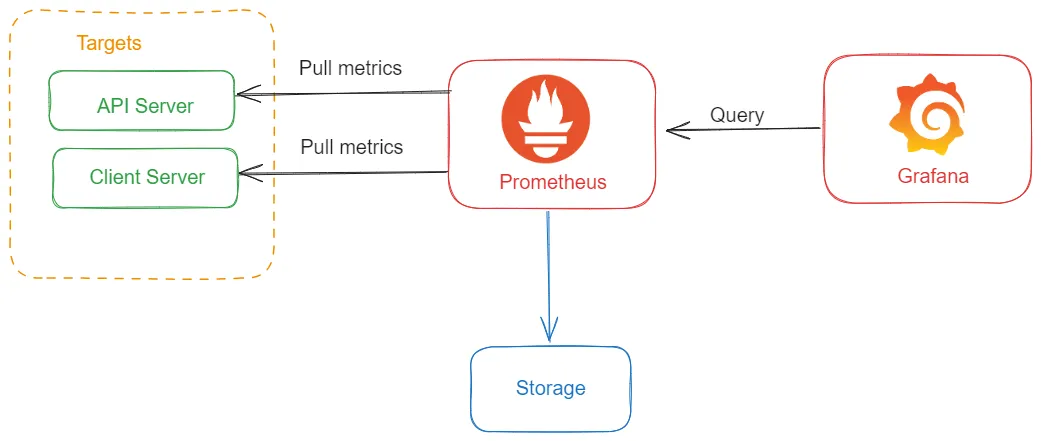
- Prometheus
- Type: Open-source
- Overview: Prometheus is a widely used monitoring and alerting toolkit that collects and stores metrics from various sources, including APIs. It provides powerful querying capabilities and integrates seamlessly with Grafana for visualization.
- Best For: Metric collection, alerting, and monitoring time-series data.
- Grafana
- Type: Open-source
- Overview: Grafana is a versatile data visualization tool that works with various data sources, including Prometheus. It allows you to create interactive and customizable dashboards for monitoring API performance metrics and logs.
- Best For: Visualizing metrics, logs, and traces; creating interactive dashboards.
- OpenTelemetry
- Type: Open-source
- Overview: OpenTelemetry provides libraries and tools to instrument, collect, and export telemetry data (metrics, logs, traces) from your APIs. It’s a vendor-neutral standard, making it easy to integrate with various observability backends.
- Best For: Distributed tracing, metric collection, and unified observability across different platforms.
- SigNoz
- Type: Open-source
- Overview: SigNoz is a full-stack observability platform with monitoring, logging, and tracing capabilities. It allows you to monitor API performance, trace distributed requests, and visualize metrics all in one place.
- Best For: End-to-end observability with an open-source solution.
- Datadog
- Type: Commercial
- Overview: Datadog is a comprehensive monitoring and analytics platform for cloud applications. It offers features like metric collection, log management, distributed tracing, and APM (Application Performance Monitoring).
- Best For: Large-scale API observability with integrated APM and infrastructure monitoring.
- Elastic Observability (ELK Stack)
- Type: Open-source/Commercial
- Overview: Elastic Observability, part of the ELK Stack (Elasticsearch, Logstash, Kibana), is a solution for monitoring, logging, and tracing. It provides powerful search and analysis capabilities for your API logs and metrics.
- Best For: Log analysis, centralized monitoring, and custom observability setups.
How to Implement API Observability
Implementing API observability involves setting up a comprehensive system that collects, monitors, and analyzes various telemetry data (metrics, logs, and traces) to gain insights into the performance and health of your APIs.
Implementing API observability requires a strategic approach:
- Assess your current monitoring practices
- Identify gaps in visibility and areas for improvement
- Select appropriate tools and platforms
- Integrate observability into your development lifecycle
- Establish data collection, storage, and analysis processes
- Train your team on observability practices and tools
Best practices for implementation include:
- Start small and scale gradually
- Focus on high-impact areas first
- Automate data collection and analysis where possible
- Regularly review and refine your observability strategy
For a detailed guide: Read our documentation on API Monitoring in SigNoz.
Remember, observability is not just about tools—it's a cultural shift. Encourage a mindset of curiosity and continuous improvement across your development teams.
Enhancing API Performance with Observability
API observability provides the insights needed to optimize performance effectively:
- Identify bottlenecks: Use tracing to pinpoint slow components or inefficient code paths.
- Optimize resource usage: Analyze metrics to right-size your infrastructure and improve efficiency.
- Improve error handling: Use logs and traces to understand and reduce error rates.
- Implement proactive monitoring: Set up alerts for performance anomalies before they impact users.
By continuously analyzing observability data, you can drive ongoing performance improvements and ensure your APIs meet user expectations.
API Observability vs. API Monitoring: Understanding the Differences
API observability and API monitoring are often used interchangeably, but they represent different approaches to understanding and maintaining the health of your APIs. While monitoring focuses on tracking predefined metrics and alerting on specific conditions, observability offers a broader, more comprehensive view, enabling you to understand the inner workings of your system and diagnose issues more effectively.
Here are the key differences between the two:
| Aspect | API Monitoring | API Observability |
|---|---|---|
| Scope | Focused on predefined metrics and alerts | Holistic view including logs, metrics, and traces |
| Data Collection | Limited to specific performance metrics | Comprehensive, including contextual data |
| Complexity | Relatively simple to implement - Provides a high-level view | More complex, requires advanced tools and expertise- Offers deep, granular insights |
| Problem Detection | Reactive: alerts on predefined conditions | Proactive: provides context to understand and resolve issues |
| Use Cases | Ensuring API is up and meeting SLAs | Troubleshooting complex issues, improving performance, and optimizing resources |
Example: Highlighting the difference between API Monitoring and API Observability using E-Commerce API
API Monitoring:
- Scenario: You receive an alert that the “search products” endpoint’s response time has exceeded 500 milliseconds.
- What It Shows: The alert indicates a performance issue but doesn’t explain why the delay occurred.
API Observability:
- Scenario: Distributed tracing reveals that the “search products” request is slowed down by a specific database query.
- What It Shows: Observability tools identify that a missing database index is causing the delay, allowing you to fix the issue effectively.
In practice, monitoring and observability complement each other. Monitoring helps you track known indicators of health and performance, while observability allows you to dig deeper when issues arise or new questions need answering.
Overcoming Challenges in API Observability
Implementing API observability comes with its own set of challenges:
- Data volume: Observability generates large amounts of data. Implement efficient storage and retention policies.
- Data privacy: Ensure compliance with data protection regulations when collecting and analyzing observability data.
- Tool complexity: Choose tools that balance functionality with ease of use to avoid overwhelming your team.
- Skills gap: Invest in training to ensure your team can effectively use observability tools and interpret the data.
Address these challenges proactively to maximize the benefits of your observability implementation.
Future Trends in API Observability
The field of API observability is rapidly evolving. Key trends to watch include:
- AI-powered anomaly detection and root cause analysis
- Predictive analytics for proactive performance optimization
- Integration of observability with API governance and security frameworks
- Enhanced visualization techniques for complex system interactions
As APIs continue to play a central role in digital transformation, observability will become increasingly crucial for maintaining performance, reliability, and security.
Implementing API Observability with SigNoz
SigNoz is an open-source observability platform designed to help you monitor and troubleshoot your APIs. It provides comprehensive tools for collecting and analyzing metrics, logs, and traces, making it easier to maintain the health and performance of your APIs. With its user-friendly interface and robust features, SigNoz enables you to gain deep insights into your application's behavior. It incorporates the key pillars of API observability:
Logs:
- Feature: SigNoz aggregates and manages logs from your API, providing a centralized view for log analysis.
- Benefit: Helps you search, filter, and troubleshoot issues by analyzing detailed log data. Logs provide context for understanding events and errors occurring within your API.4
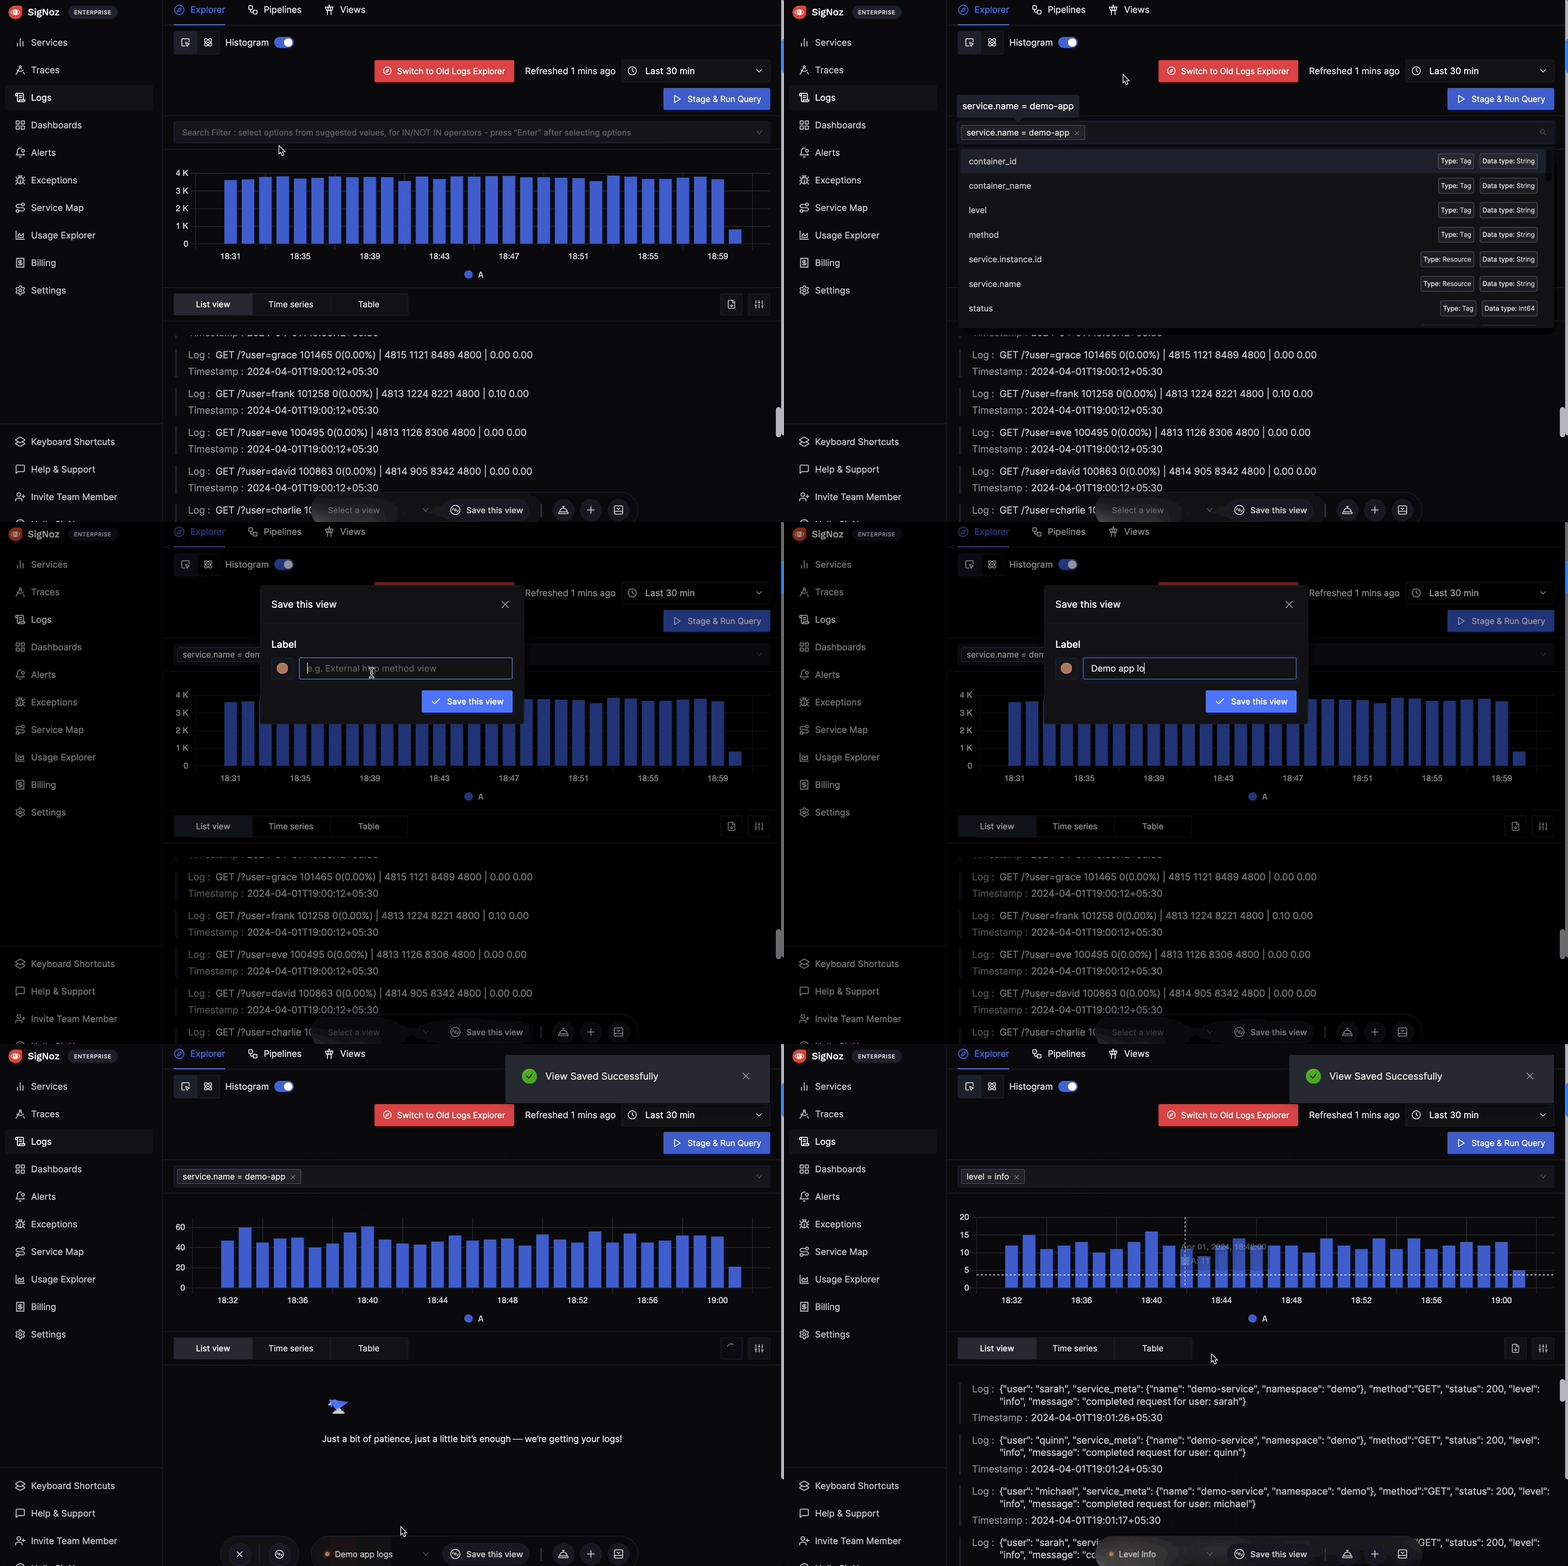
Logs searching and filtering in SigNoz Metrics:
- Feature: SigNoz collects and visualizes performance metrics such as response times, error rates, and throughput.
- Benefit: Enables real-time monitoring of API performance, helping you track key indicators and detect anomalies or performance degradation.
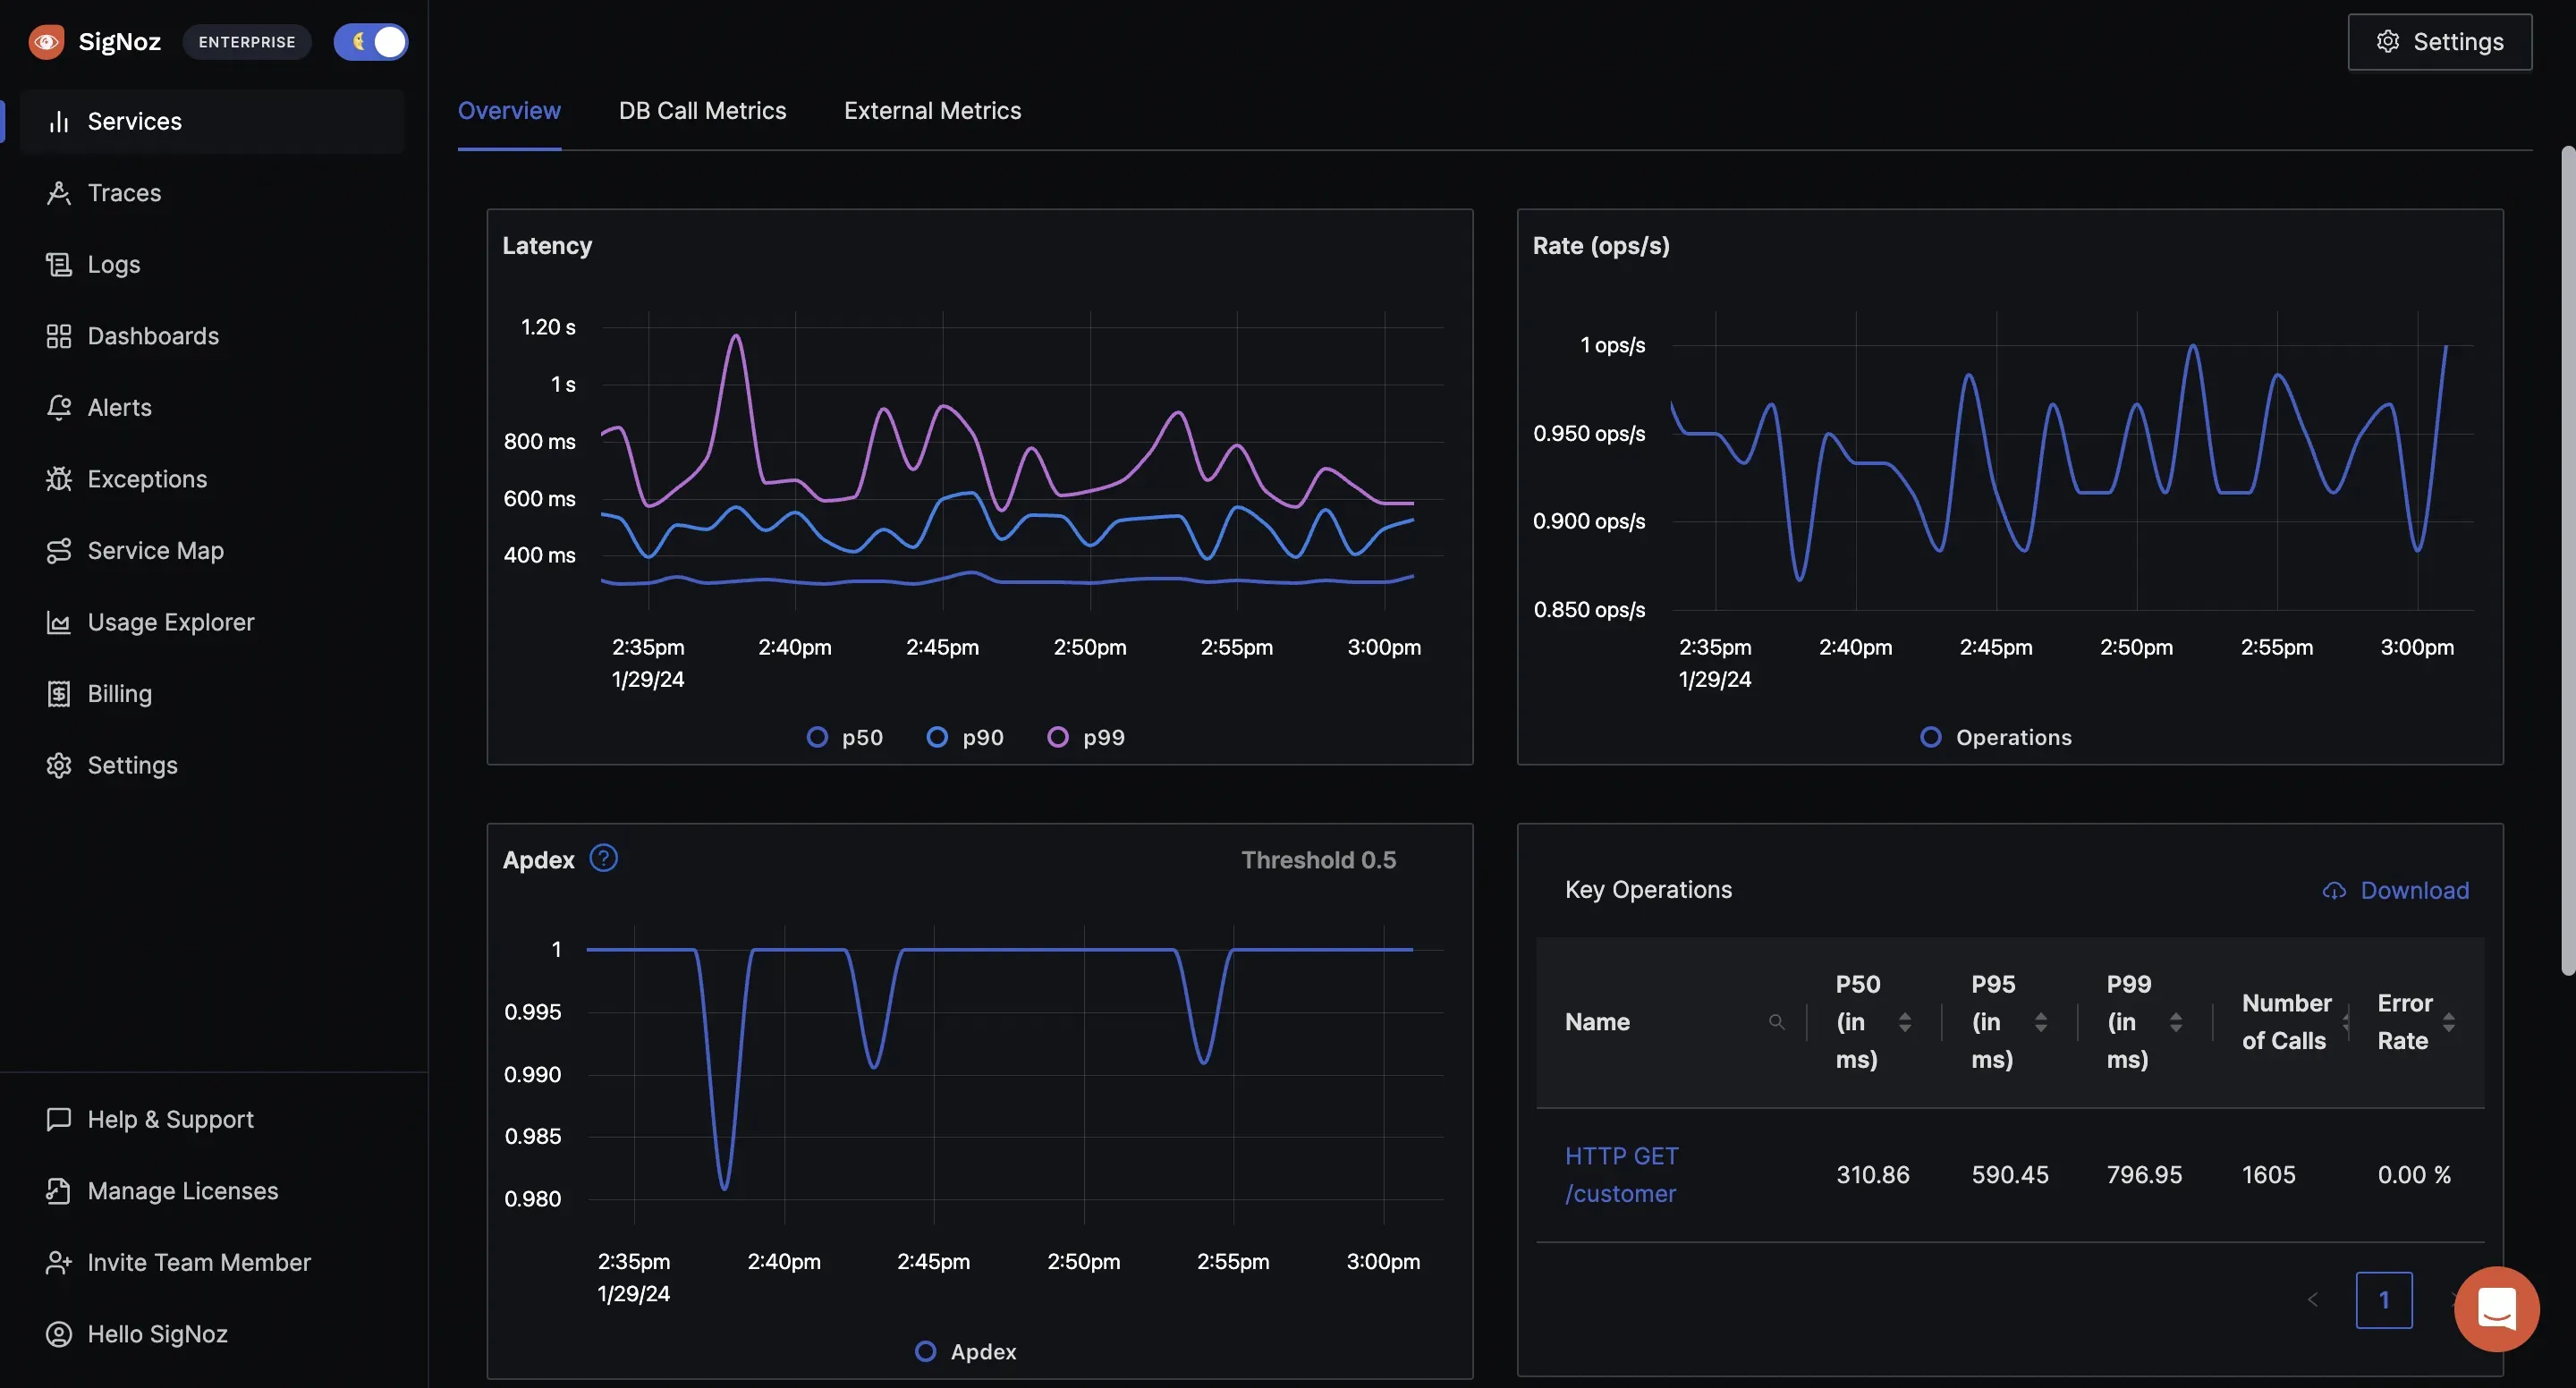
Real-time monitoring of API performance using Metrics in SigNoz Traces:
- Feature: SigNoz supports distributed tracing, allowing you to track the flow of requests through different microservices.
- Benefit: Provides end-to-end visibility into request processing, helping you identify bottlenecks, latency issues, and the interactions between various components.
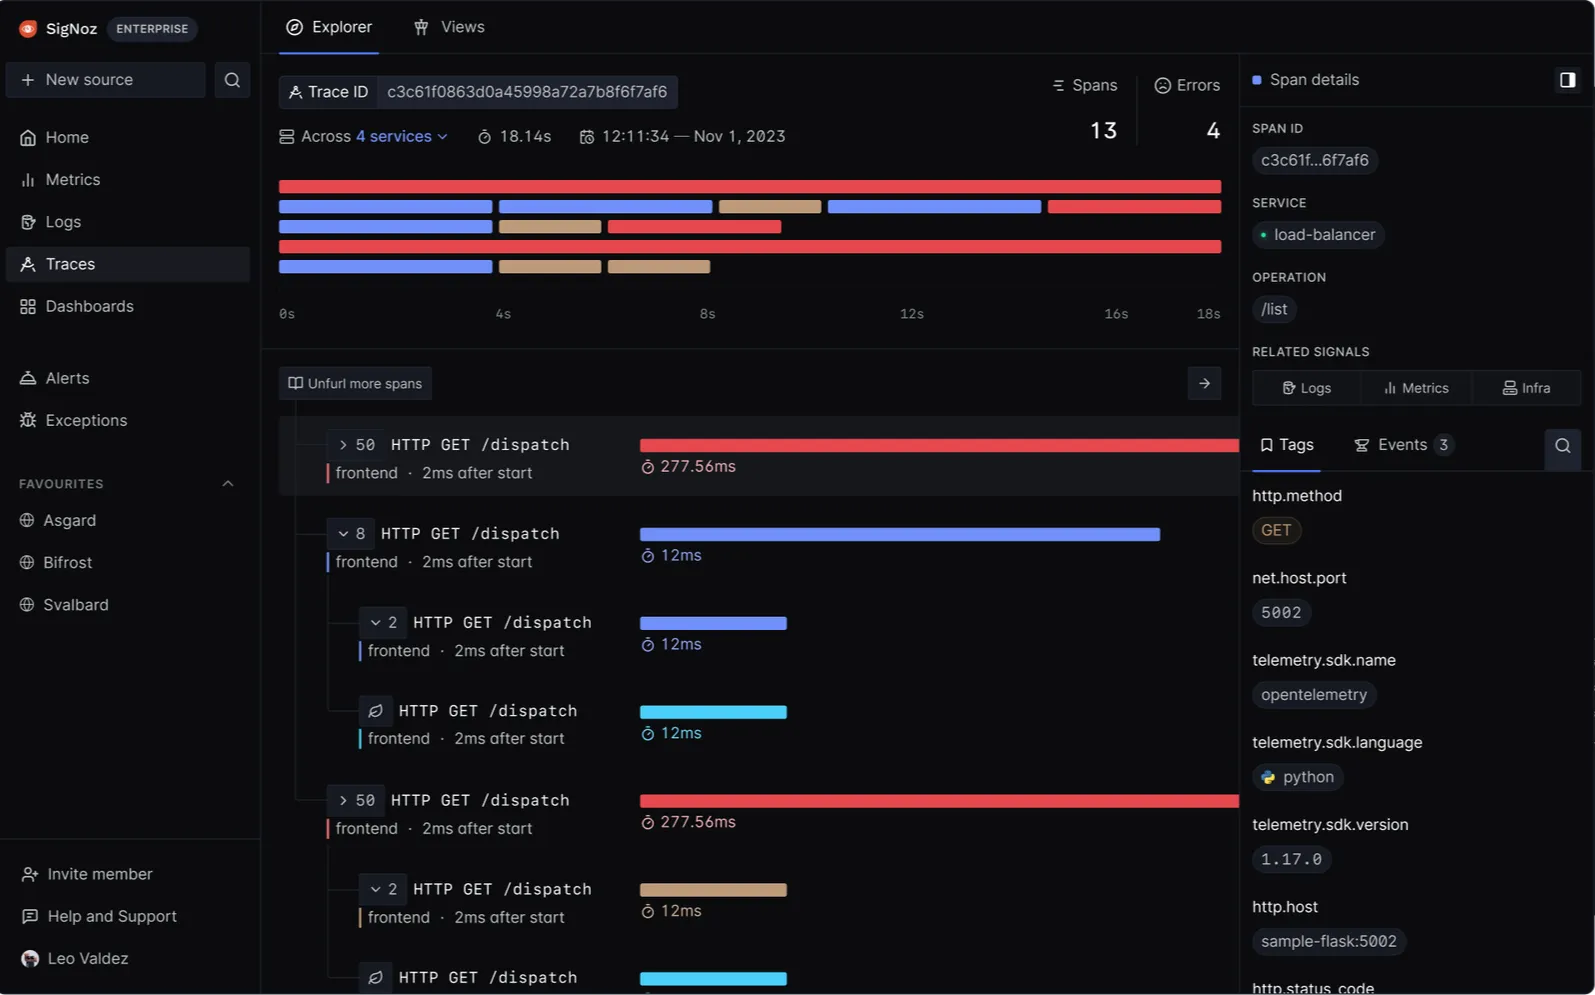
End to end request tracing using SigNoz User Analytics:
- Feature: SigNoz provides tools for tracking API usage patterns and user journeys.
- Benefit: Allows you to understand how users interact with your API, identify common usage patterns, and make data-driven decisions to improve API design and user experience.
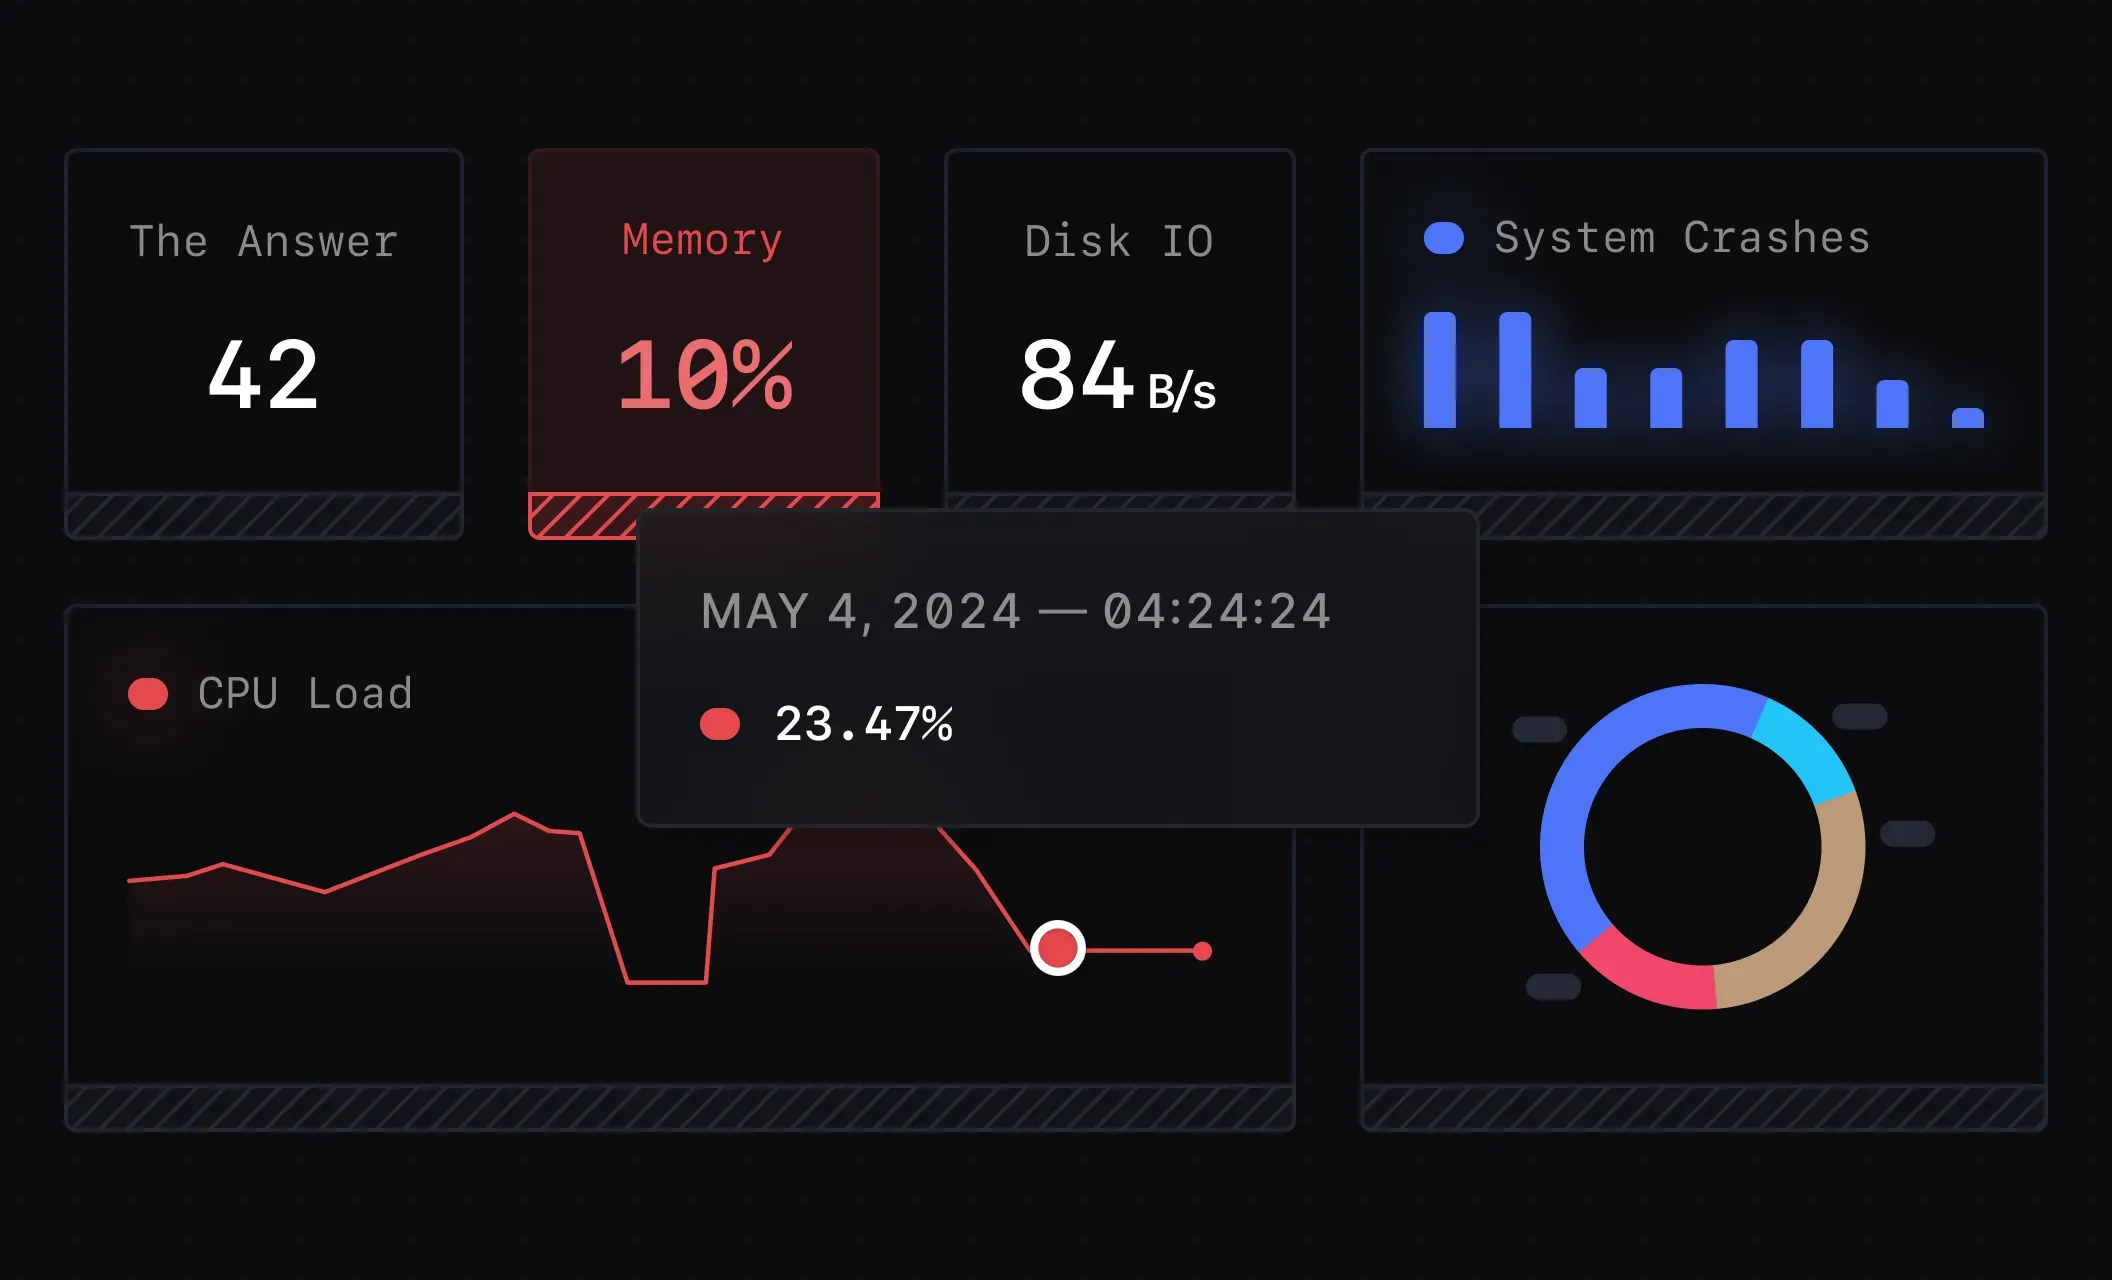
SigNoz Dashboards for Analysis
To get started with SigNoz:
Install SigNoz:
SigNoz Cloud is the easiest way to run SigNoz. Sign up for a free account and get 30 days of unlimited access to all features.

You can also install and self-host SigNoz yourself since it is open-source. With 24,000+ GitHub stars, open-source SigNoz is loved by developers. Find the instructions to self-host SigNoz.
Integrate OpenTelemetry:
- Instrument your API with OpenTelemetry libraries. Configure the OpenTelemetry Collector to export data to SigNoz. Follow the OpenTelemetry documentation for integration details.
Configure Dashboards and Alerts:
- Create and customize dashboards in SigNoz to visualize logs, metrics, and traces.
- Set up alerts for key performance indicators to monitor and respond to issues effectively.
By following these steps, you’ll have SigNoz up and running to start monitoring and optimizing your API.
SigNoz offers cloud and self-hosted options, allowing you to choose the deployment model that best fits your needs. By leveraging SigNoz, you can effectively monitor and optimize your API using its powerful observability tools, whether you choose the convenience of the cloud version or the flexibility of the open-source option.
Key Takeaways
- API observability provides deep insights into API behavior, performance, and user interactions
- It encompasses logs, metrics, traces, and user analytics
- Observability is crucial for managing complex, distributed API ecosystems
- Implementing observability requires both tools and cultural change
- Continuous analysis of observability data drives performance improvements and innovation
FAQs
What's the difference between API monitoring and API observability?
API monitoring focuses on tracking the performance and availability of APIs, ensuring they are functioning as expected. API observability goes deeper by providing insights into the internal workings of APIs, allowing for understanding why an issue occurred and how to fix it, through real-time data, tracing, and logs.
How does API observability improve application performance?
API observability enhances application performance by providing insights into API behavior, enabling quick identification of bottlenecks and inefficiencies. This results in faster troubleshooting, optimized performance, and improved user experience.
What tools are essential for implementing API observability?
Essential tools for implementing API observability include:
- Distributed tracing systems (e.g., Jaeger, Zipkin)
- Metrics collection and visualization platforms (e.g., Prometheus, Grafana)
- Log aggregation and analysis tools (e.g., ELK stack)
- Application Performance Monitoring (APM) solutions
- User analytics platforms
Can API observability help in securing APIs?
Yes, API observability can enhance API security by providing visibility into unusual access patterns, potential security breaches, and compliance issues. It helps detect and respond to security threats more quickly and effectively.
Resources
- Distributed Tracing in Java application using SigNoz
- API Monitoring in SigNoz
- Implementing observability in microservices using SigNoz
