How to embed Grafana dashboards into web applications
Embedding Grafana dashboards into web applications is a powerful way to deliver real-time data visualization to users without requiring them to log into Grafana itself. Whether you are looking to share key metrics with your team or provide external stakeholders with crucial insights, embedding a dashboard ensures seamless integration with your existing web application. This guide will walk you through the process of embedding Grafana dashboards, covering various methods, security considerations, and best practices.
Understanding Grafana Dashboard Embedding
Grafana dashboards are web-based interfaces that display data from various sources in a visually appealing and interactive format. They're essential for monitoring system performance, analyzing trends, and making data-driven decisions.
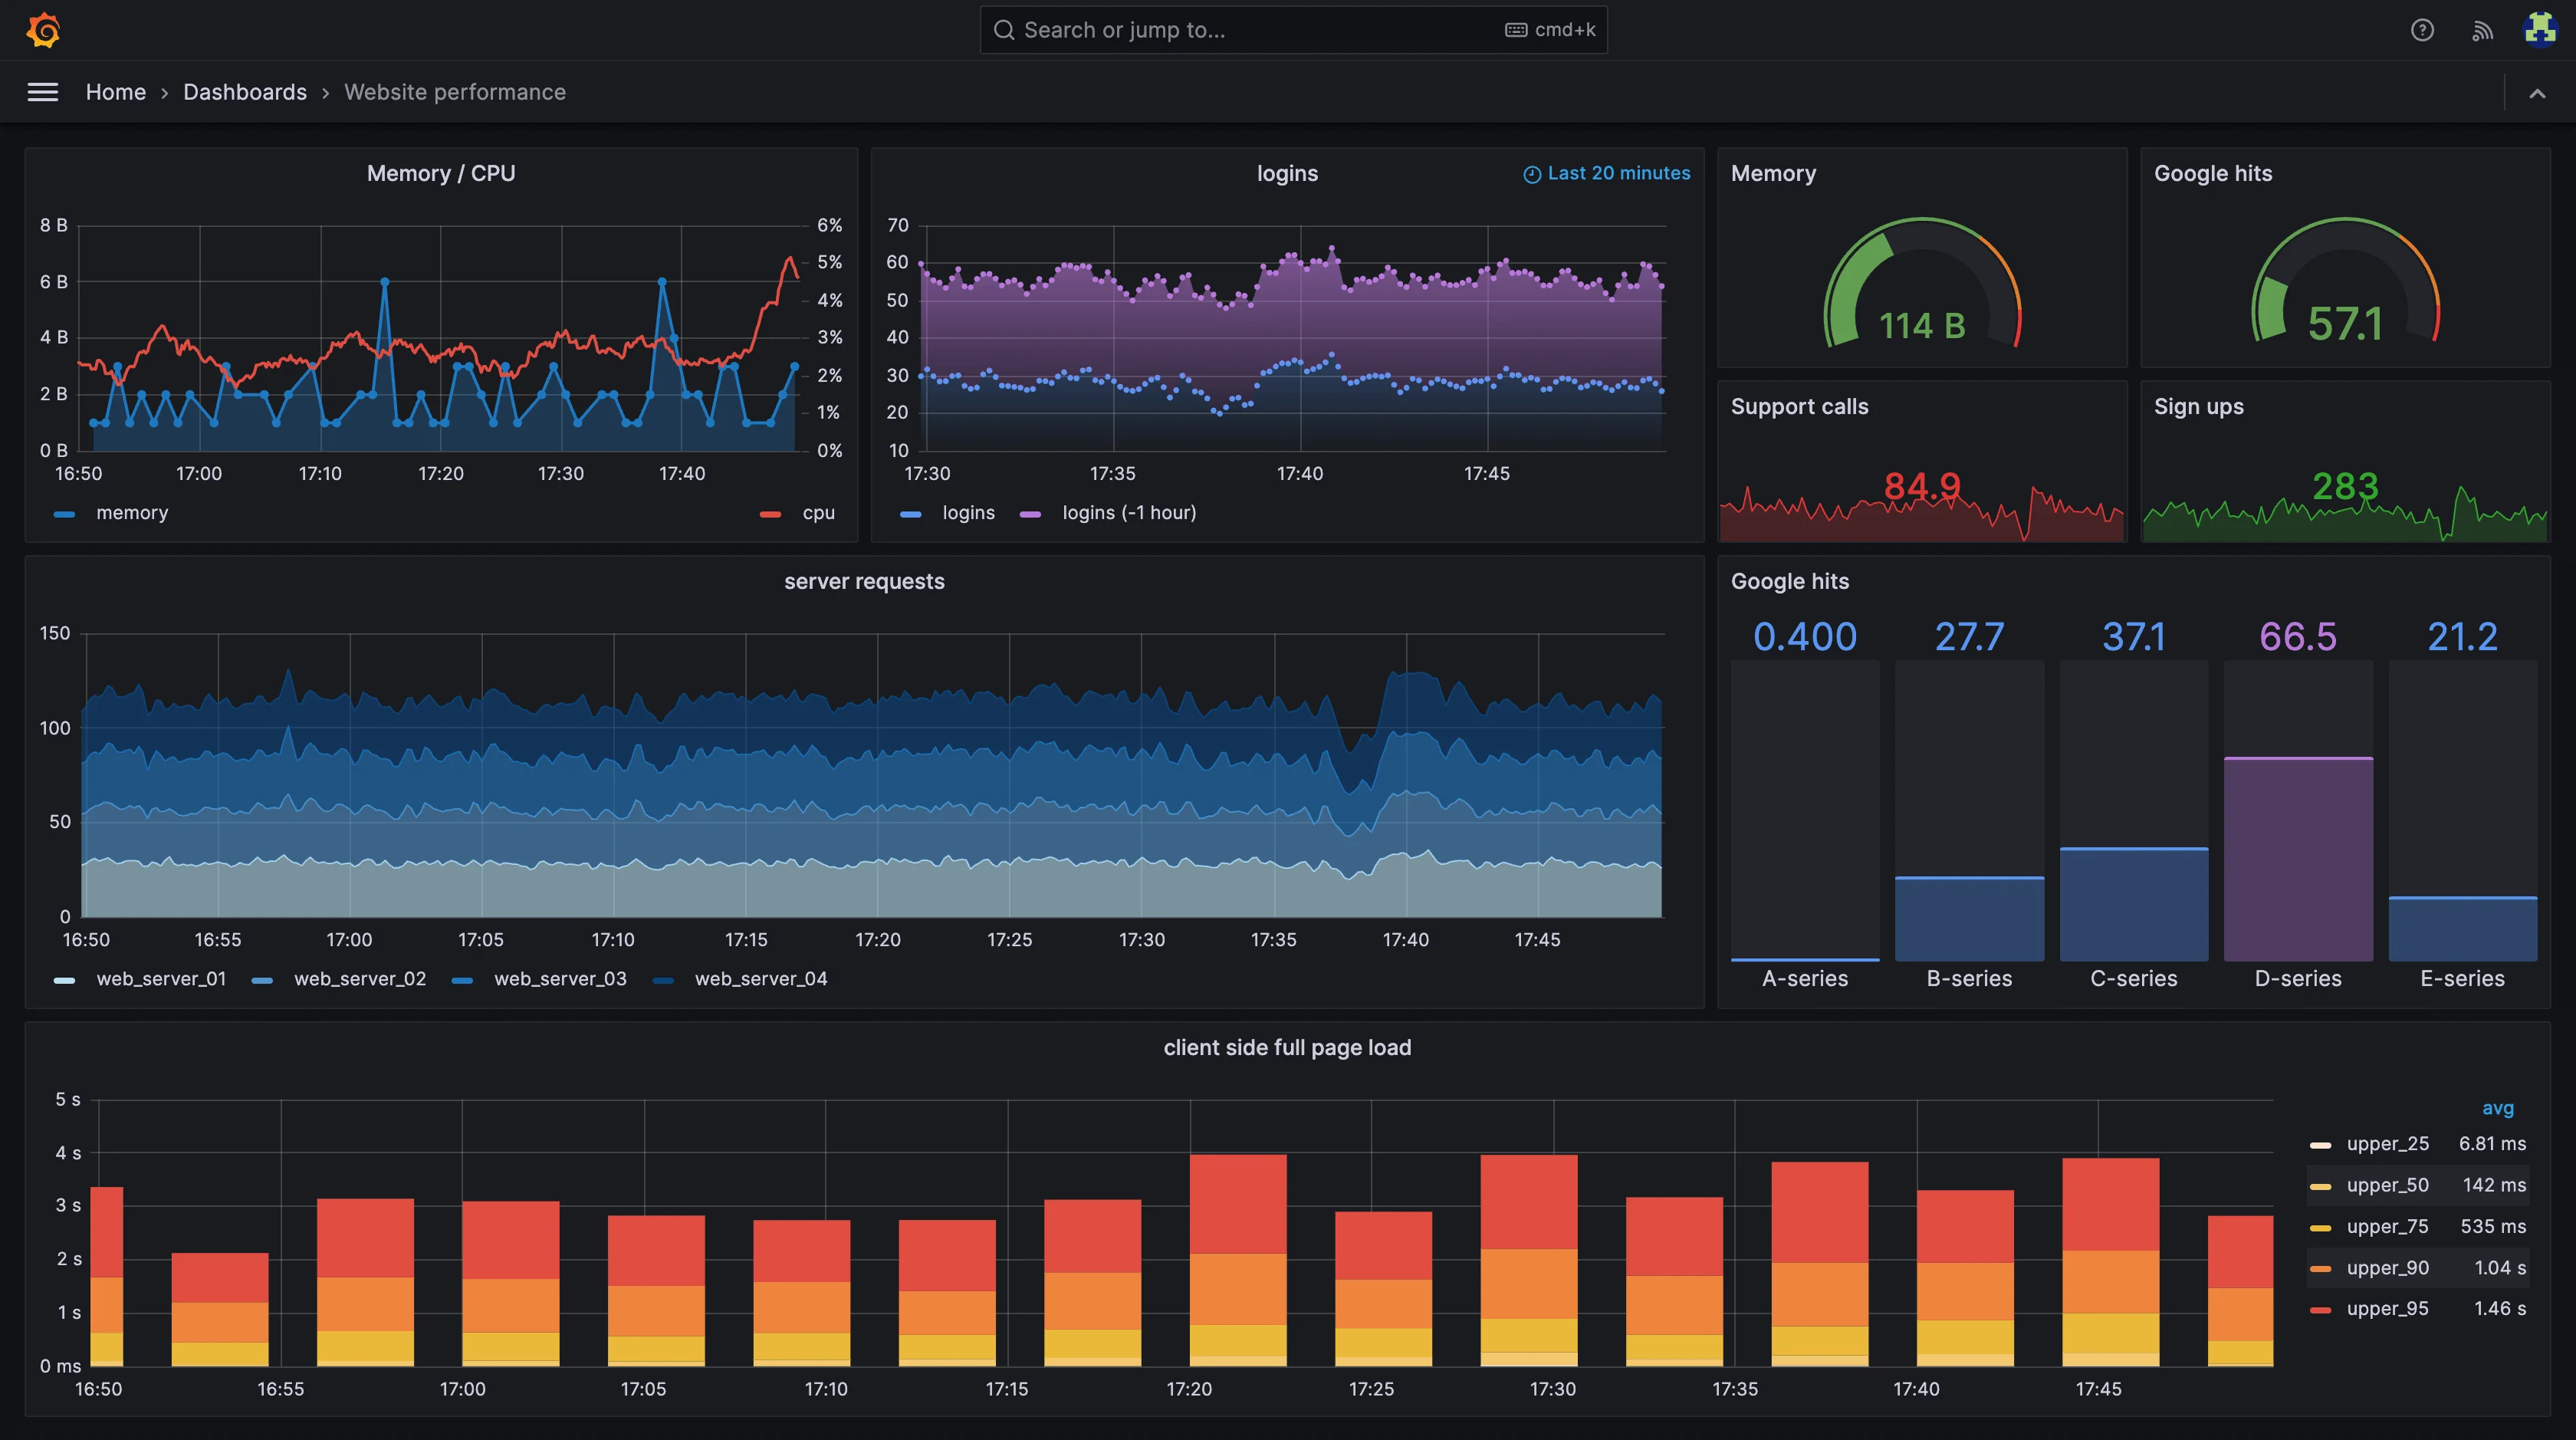
Embedding these dashboards into your web applications allows you to:
- Provide real-time data insights within your application's context
- Enhance user experience by eliminating the need to switch between platforms
- Customize the look and feel of dashboards to match your application's design
Use Cases for Embedding Grafana Dashboards
Embedding Grafana dashboards enables seamless integration of data visualization into various platforms, enhancing accessibility and user experience.
- Internal Monitoring: Embed dashboards in internal portals to allow teams quick access to performance metrics like server health or application uptime, improving operational efficiency by reducing the need to switch between tools.
- Customer-Facing Dashboards: Offer clients visibility into key metrics relevant to their usage, such as API performance or service uptime, enhancing transparency and user trust.
- IoT Monitoring Panels: Display real-time IoT sensor data in custom-built platforms, helping engineers and operators monitor equipment health or environmental factors directly from their systems.
- Executive Reports: Embed visual summaries into business intelligence tools or executive dashboards, giving leadership access to high-level KPIs without navigating complex systems.
However, it's crucial to consider security when embedding dashboards. You must ensure that sensitive data is protected and that only authorized users can access the embedded visualizations.
Methods of Embedding Grafana Dashboards
There are several ways to embed Grafana dashboards into a web application, each suited to different levels of complexity and security requirements.
1. Snapshot Method
Grafana allows users to create public snapshots of dashboards, which can then be shared via a simple URL. These snapshots are static and provide a snapshot of the dashboard at the time it was created.
- Advantages: Quick and easy method to share a dashboard.
- Disadvantages: The data in the snapshot is static, and the dashboard is publicly accessible.
Follow the given steps to embed the static version of your Grafana dashboard:
Open the dashboard you want to share.

Open the dashboard Click on the share icon in the top navigation bar.

Find share icon in the top navigation bar Select the "Snapshot" tab.
Click "Publish to snapshot.raintank.io" to create a public snapshot.
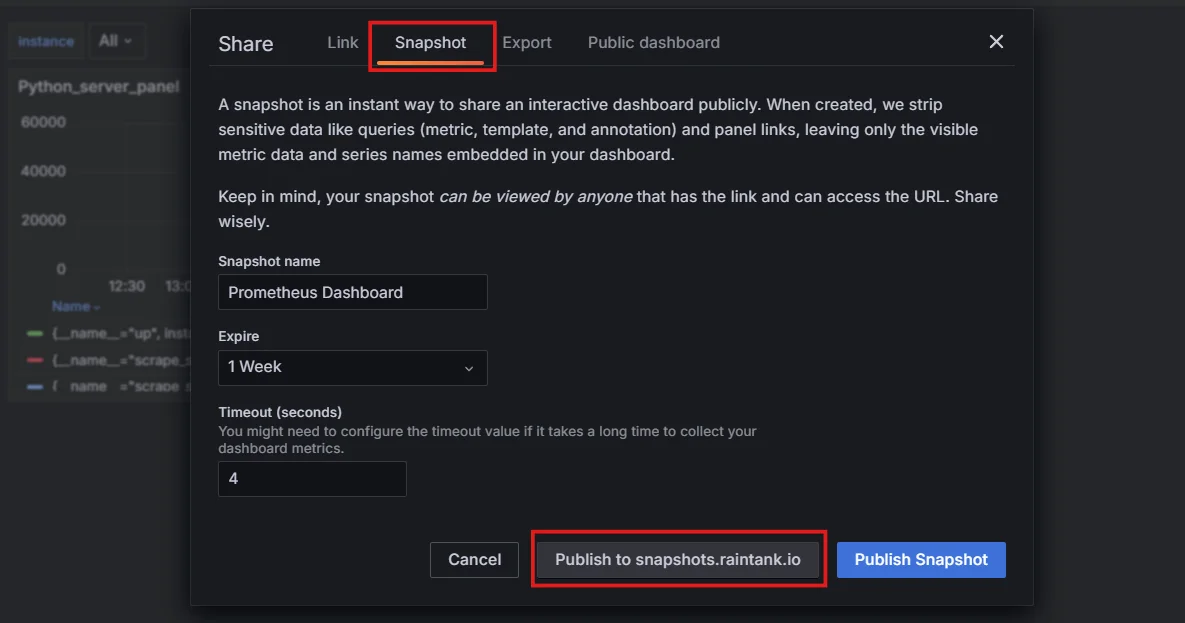
Create a public snapshot You will get the Snapshot URL.

Fetch the Snapshot URL After creating a snapshot of your Grafana dashboard, you can easily embed it into any web application or website using an iframe.
Embedding using Iframe
An
iframe(short for "inline frame") allows you to display content from one webpage inside another, such as embedding your Grafana dashboard into a separate web page or application.Here’s how you can do it:
Copy the Embed Code: Use the following code snippet, and replace
your-snapshot-idwith the actual snapshot ID from your Grafana instance:<iframe src="https://snapshot.raintank.io/dashboard/snapshot/your-snapshot-id" width="800" height="600" frameborder="0"></iframe>In this example:
- The
srcattribute contains the link to your Grafana snapshot. - The
widthandheightattributes control the size of the embedded dashboard. You can modify these values based on how large or small you want the dashboard to appear. frameborder="0"removes the border around the iframe for a cleaner look.
- The
Where to Paste It: You can paste this code directly into the HTML of any web page or application that supports HTML, such as a web app, content management system, or even a simple HTML file. When the page loads, the Grafana snapshot will display within the specified area.
Example HTML File
<!DOCTYPE html>
<html lang="en">
<head>
    <meta charset="UTF-8">
    <meta name="viewport" content="width=device-width, initial-scale=1.0">
    <title>Embedded Grafana Dashboard</title>
</head>
<body>
    <h1>My Grafana Dashboard</h1>
    <p>Here is a live snapshot of my Grafana dashboard:</p>

    <!-- Embed Grafana Snapshot -->
    <iframe src="https://snapshot.raintank.io/dashboard/snapshot/your-snapshot-id"
            width="800" height="600" frameborder="0"></iframe>

    <p>Dashboard embedded using an iframe.</p>
</body>
</html>
Adjust the Settings:
- Width and Height: You can adjust the width and height parameters to fit the size of your page or app. For example,
width="100%"will make it span the full width of the page. - Scrolling: By default, if the embedded dashboard is too large, users may need to scroll within the iframe. If needed, you can enable or disable scrolling using the
scrolling="yes"orscrolling="no"attributes.
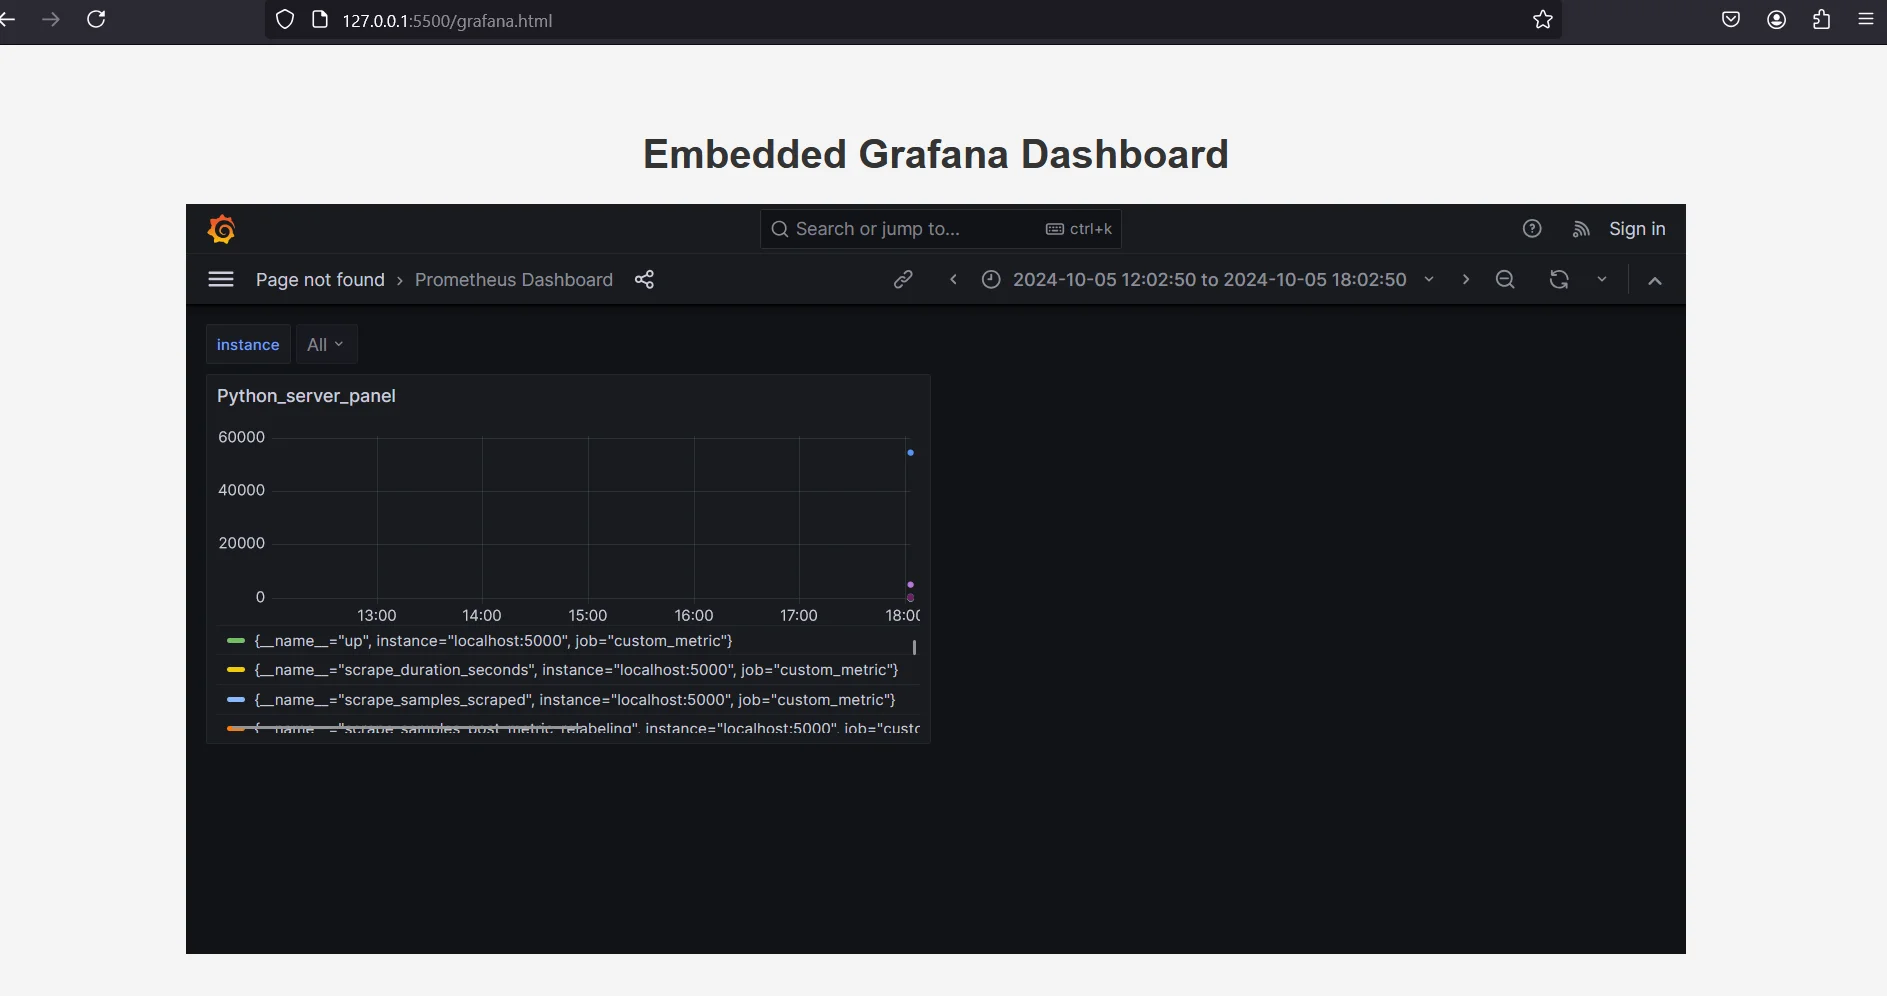
Embedded Grafana Dashboard - Width and Height: You can adjust the width and height parameters to fit the size of your page or app. For example,
2. Public Dashboards Feature
You can make Grafana dashboards publicly accessible and then embed them into your website. This method allows for full interactivity and live data updates but does not provide fine-grained control over access.
- Advantages: Full interactivity and live updates.
- Disadvantages: Requires making the dashboard public, which may not be suitable for all use cases.
Grafana's public dashboard feature allows you to share entire dashboards without authentication:
Navigate to the dashboard you want to make public.
Click the "Share" button and select "Public dashboard".
Toggle the "Public dashboard" switch to enable it.
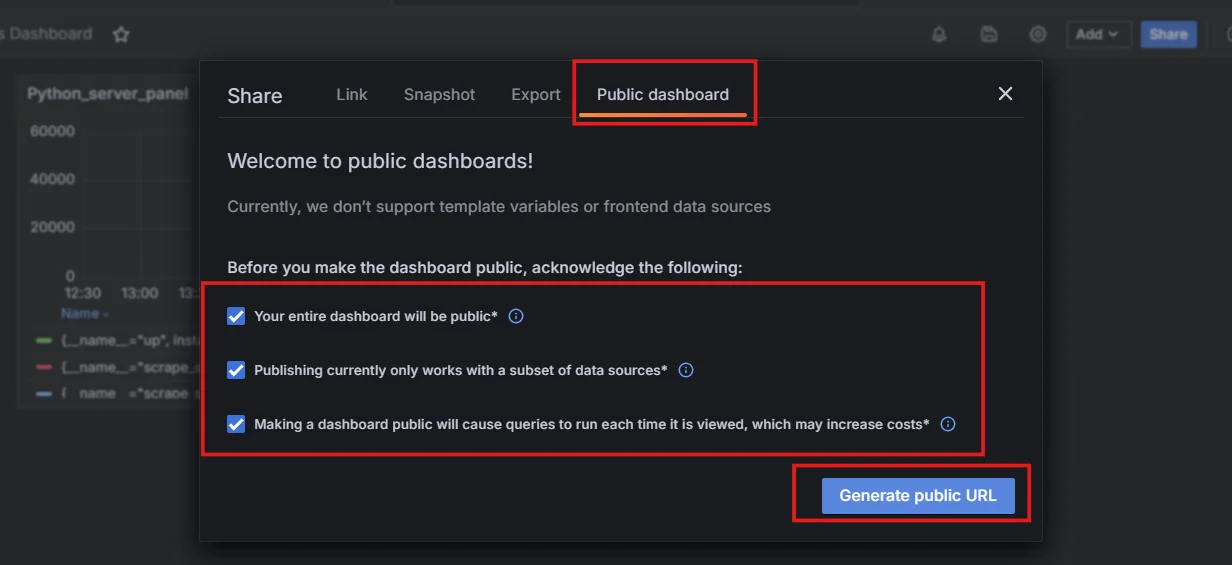
Public Dashboards Feature Copy the provided URL and iframe code to embed the dashboard.
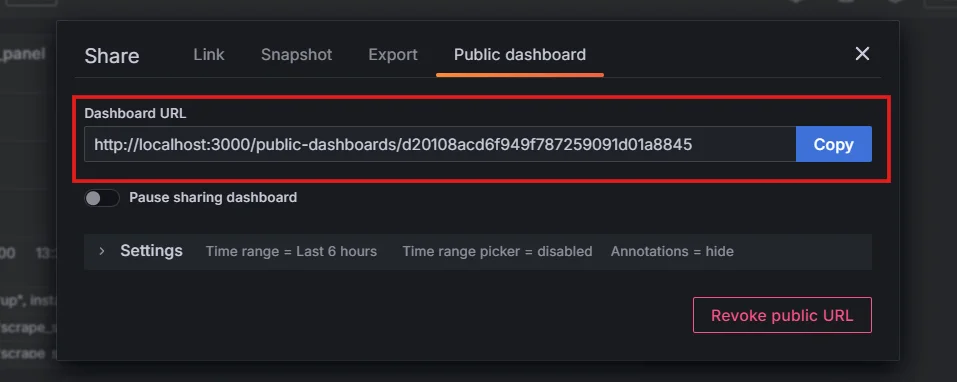
Dashboard URL using Public Dashboards Feature Once you have the dashboard URL you can use an
iframeas described before to embed it in the web page.
3. Grafana API Embedding
For more advanced use cases, you can use the Grafana API to embed dashboards dynamically. This method gives you full control over how dashboards are displayed and how data is fetched, allowing for more customization.
- Advantages: Highly customizable and secure.
- Disadvantages: Requires more effort to implement and maintain.
Steps for Embedding Grafana Dashboards Using the API
Login to Grafana as an admin.
Go to Administration → Users and access → Service accounts, and click on
Add service accountbutton.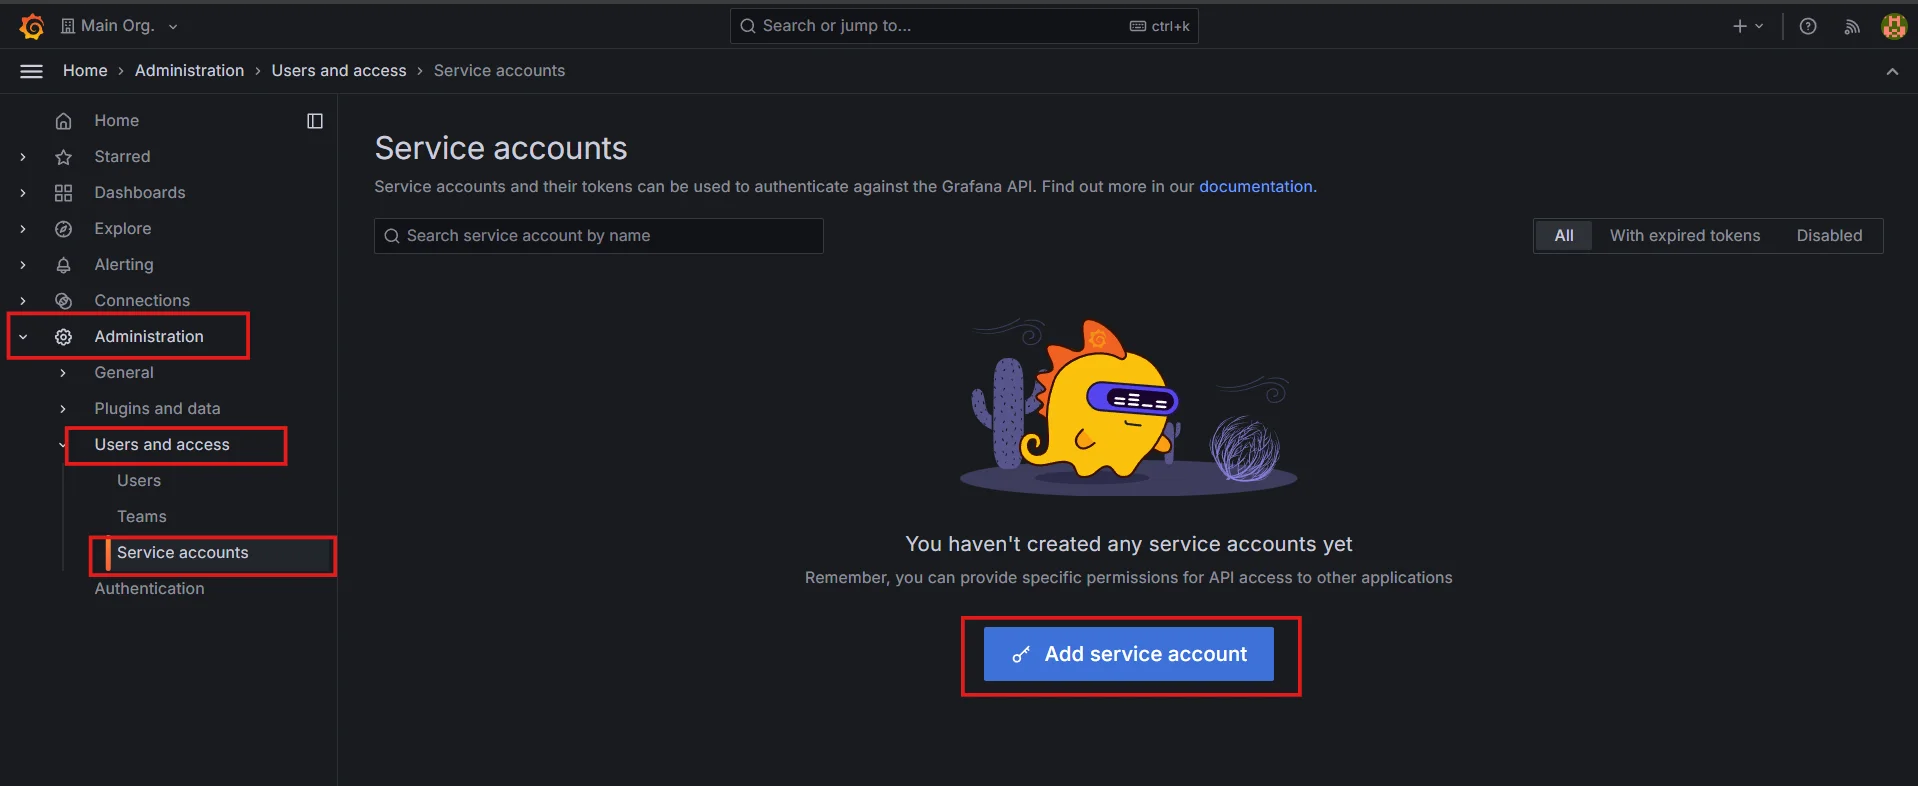
Adding service account in Grafana Add the display name for the service account, choose the corresponding role, and click on the
Createbutton.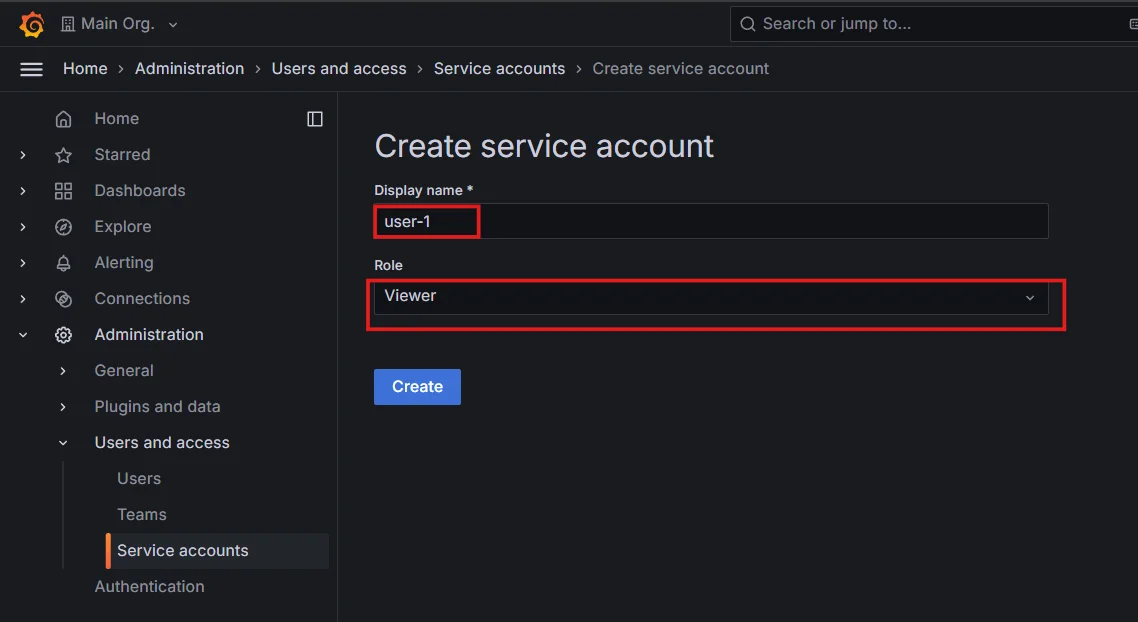
Creating service account in Grafana Next, click on the
Add Service account token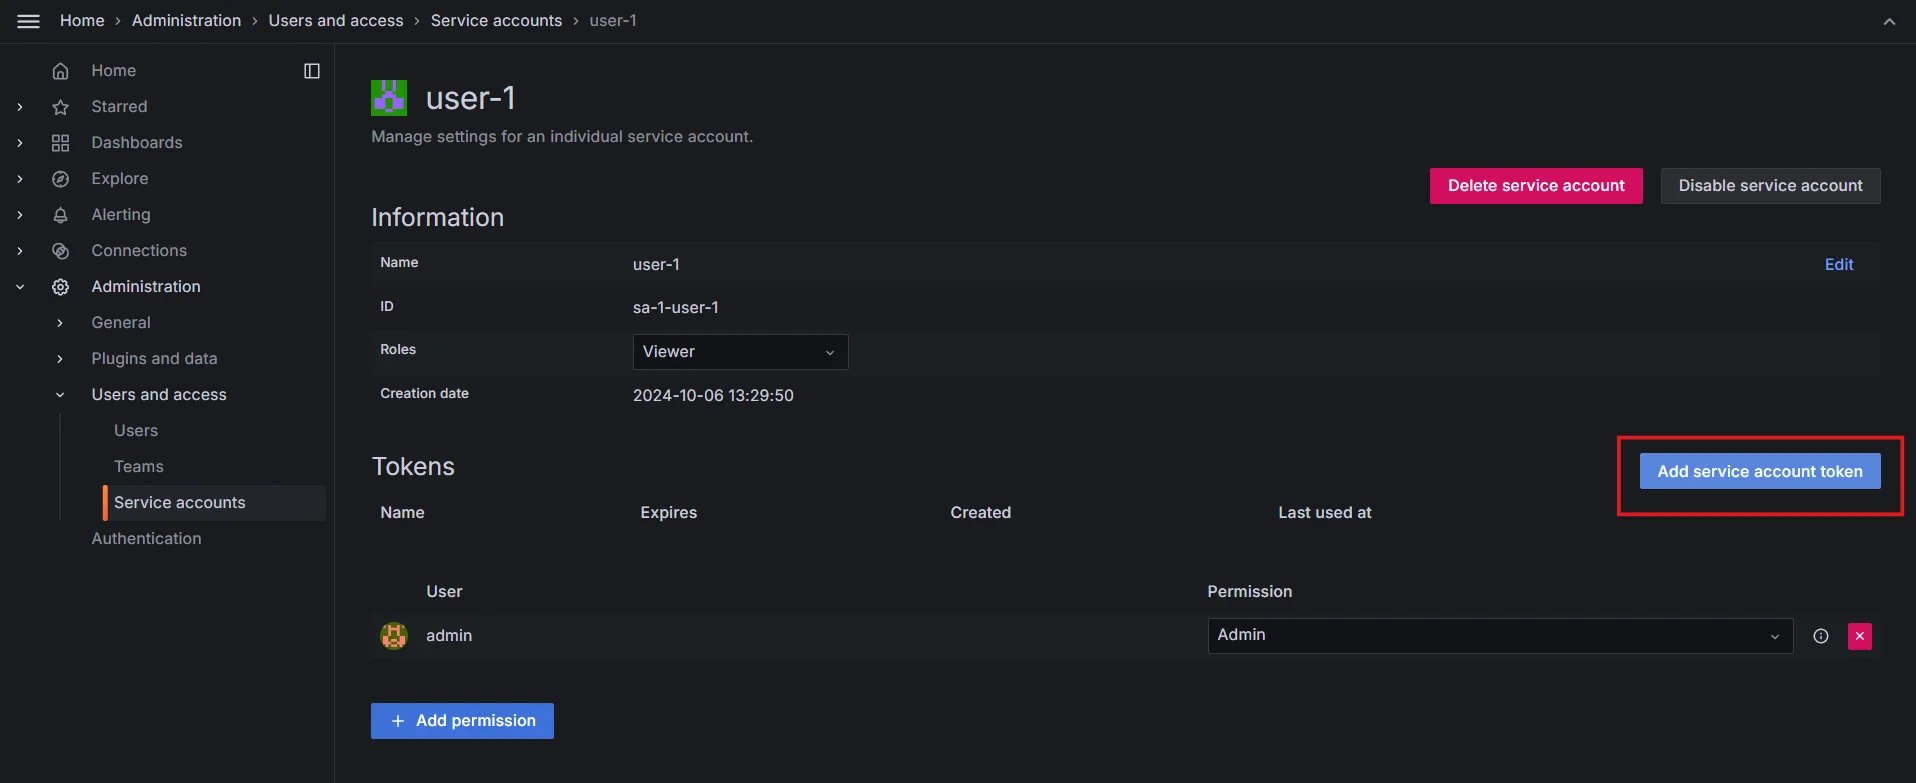
Add service account token Generate a token, you can also set an expiration date if you want. The token will be used for access.

Generate token for service account Fetch the Dashboard UUID: Once you are in the dashboard you want to embed check the URL to get the dashboard UUID.
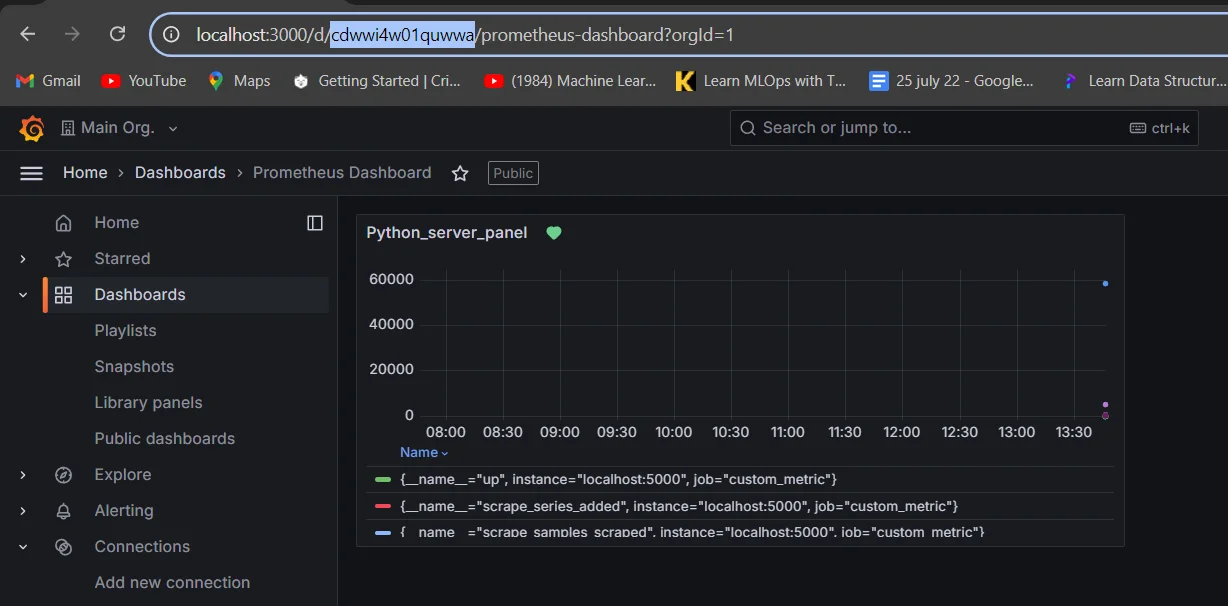
Fetch the Dashboard UUID Fetch Dashboard Data
Use Grafana's API to retrieve the dashboard JSON using the dashboard link:
curl -H "Authorization: Bearer <Service_account_token>" \
     -H "Content-Type: application/json" \
     https://your-grafana-instance/api/dashboards/uid/<UID>
Replace
<UID>with the dashboard's UID from the URL.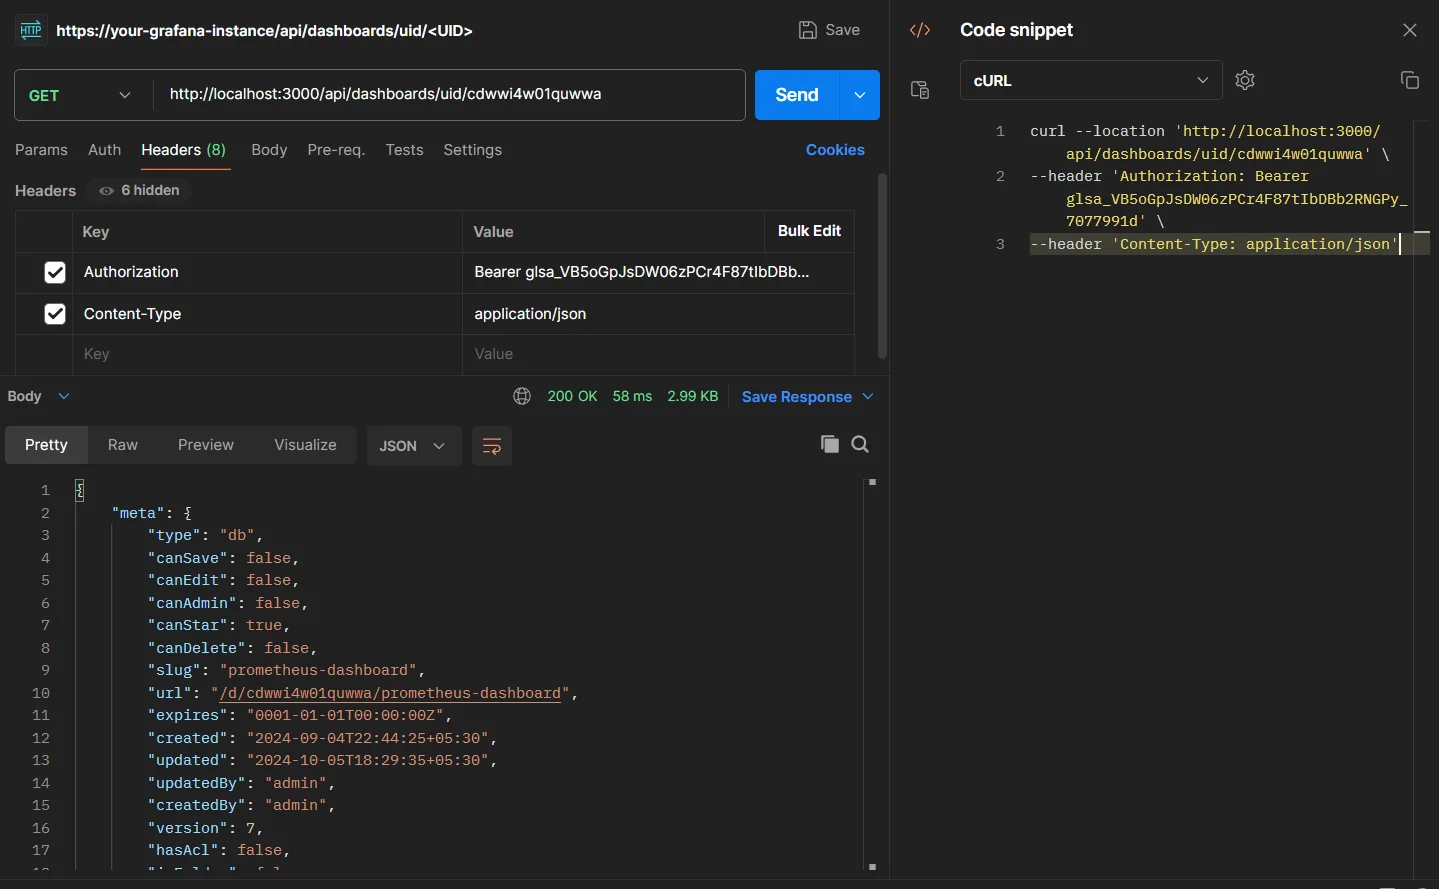
Test the URL Embed in Your Web Application
To dynamically fetch and render the Grafana dashboard in your web application, you can use JavaScript. Instead of simply embedding the iframe, you can programmatically retrieve the dashboard data from Grafana's API and render it within your application.
Here’s how to fetch the dashboard data using JavaScript:
const dashboardUrl = 'https://your-grafana-instance/api/dashboards/uid/your-dashboard-uid';
const serviceAccountToken = 'your-service-account-token';

fetch(dashboardUrl, {
  headers: { 'Authorization': `Bearer ${serviceAccountToken}` }
})
  .then(response => response.json())
  .then(data => renderDashboard(data.dashboard.panels))
  .catch(error => console.error('Error fetching the dashboard:', error));
Explanation:
dashboardUrl: This is the API endpoint for fetching your Grafana dashboard. Replace'your-dashboard-uid'with the actual UID of your dashboard.serviceAccountToken: Grafana requires an API token (usually from a service account) to access the dashboard data. Ensure you replace'your-service-account-token'with a valid API token.renderDashboard(data.dashboard.panels): This function would contain logic to render the dashboard data (e.g., charts, graphs, panels) into your web application.
Example of rendering function (a basic idea to start):
function renderDashboard(panels) {
  const dashboardContainer = document.getElementById('dashboard');
  panels.forEach(panel => {
    const panelElement = document.createElement('div');
    panelElement.className = 'panel';
    panelElement.innerHTML = `
      <h2>${panel.title}</h2>
      <img src="${panel.url}" alt="${panel.title}" />
    `;
    dashboardContainer.appendChild(panelElement);
  });
}
In this example:
- Each panel's title and image (or content) are dynamically rendered within the HTML element with the ID
dashboard. - You can modify
renderDashboardbased on your requirements, whether to display charts, panels, or other components.
Handle CORS: Enable embedding by setting
allow_embedding = truein Grafana'sgrafana.iniunder[security].
Security Considerations for Embedding
When embedding Grafana dashboards, security is a crucial factor, especially when dealing with sensitive or private data. Grafana provides several security measures that you should consider when embedding dashboards into web applications.
- Enable Embedding
Ensure that embedding is allowed by setting the following configuration in your Grafana instance:
[security]
allow_embedding = true
Setting allow_embedding = true in the Grafana configuration is crucial for enabling the embedding of dashboards in external websites or applications. Without this setting, Grafana blocks embedding due to security restrictions, preventing iframe usage.
- Protect Private Dashboards
Embedding private dashboards requires authentication. You can handle authentication by using tokens or session-based authentication to ensure that only authorized users can access the embedded content.
Limitations of embedding private dashboards with authentication:
- Embedding private dashboards with authentication can be challenging because users may need valid credentials to access the content, complicating the seamless experience.
- Additionally, managing access tokens or API keys securely across different platforms can expose sensitive information and increase the risk of unauthorized access.
- Secure API Access
If you’re using the Grafana API for embedding, ensure your API access is properly secured, ideally using token-based authentication and role-based access control (RBAC).
Best Practices for Securing Embedded Dashboards
- Implement HTTPS to secure data in transit.
- Use OAuth or JWT tokens for secure authentication.
- Ensure proper access control to avoid exposing sensitive data.
Troubleshooting Common Embedding Issues
When embedding Grafana dashboards, you might encounter some challenges:
- Cross-Origin Resource Sharing (CORS) Issues:
Enable CORS in your Grafana configuration:
allow_embedding = true
cookie_samesite = none
Set appropriate CORS headers on your web server
- Authentication Challenges:
- Use API tokens for server-side requests to Grafana
- Implement OAuth or SAML for seamless user authentication
- Performance Optimization:
- Limit the number of panels in embedded dashboards
- Use efficient queries and appropriate time ranges
- Consider using Grafana's caching features
- Responsive Design:
Make sure that your embedded dashboard is responsive to various screen sizes by adjusting the iframe size or using CSS media queries.
<div style="position: relative; padding-bottom: 56.25%; height: 0;">
  <iframe src="..." style="position: absolute; top: 0; left: 0; width: 100%; height: 100%;"></iframe>
</div>
Alternatives to Grafana for Dashboard Embedding
While Grafana is a popular choice for dashboard embedding, alternatives like SigNoz offer modern solutions for application monitoring and dashboard creation. SigNoz provides:
Easy-to-Embed Dashboards:
- Through its simple API, developers can seamlessly integrate real-time dashboards into any application with minimal configuration.
- Whether it's embedding live metrics or visualizing performance data, SigNoz makes it easy to customize and tailor dashboards to specific needs.
Built-in Application Performance Monitoring (APM):
- Unlike Grafana, which often requires external APM solutions, SigNoz offers native APM capabilities. This provides deep visibility into application performance, including distributed tracing, error tracking, and resource utilization—all without needing additional tools.
- The integration of monitoring and dashboards in one platform eliminates the complexity of managing multiple systems.
Open-Source Flexibility: Enjoy a user-friendly interface while leveraging the benefits of open-source software.
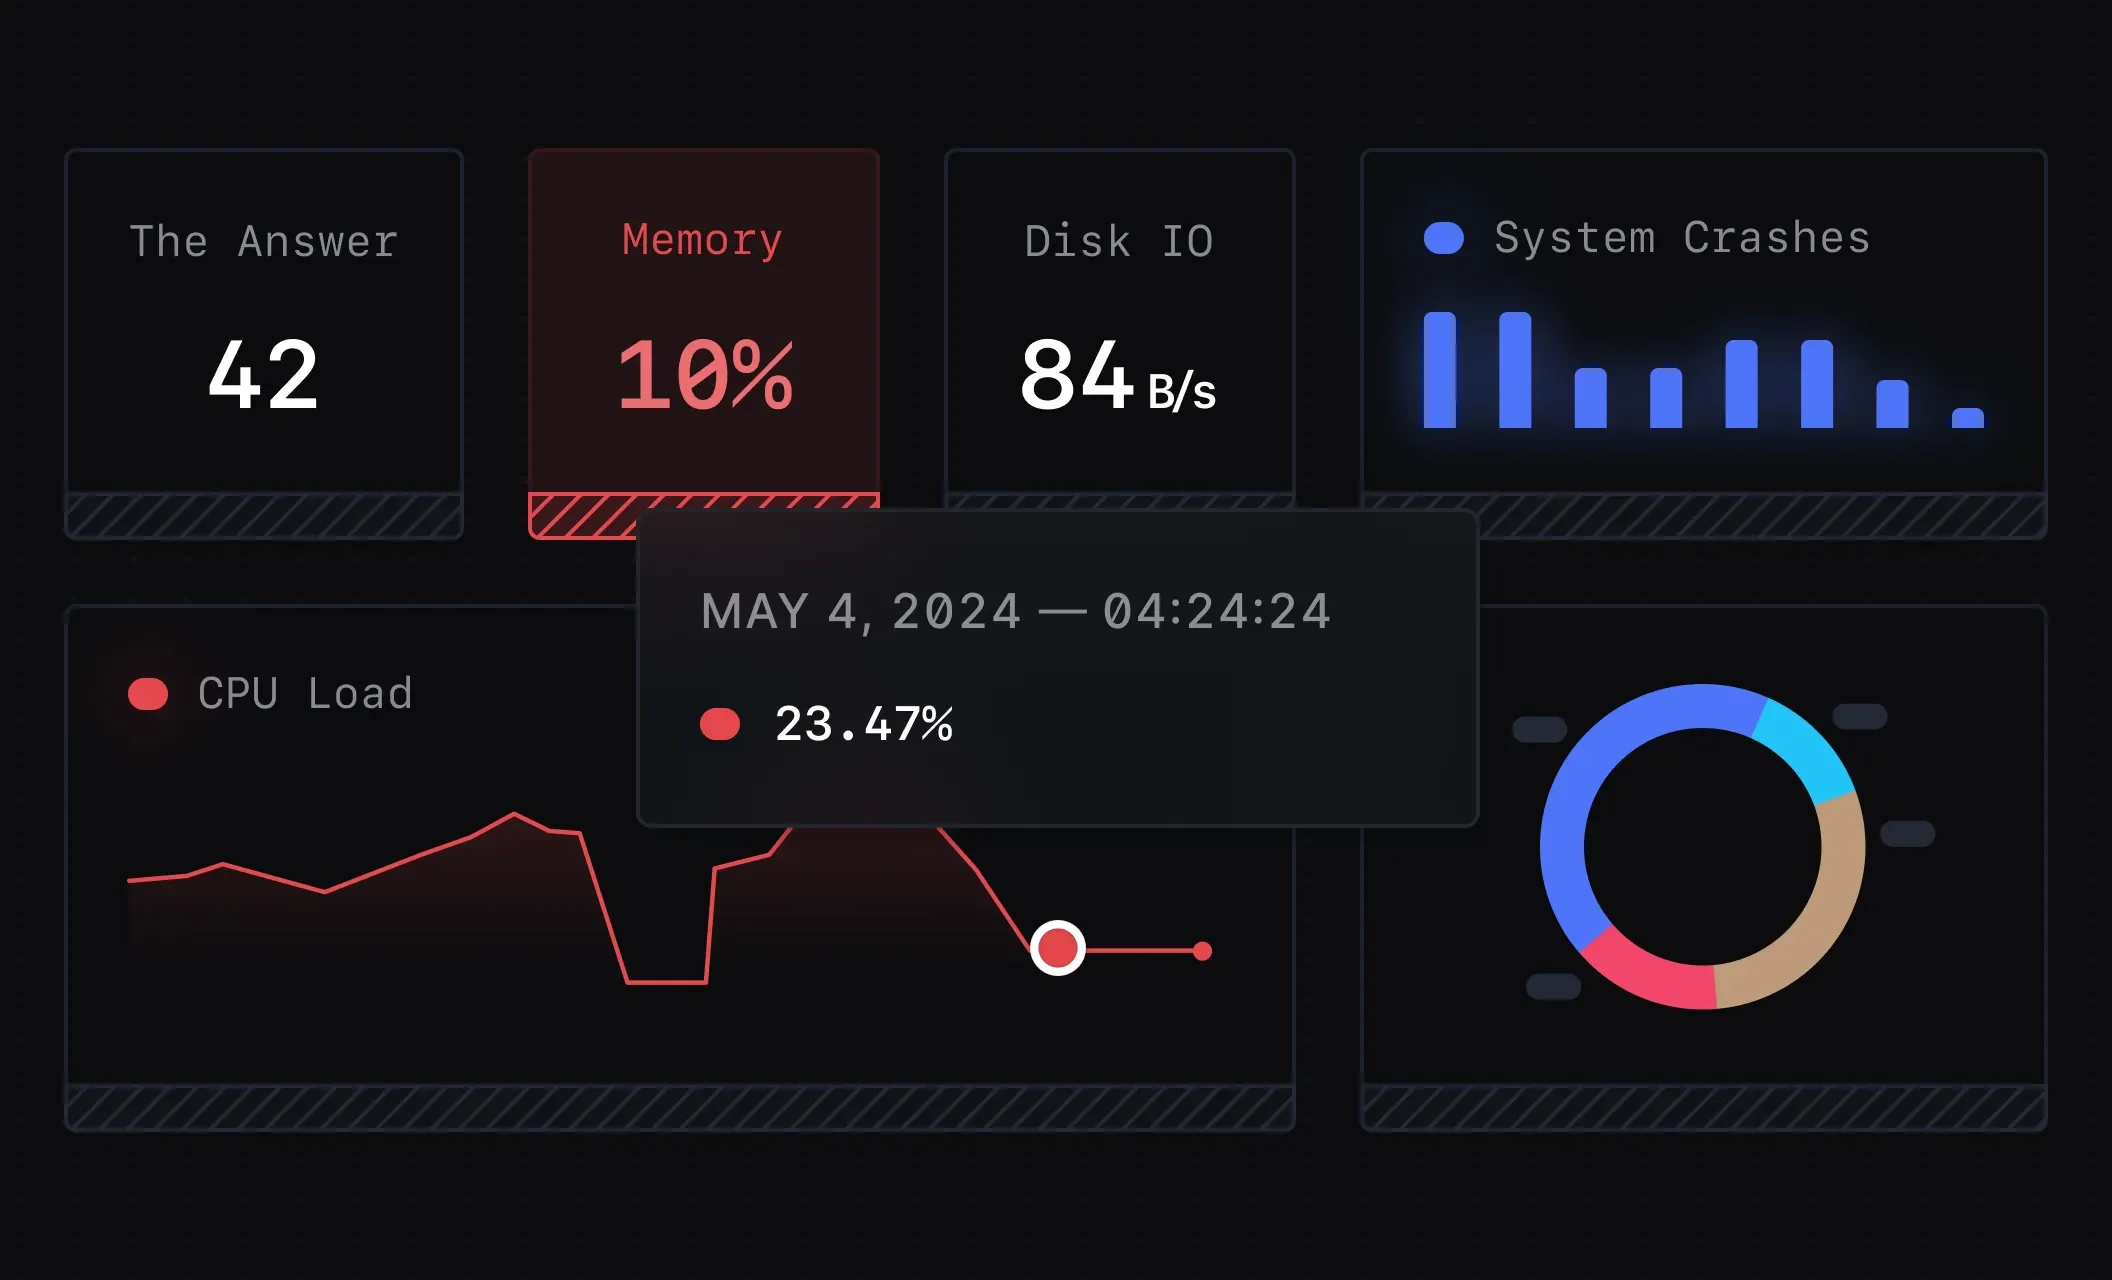
User-friendly SigNoz Interface
SigNoz can be particularly beneficial for teams looking for an all-in-one solution that combines monitoring, tracing, and dashboard embedding.
SigNoz Cloud is the easiest way to run SigNoz. Sign up for a free account and get 30 days of unlimited access to all features.
You can also install and self-host SigNoz yourself since it is open-source. With 24,000+ GitHub stars, open-source SigNoz is loved by developers. Find the instructions to self-host SigNoz.
Best Practices for Embedded Dashboards
To make the most of your embedded Grafana dashboards:
- Implement Responsive Design: Ensure your embedded dashboards adapt to different screen sizes and devices.
- Maintain Data Freshness: Configure appropriate refresh intervals to keep data up-to-date without overloading your systems.
- Optimize Load Times: Minimize the number of panels and data points to improve dashboard loading speed.
- Consistent Branding: Customize dashboard themes to match your application's look and feel.
- User Experience: Provide clear instructions or tooltips to help users interact with the embedded dashboards.
Key Takeaways
- Grafana dashboards can be embedded using snapshots, iframes, public dashboards, or API-based methods.
- Security is paramount — always configure proper access controls and use HTTPS.
- Follow the step-by-step guide to integrate Grafana dashboards into your web applications seamlessly.
- Troubleshoot common issues like CORS and authentication to ensure smooth integration.
- Consider alternatives like SigNoz for comprehensive monitoring and embedding solutions.
- Implement best practices to optimize the performance and user experience of embedded dashboards.
FAQs
Can I embed a Grafana dashboard without making it public?
Yes, you can use Grafana's API or authentication methods to embed private dashboards securely.
How do I handle authentication for embedded Grafana dashboards?
Implement server-side authentication using API tokens or integrate with your application's existing auth system.
What are the performance implications of embedding Grafana dashboards?
Embedded dashboards can impact page load times. Optimize by limiting data points and using efficient queries.
Is it possible to customize the appearance of an embedded Grafana dashboard?
Yes, you can customize themes, sizes, and even create custom panels using Grafana's API and plugin system.
