Grafana Guide - How to Graph HTTP Requests per Minute
Monitoring HTTP requests is crucial for understanding your web application's performance and user experience. Grafana, a powerful open-source visualization tool, combined with Prometheus, offers an effective way to track and analyze HTTP request rates. This guide will walk you through graphing HTTP requests per minute in Grafana using the http_server_requests_seconds_count metric.
Understanding HTTP Requests Monitoring in Grafana
HTTP requests are the core of any web application, facilitating communication between users and servers. Monitoring these requests is crucial for maintaining the health and performance of your application. By tracking HTTP requests, you can identify traffic patterns, performance bottlenecks, and potential issues that may impact user experience.
The key metric in HTTP request monitoring is http_server_requests_seconds_count. This metric, typically exported by your application, counts the number of HTTP requests received by your server. Prometheus, a widely used monitoring and alerting toolkit, collects this data and stores it in a time-series format.
Grafana, in turn, acts as the visualization platform. It enables you to create detailed, real-time dashboards that help monitor and analyze HTTP requests. By connecting Grafana with Prometheus, you can easily query the http_server_requests_seconds_count metric, visualize it in graphs, and interpret patterns or anomalies in HTTP traffic over time.
With this setup, developers can quickly understand how their application is performing, spot trends in request volume, and address issues like high latency or traffic spikes.
Setting Up Grafana and Prometheus for HTTP Request Monitoring
This section walks you through setting up Grafana and Prometheus to monitor HTTP requests by scraping application metrics and visualizing them in Grafana. Monitoring HTTP requests is essential for understanding how your application performs under different conditions, identifying potential bottlenecks, and ensuring that your services are reliable and responsive. By integrating Prometheus to collect metrics from your application and Grafana to visualize these metrics, you can create insightful dashboards that provide real-time insights into the health of your system and improve your overall observability.
Prerequisite
Expose Metrics from Your Application
To monitor your application's performance with Prometheus, the application must expose metrics in a Prometheus-compatible format. Many web frameworks and programming languages provide libraries that simplify the process of exposing these metrics via an HTTP endpoint.
For Java-based applications, libraries like Micrometer and the Prometheus Java Client are commonly used to expose metrics. A sample Java application has been provided. Follow the steps below to expose metrics for the application. If you have an existing application already exposing metrics in Prometheus format, skip this step and move on to configuring Prometheus.
Add the Micrometer Dependency For a Spring Boot application, you’ll need to add the Micrometer dependency to your project. This will allow your app to export its metrics in a format that Prometheus understands.
If you're using Maven, add this to your
pom.xmlfile:<dependency> <groupId>io.micrometer</groupId> <artifactId>micrometer-registry-prometheus</artifactId> </dependency>Configure your Application Configure the application to expose the Prometheus metrics by enabling the Actuator endpoints in your
application.propertiesfile located atsrc/main/resources:management.endpoints.web.exposure.include=prometheus management.endpoint.prometheus.enabled=trueAccess the Prometheus Endpoint
Once your application is running, the Prometheus metrics will be available at
http://localhost:8090/actuator/prometheusOpen the URL in your browser or use a tool likecurlto check if the metrics are being exposed properly.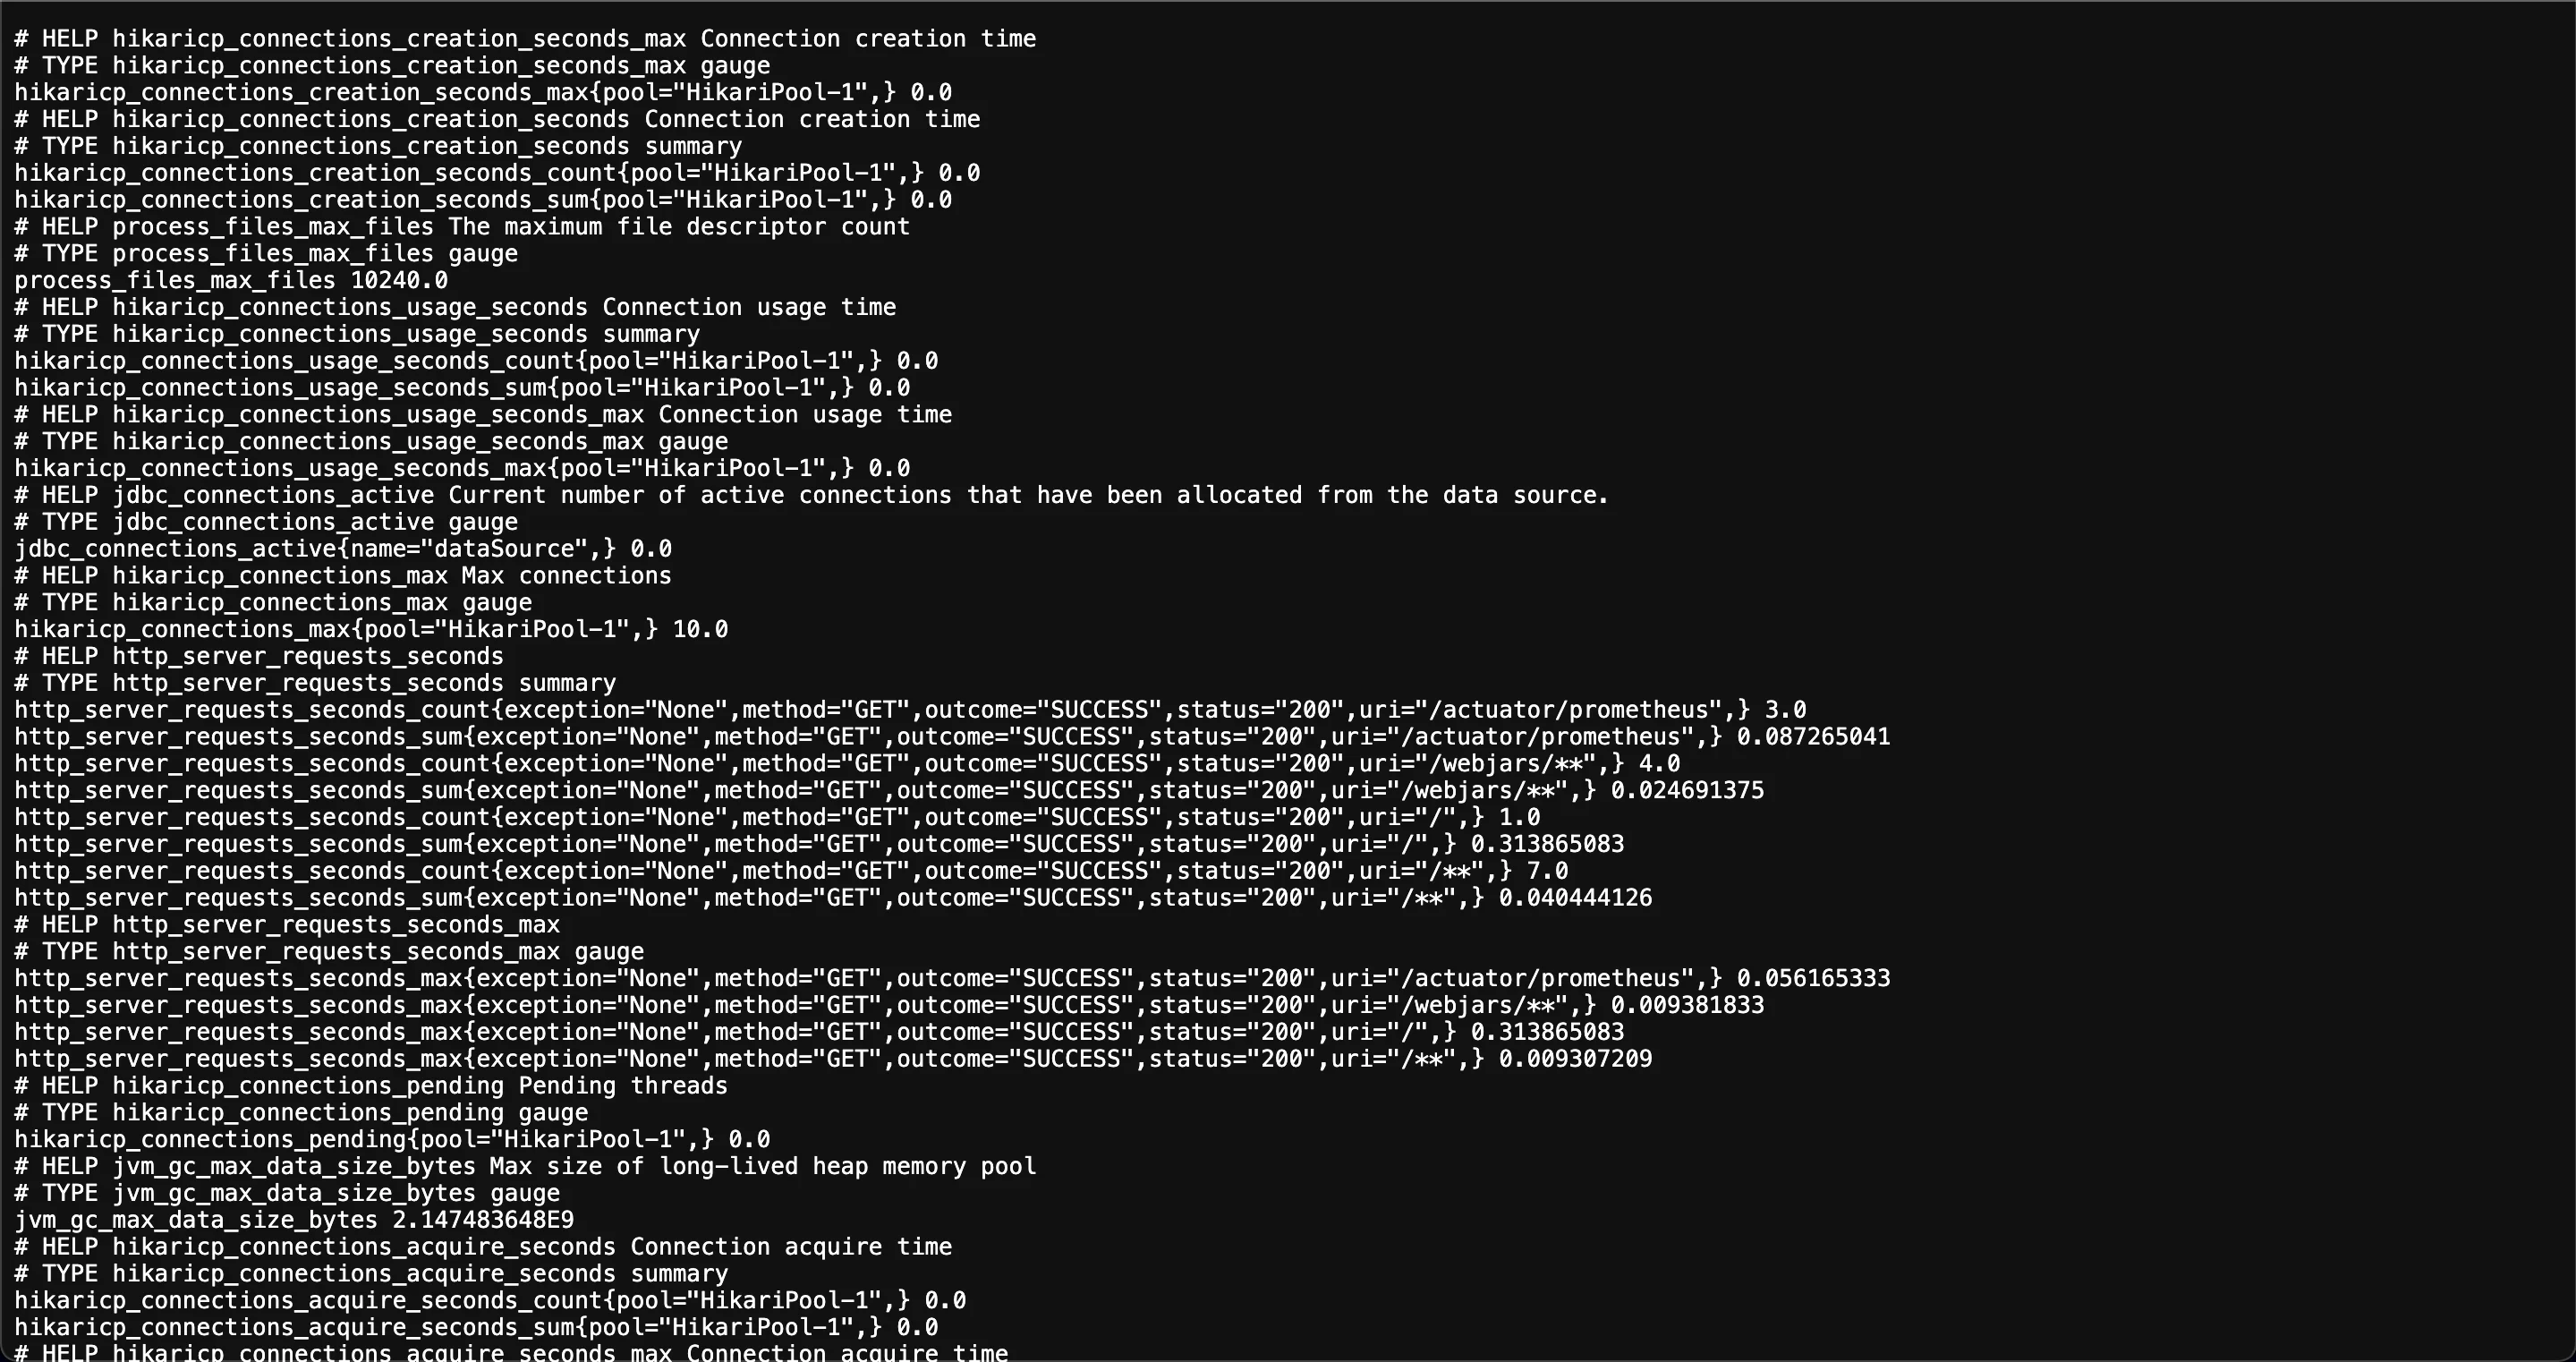
Exposed metrics from Java application in Prometheus format
Set up Prometheus to scrape metrics
Now that your application is exposing metrics, you need to configure Prometheus to collect those metrics. Prometheus does this by periodically checking the endpoint where your metrics are exposed (this process is called scraping).
Modify the Prometheus Configuration File
Modify the
prometheus.ymlconfiguration file to specify the targets Prometheus should scrape metrics from. Add the endpoint of your application under thescrape_configssection:scrape_configs: - job_name: 'my_application' static_configs: - targets: ['localhost:8080']Start Prometheus
To start Prometheus, use the appropriate command based on your installation. For example, If you’ve manually downloaded the Prometheus binary, you can start Prometheus with this command on Linux:
./prometheus --config.file=prometheus.ymlConfirm Prometheus is Scraping Your Application’s Metrics
Open Prometheus in the browser by navigating to
http://localhost:9090. Click on Status > Targets to check if your application’s target is in the UP state.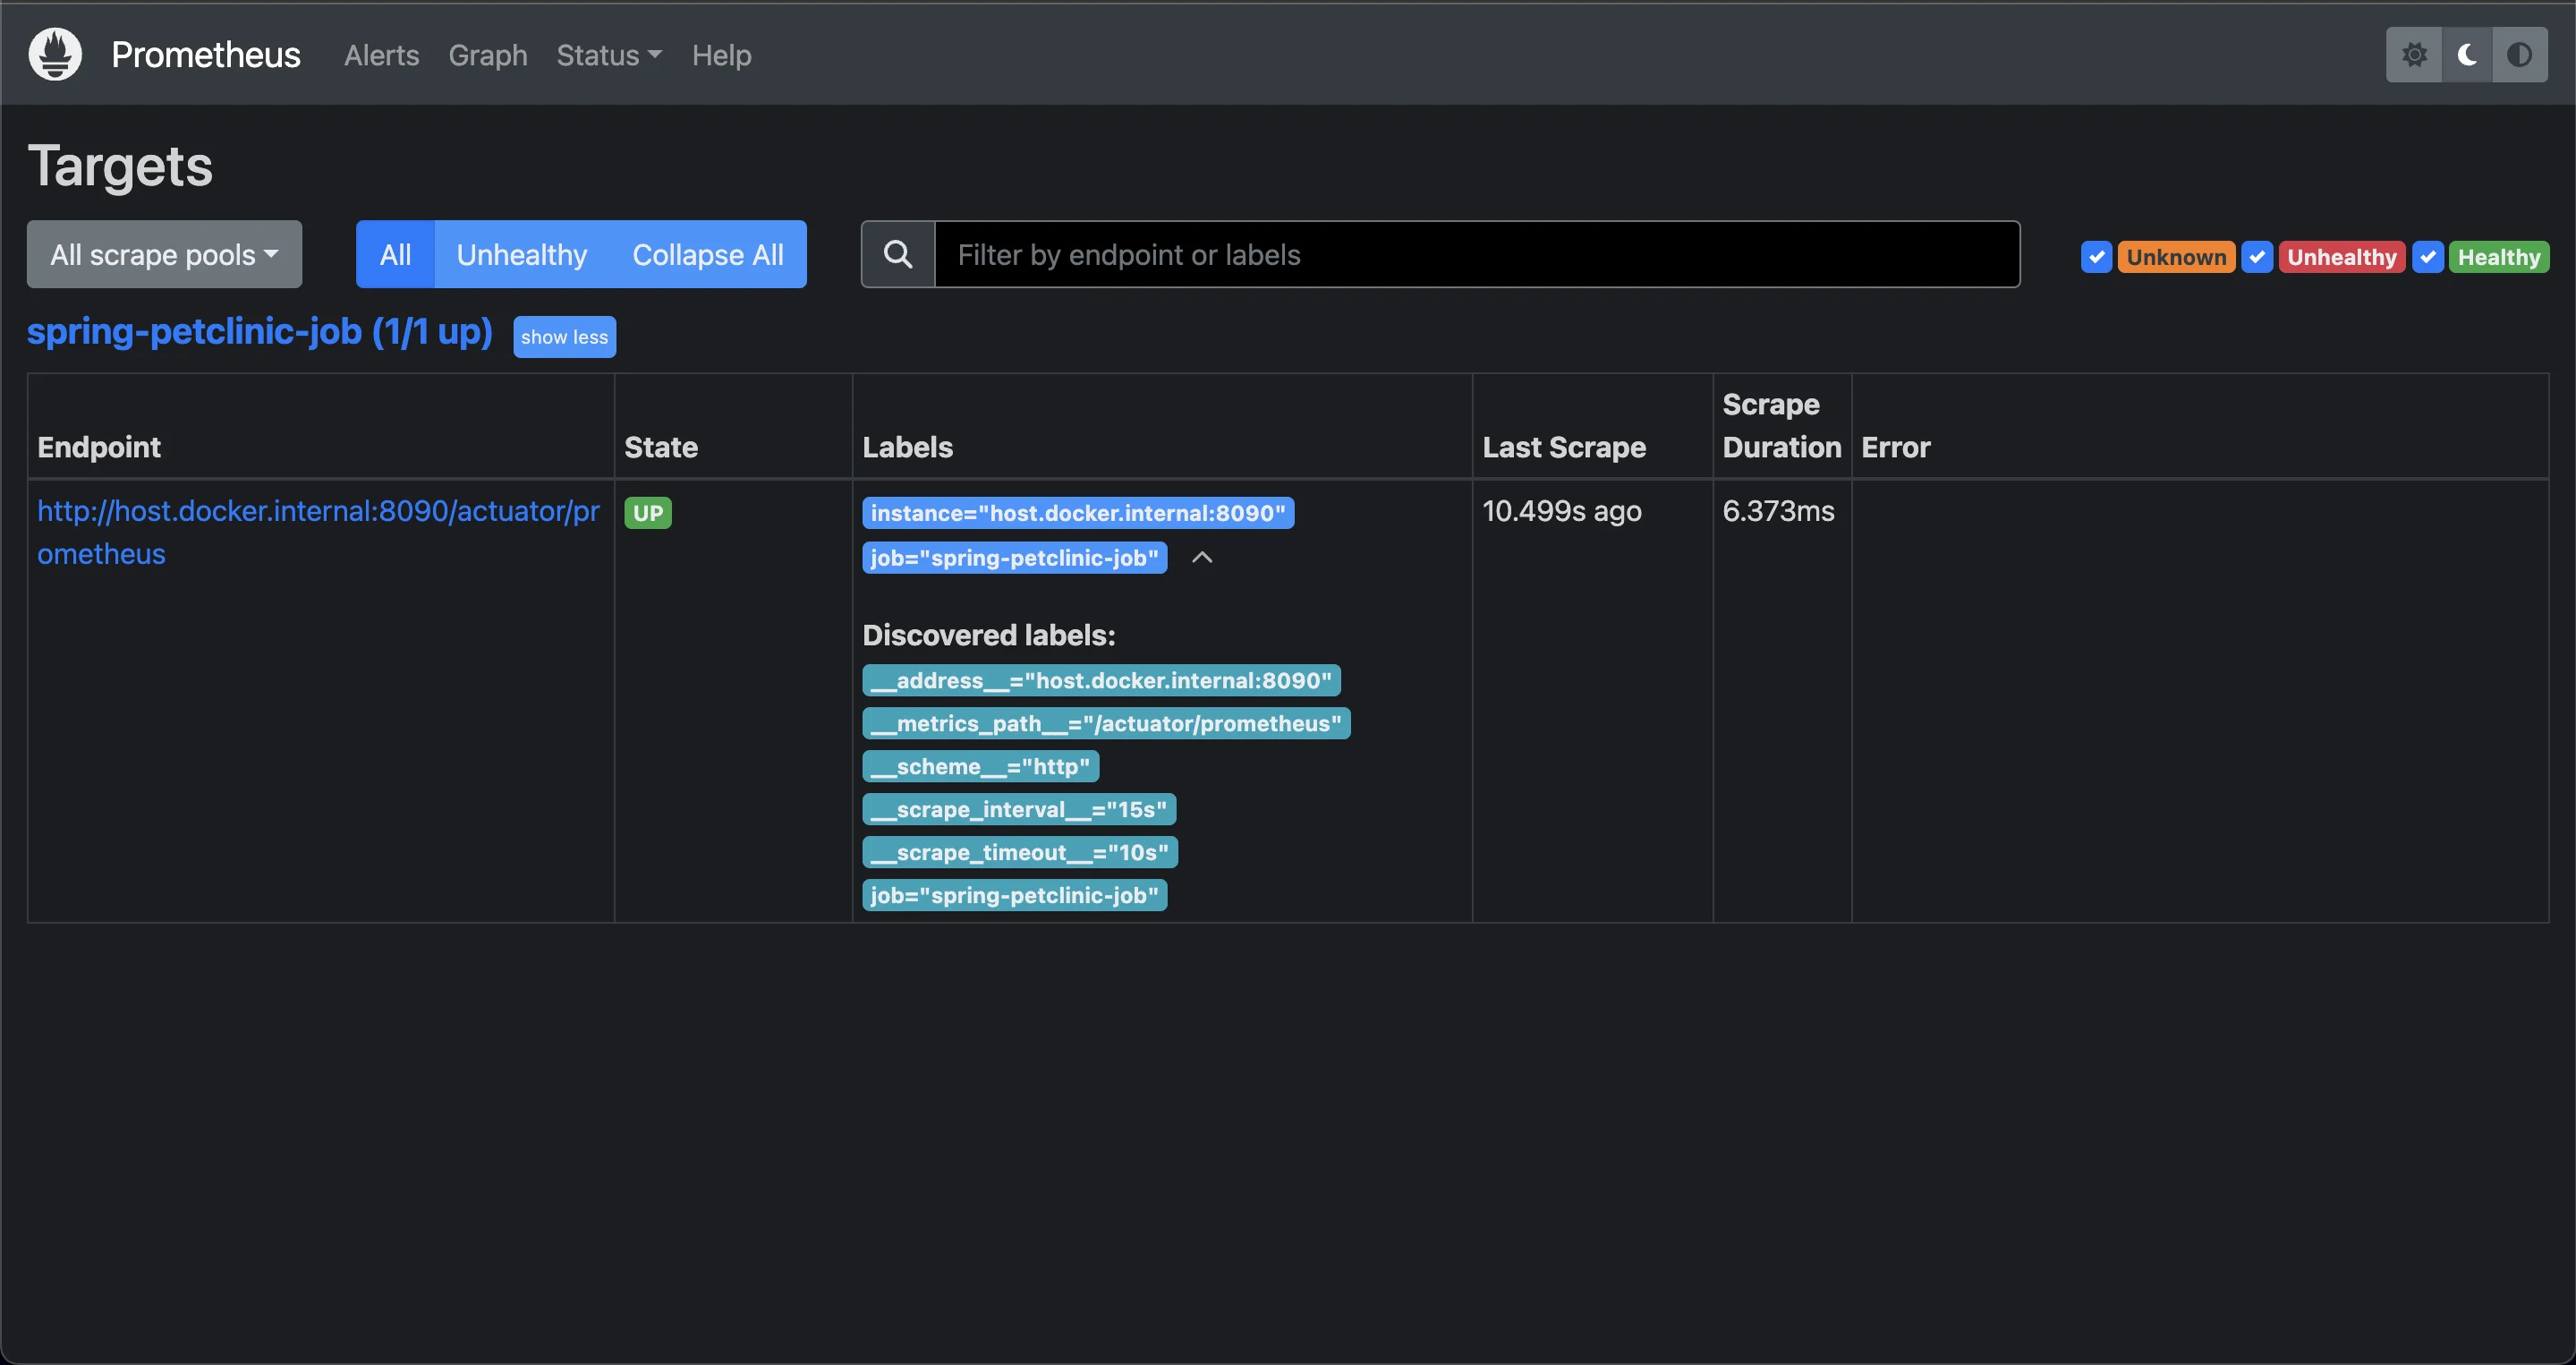
Prometheus targets page To confirm Prometheus is collecting metrics from your application, click on Graph and run a query like
http_server_requests_seconds_count: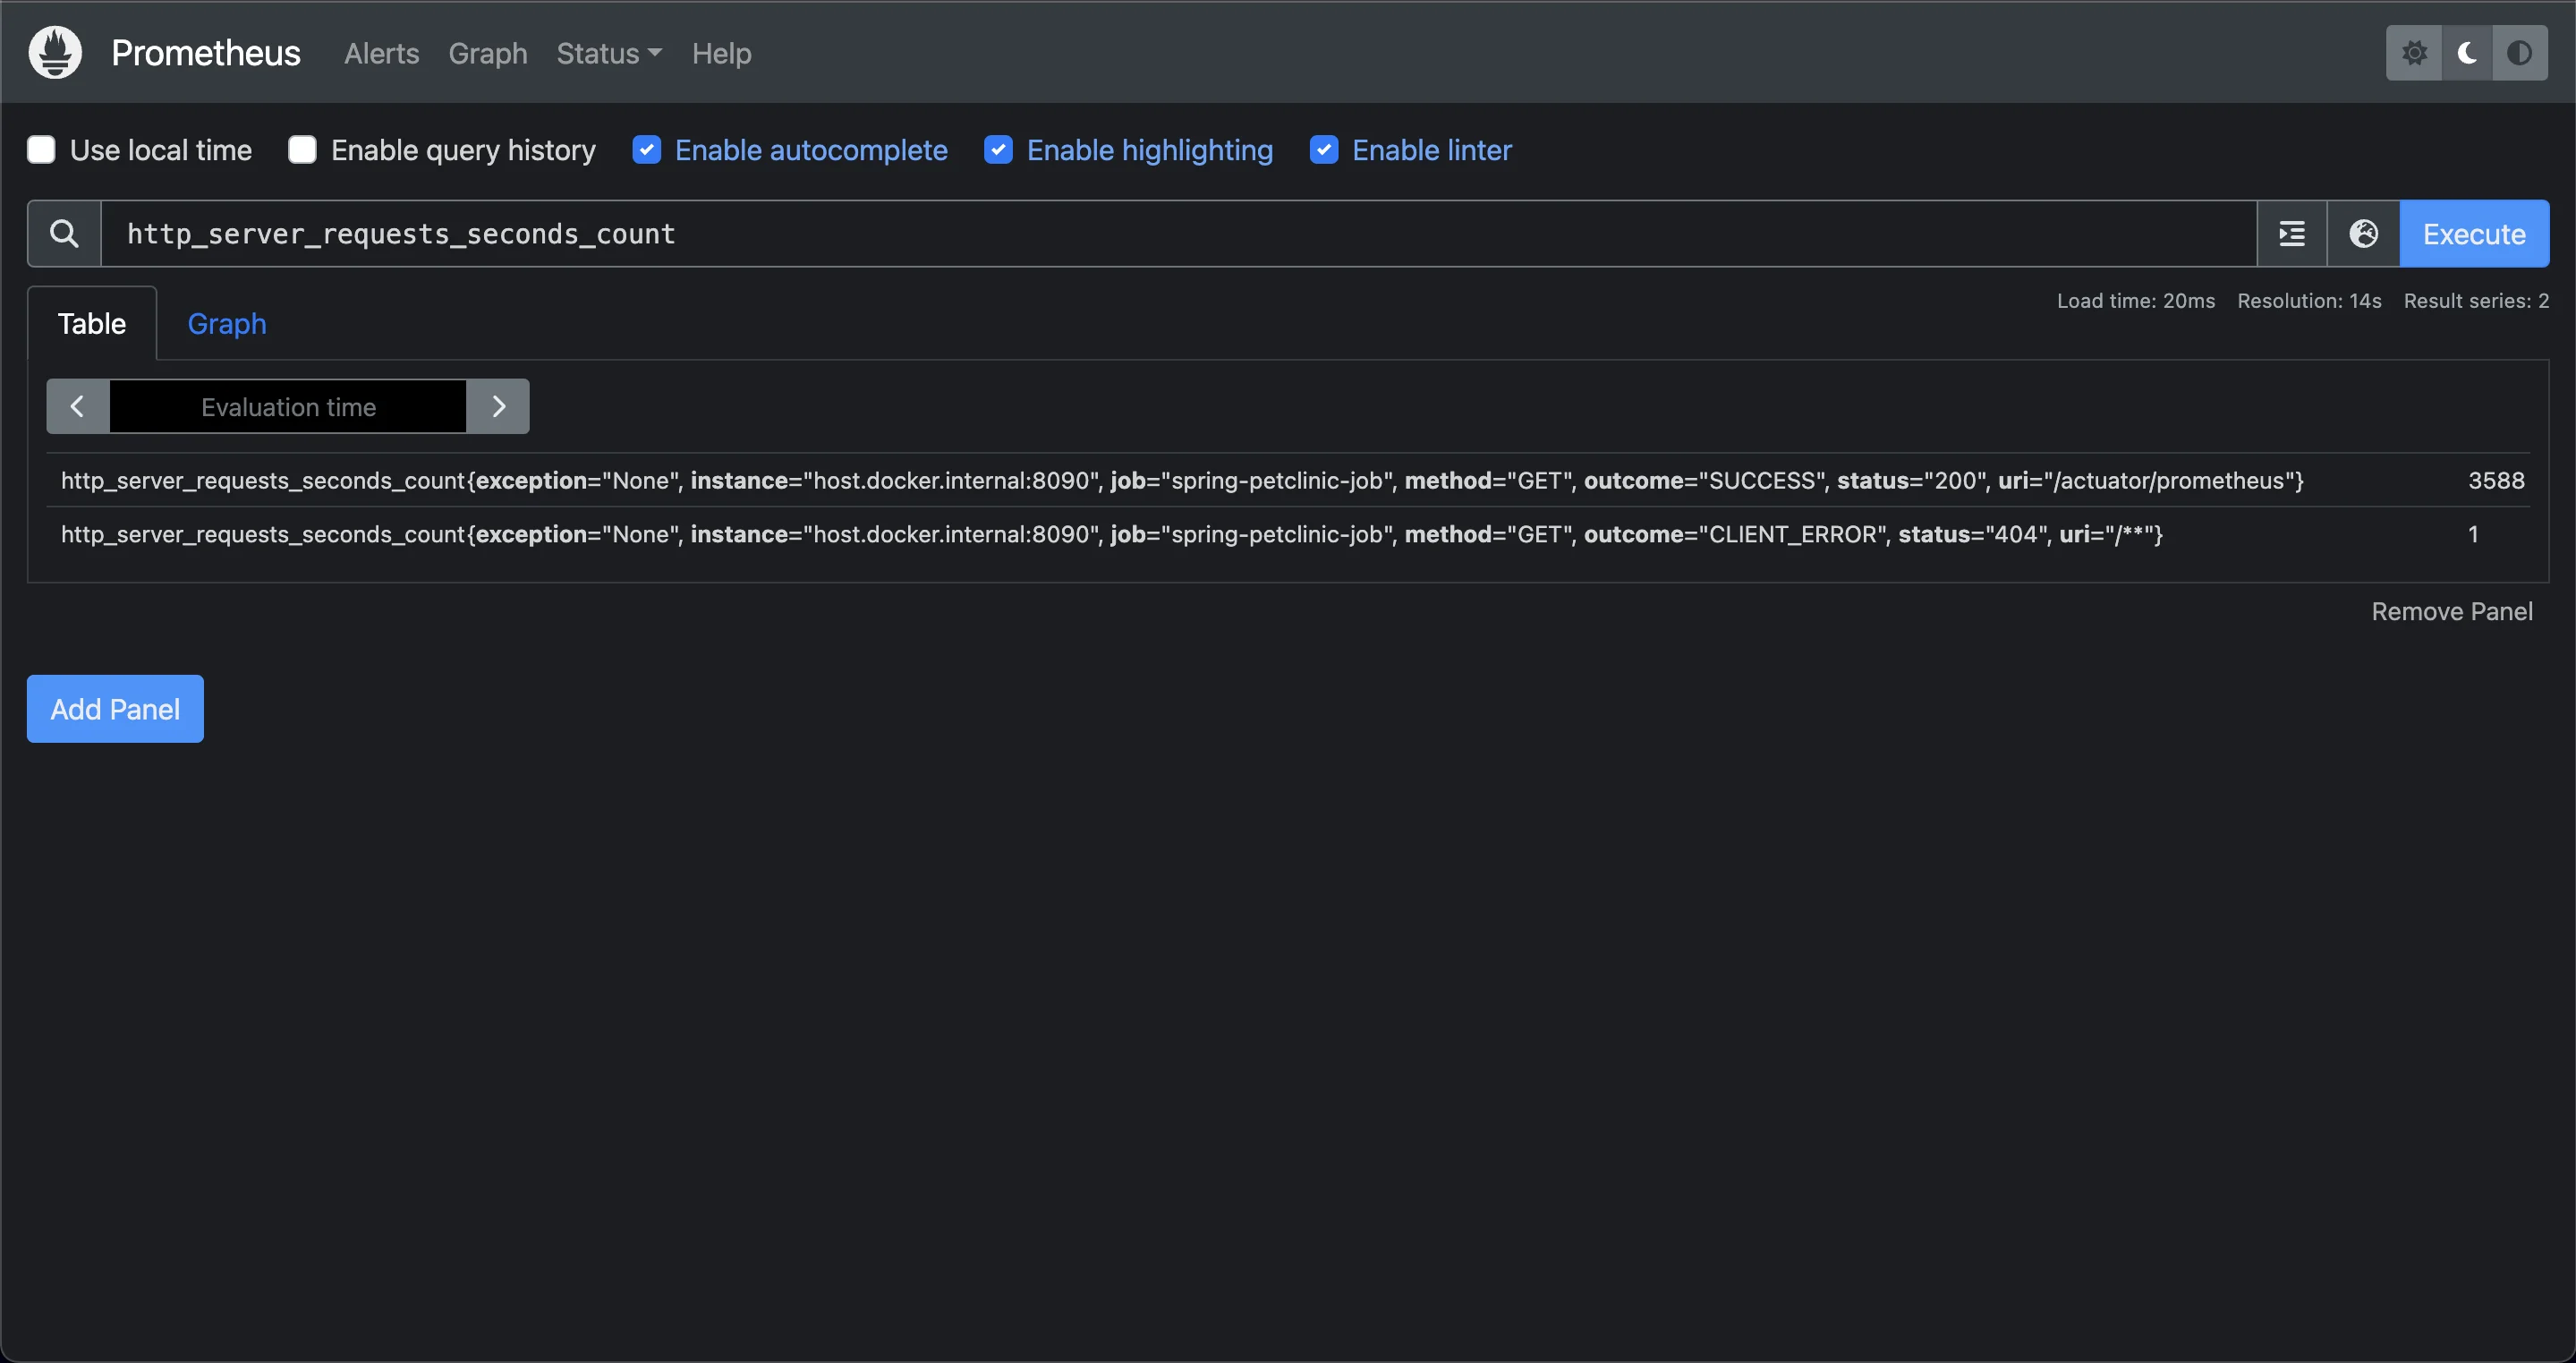
Application metrics being served
Connect Prometheus to Grafana
After configuring Prometheus to collect metrics from your application, you can visualize those metrics in Grafana. Follow these steps:
Log into Grafana
Open Grafana in your browser and log in (default credentials: username
admin, passwordadmin).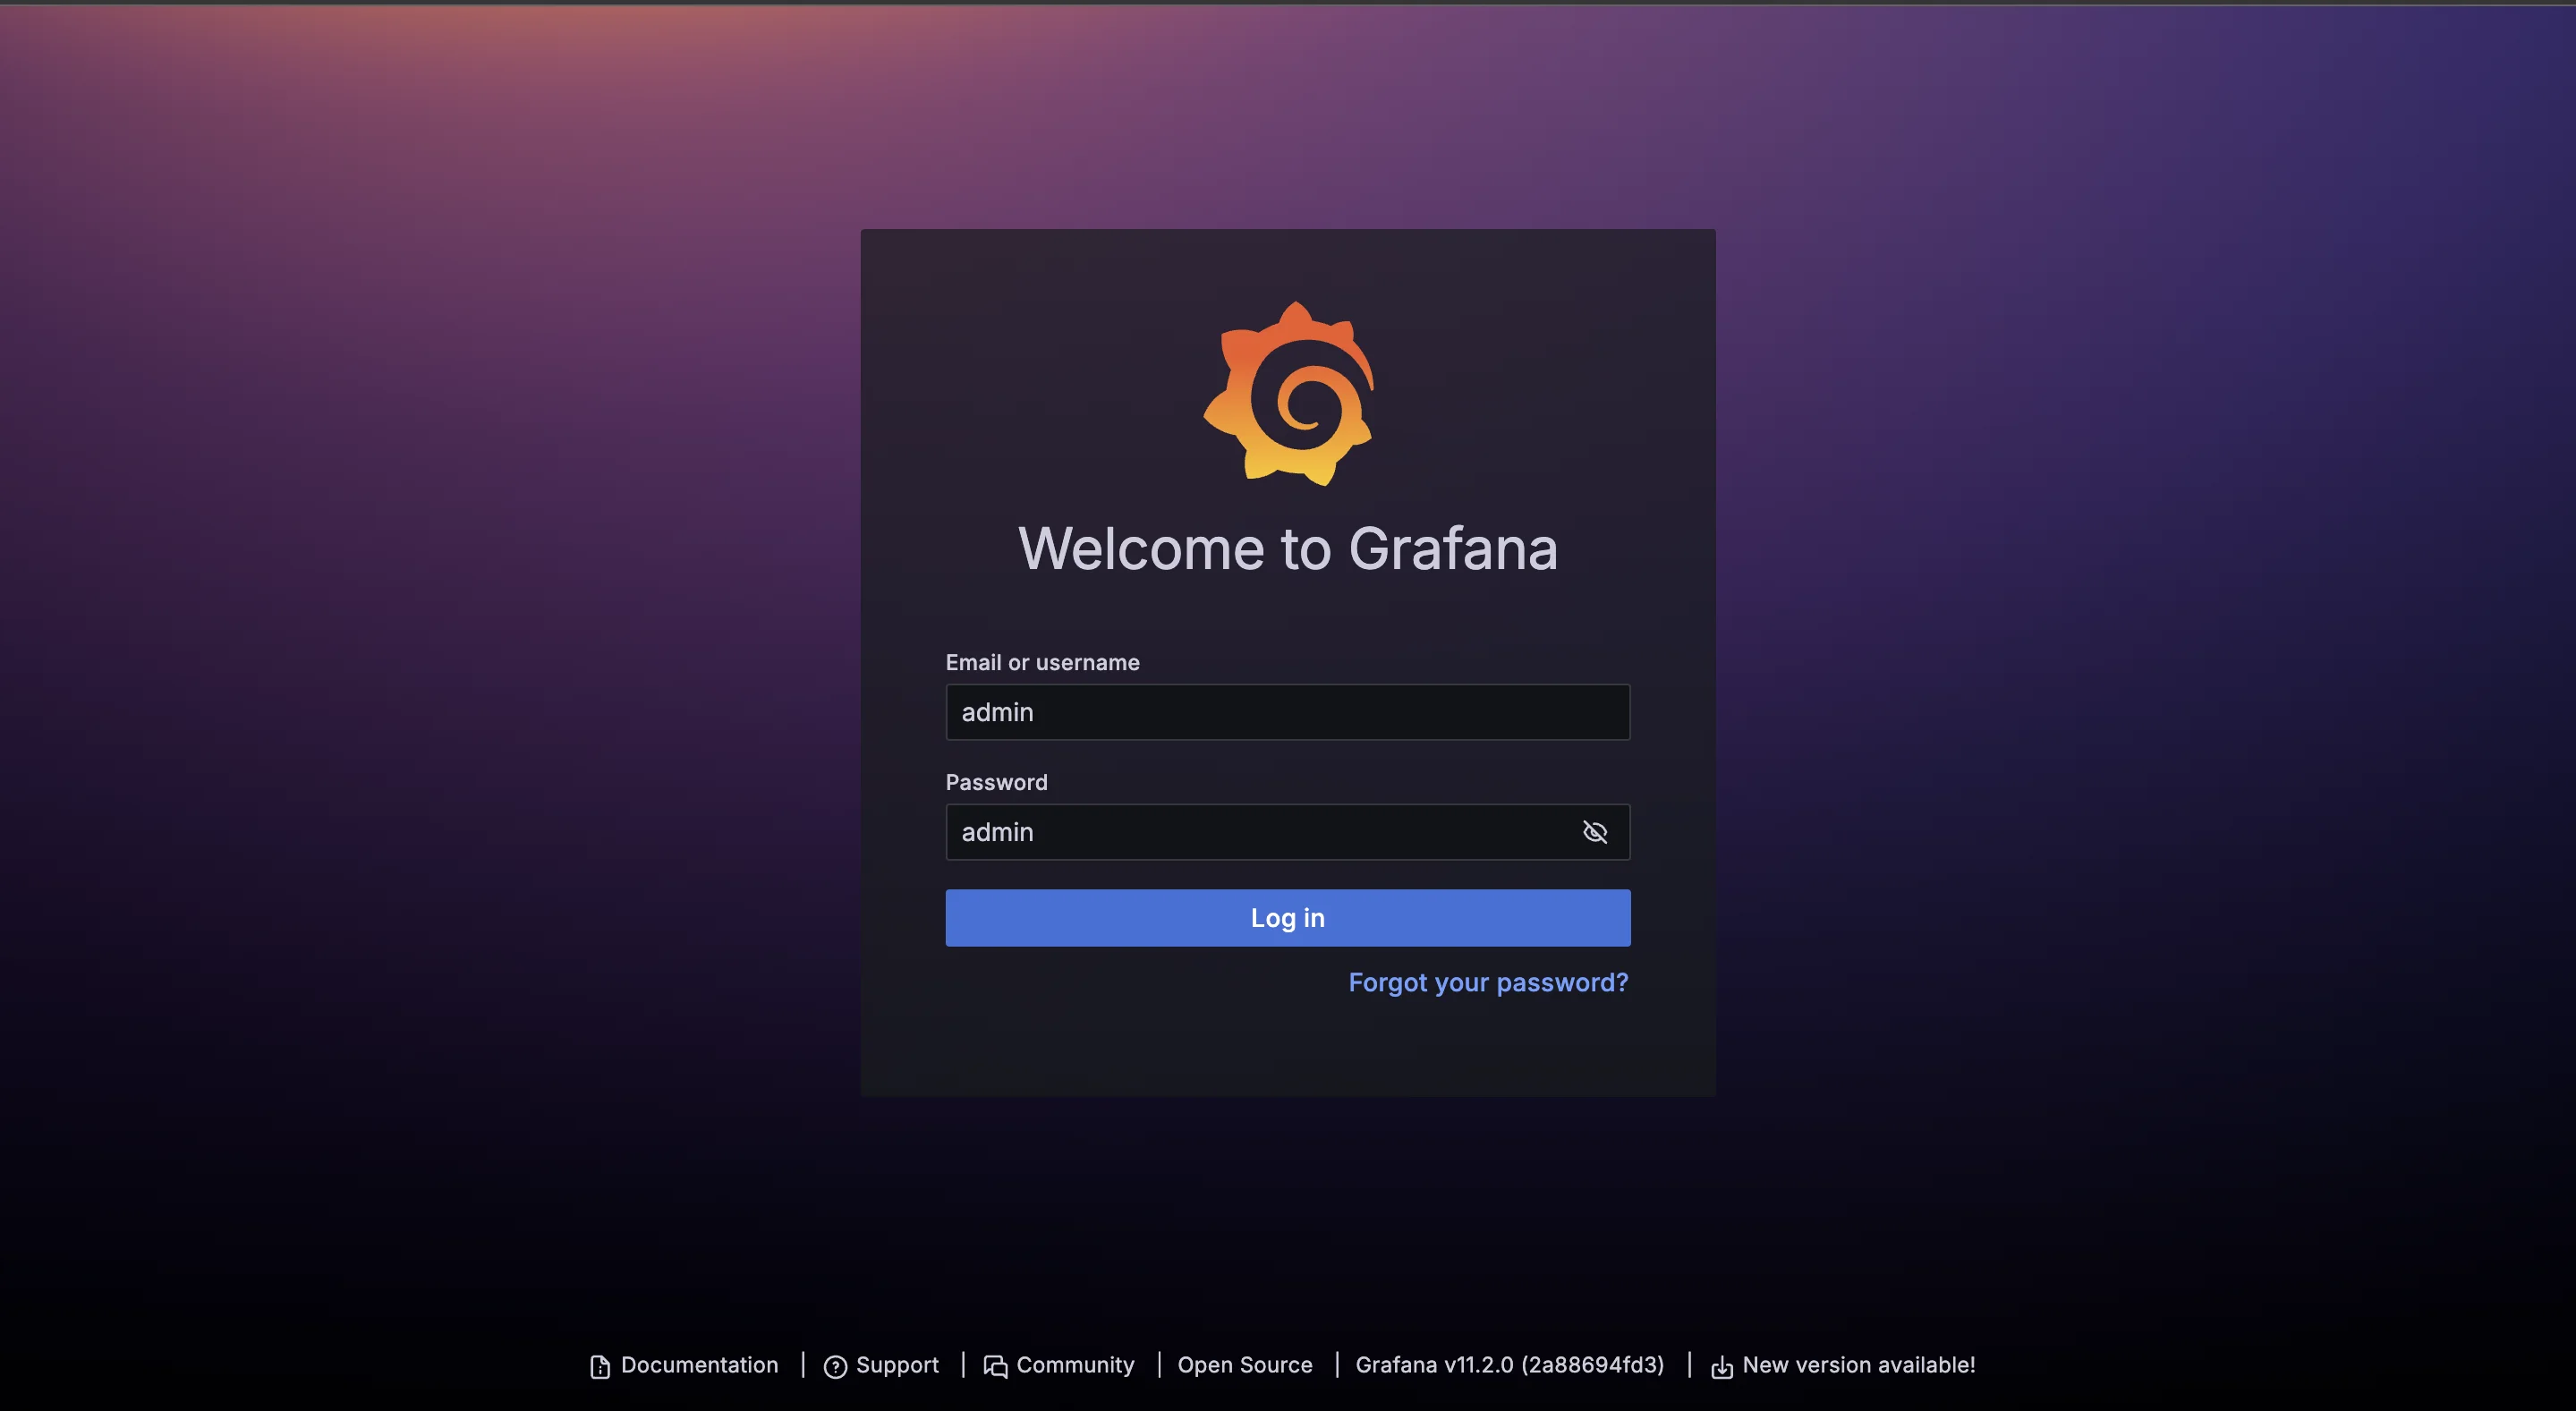
Grafana landing page Add Prometheus as a Data Source
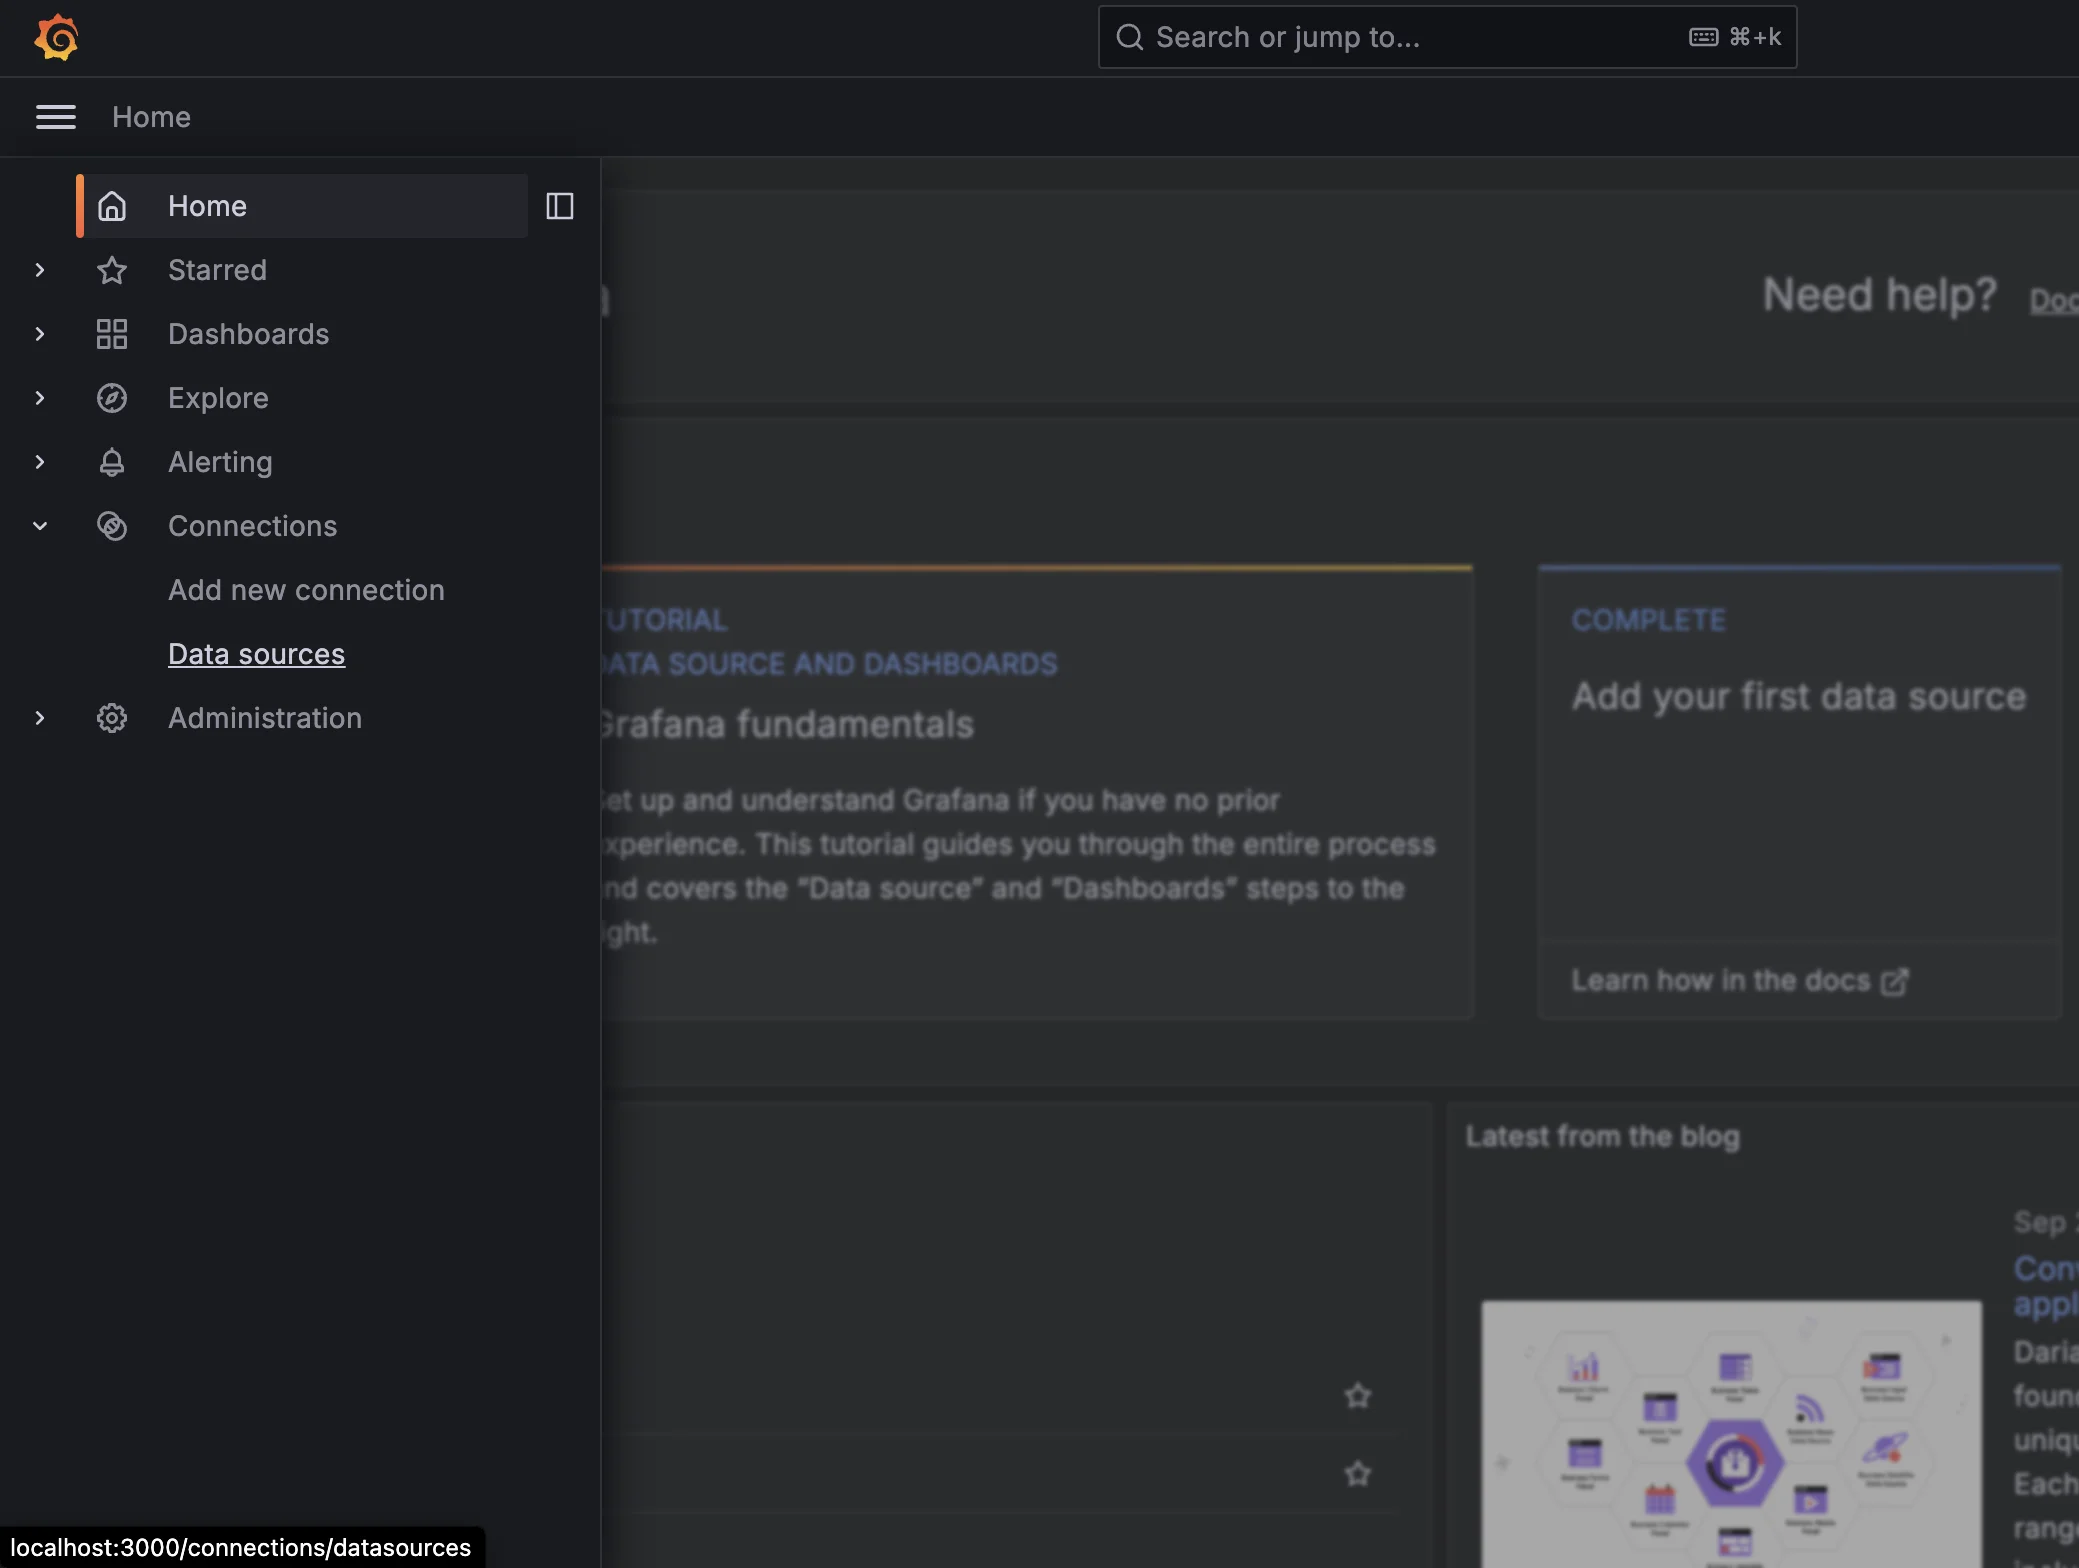
From the left-hand menu, click Configuration, then select Data Sources.
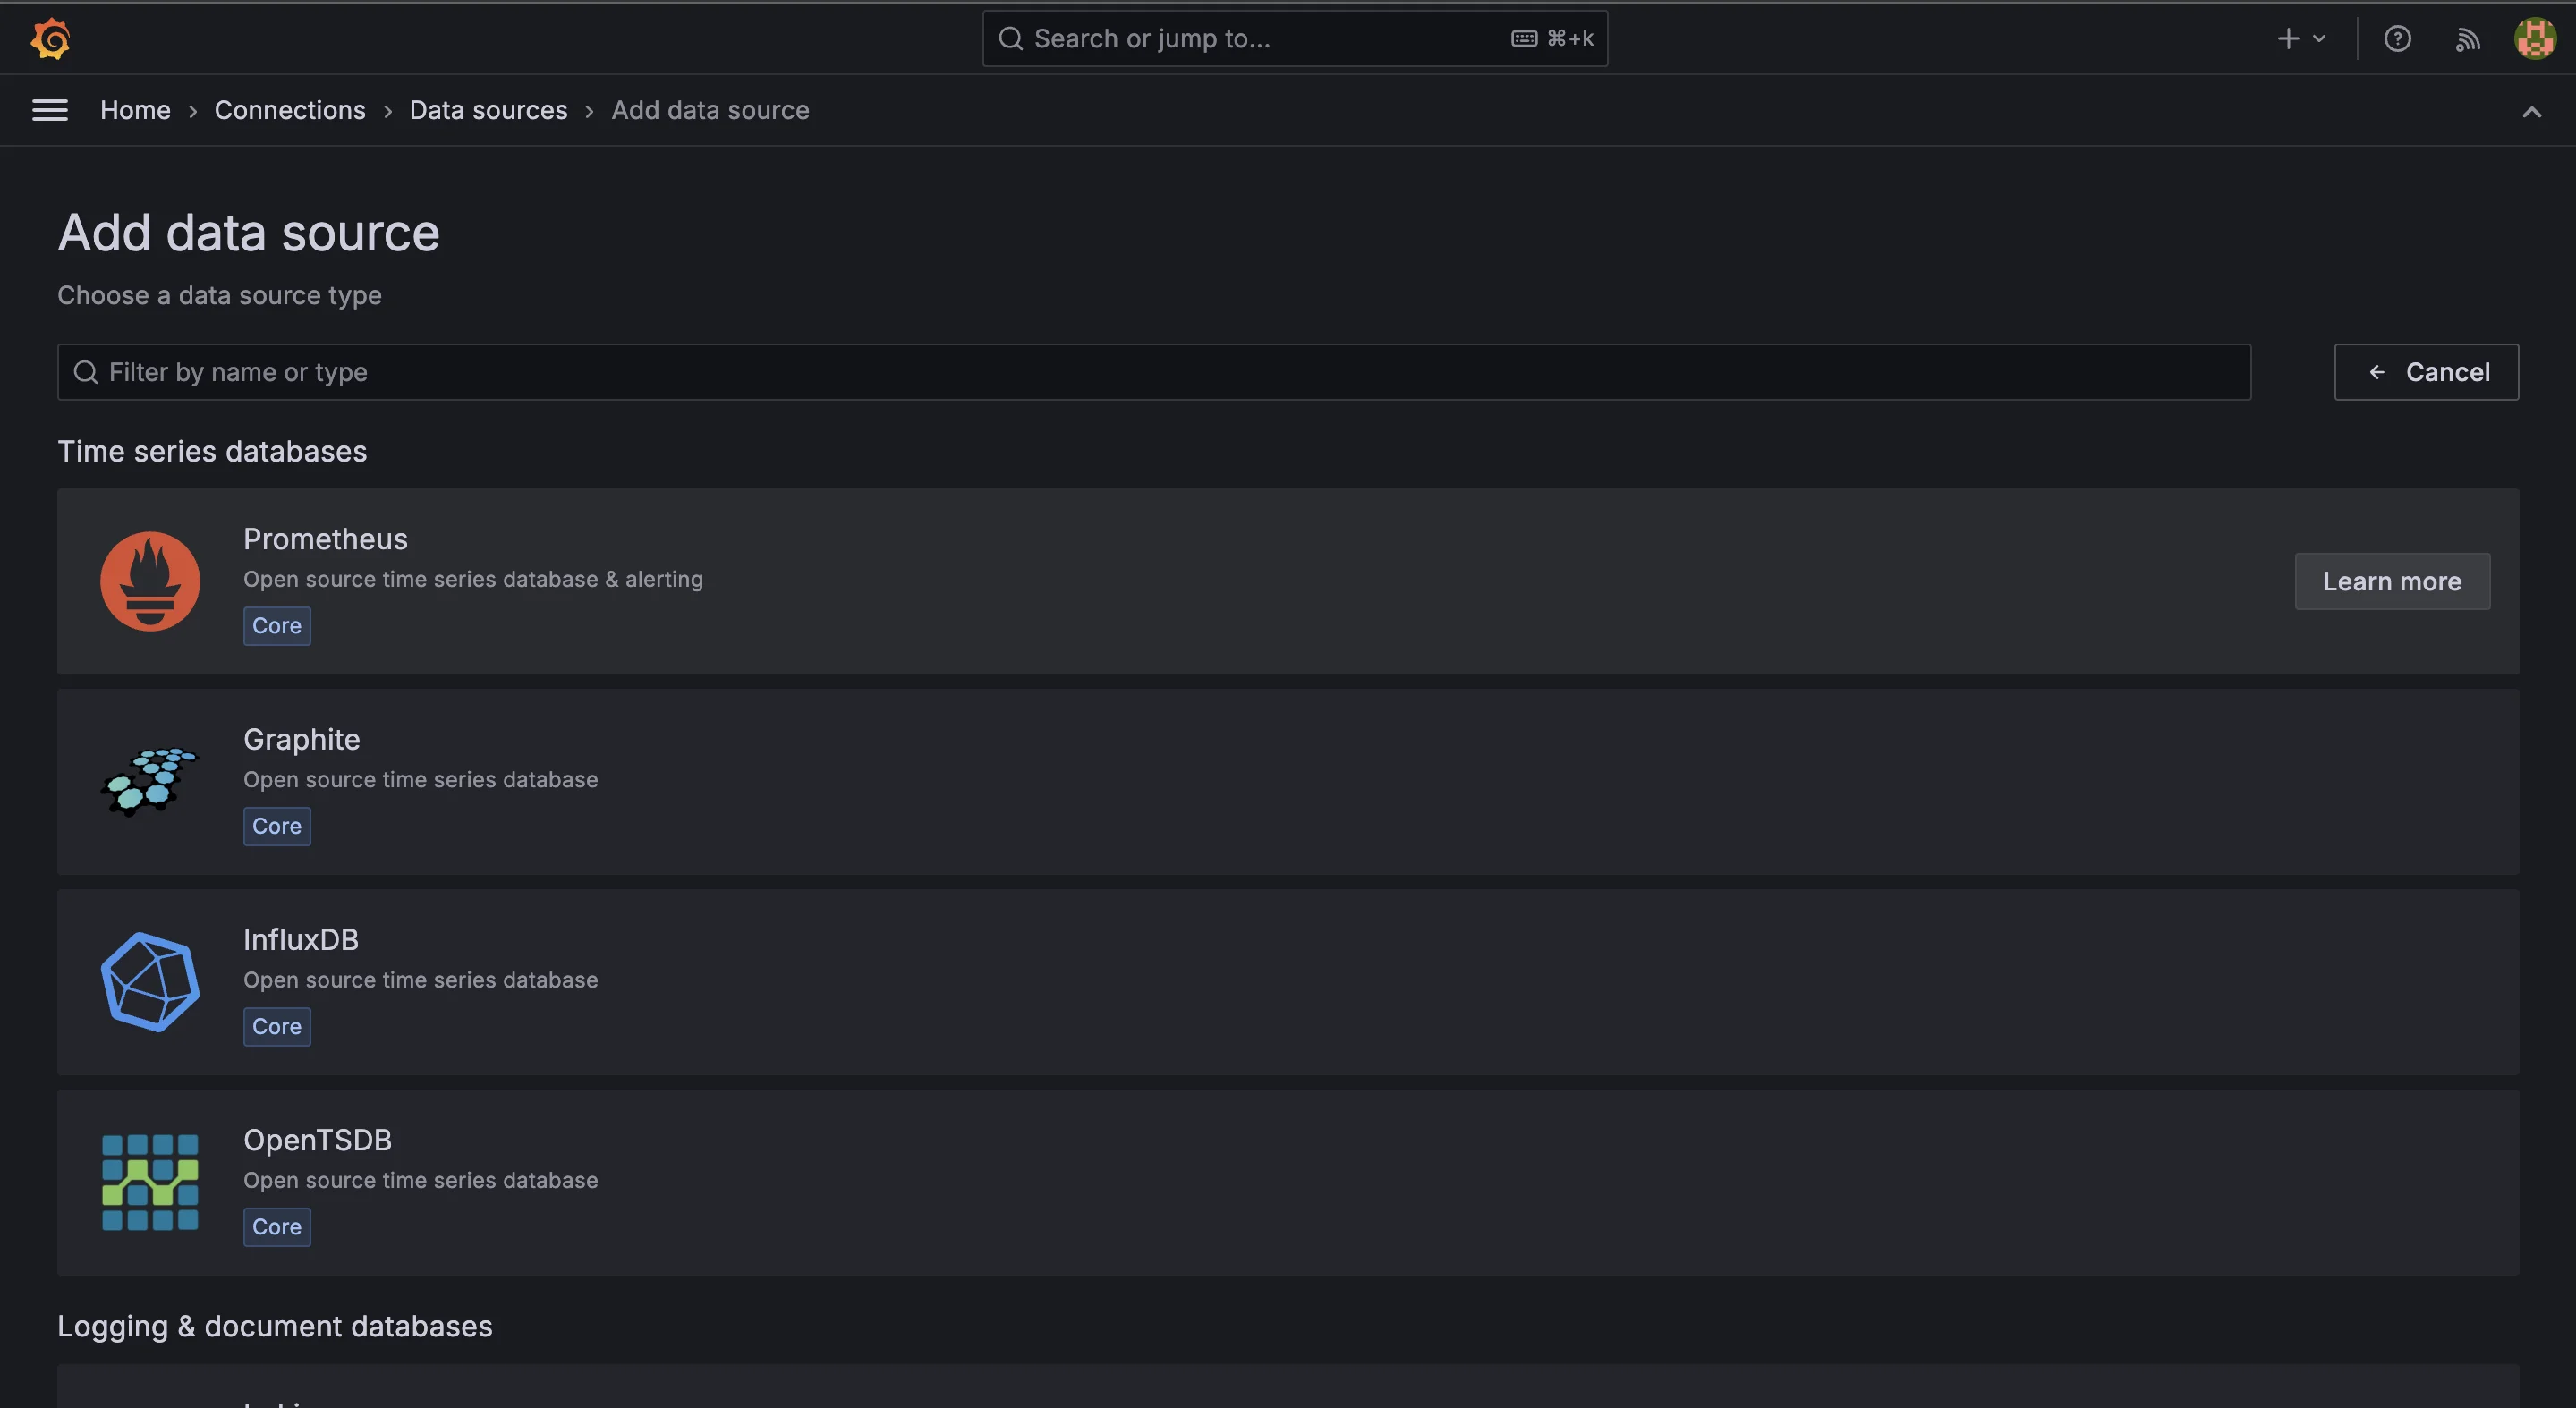
Add data source Click Add data source, then choose Prometheus from the list.
Add Prometheus as data source Enter the URL where Prometheus is running (e.g.,
http://localhost:9090).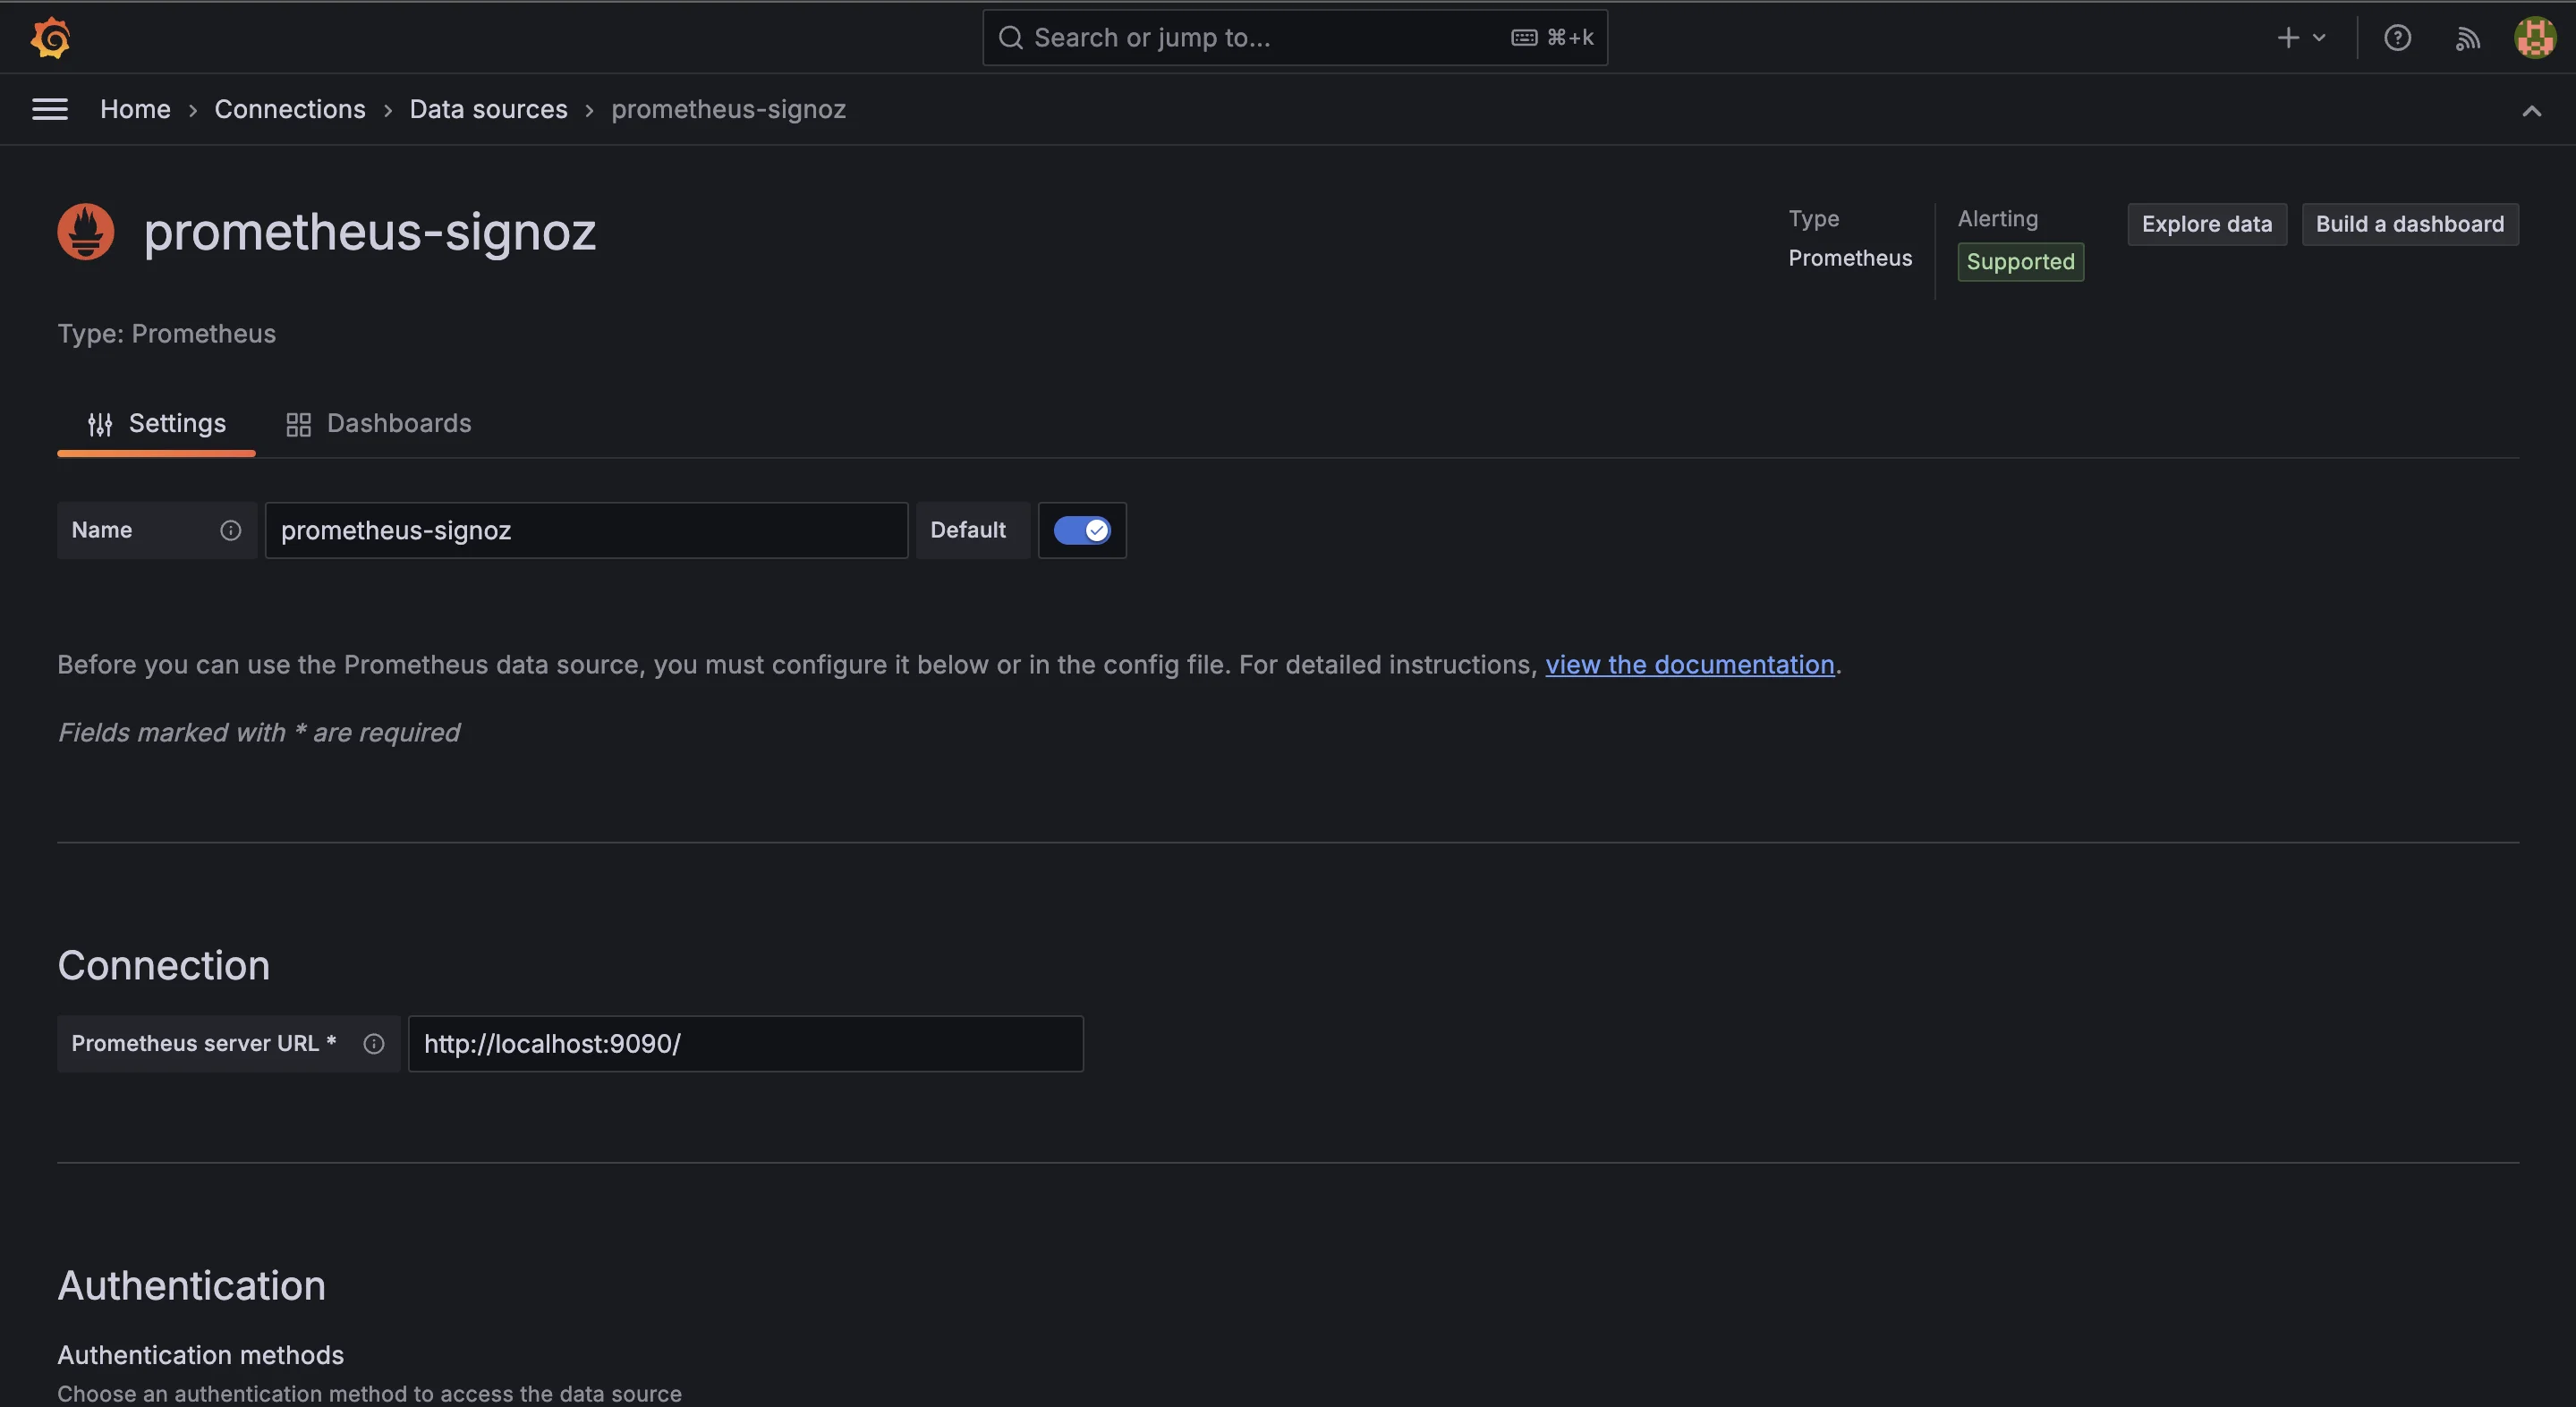
Prometheus data source page Save the Configuration
Click Save & Test to verify that Grafana can successfully connect to Prometheus.

Prometheus successfully connected with Grafana
Tips for Ensuring Proper Integration Between Your Application, Prometheus, and Grafana
Integrating Prometheus and Grafana with your application can significantly enhance your monitoring and observability capabilities. To ensure a seamless experience, consider the following best practices:
- Use Clear Metric Names Always give your metrics meaningful names, so it’s easy to understand what they measure. For example, instead of using
request_count, usehttp_requests_totalfor clarity. - Make the Most of Labels Labels help categorize and filter your data. Use them to add context like status codes (
status_code="200") or response times. This makes analysis in Grafana easier. - Set the Right Scraping Interval Adjust how often Prometheus collects data based on your app’s traffic. A typical interval is 15 seconds, but don’t set it too low, or it might slow down your system.
- Check Your Metrics Endpoint Before launching, use tools like
curlor Postman to ensure your app’s metrics endpoint works and displays data in Prometheus format. Catching issues early can save you headaches later. - Keep an Eye on Prometheus’ Performance As your app grows, Prometheus might get bogged down. Monitor its CPU, memory, and disk usage, and adjust settings like retention periods if needed.
- Document Everything Keep notes on what each metric means, either in your code or a separate file. This helps everyone on your team understand your monitoring setup.
- Update Dashboards and Alerts Regularly check your Grafana dashboards and alerts to make sure they’re still relevant. Remove outdated metrics and add new ones as your app changes.
Creating a Dashboard for HTTP Requests per Minute
With Prometheus now scraping your application's metrics, follow these steps to create a Grafana dashboard to visualize HTTP requests per minute:
Create New Dashboard
In the left-hand menu, select Dashboards and click the Create dashboard button.
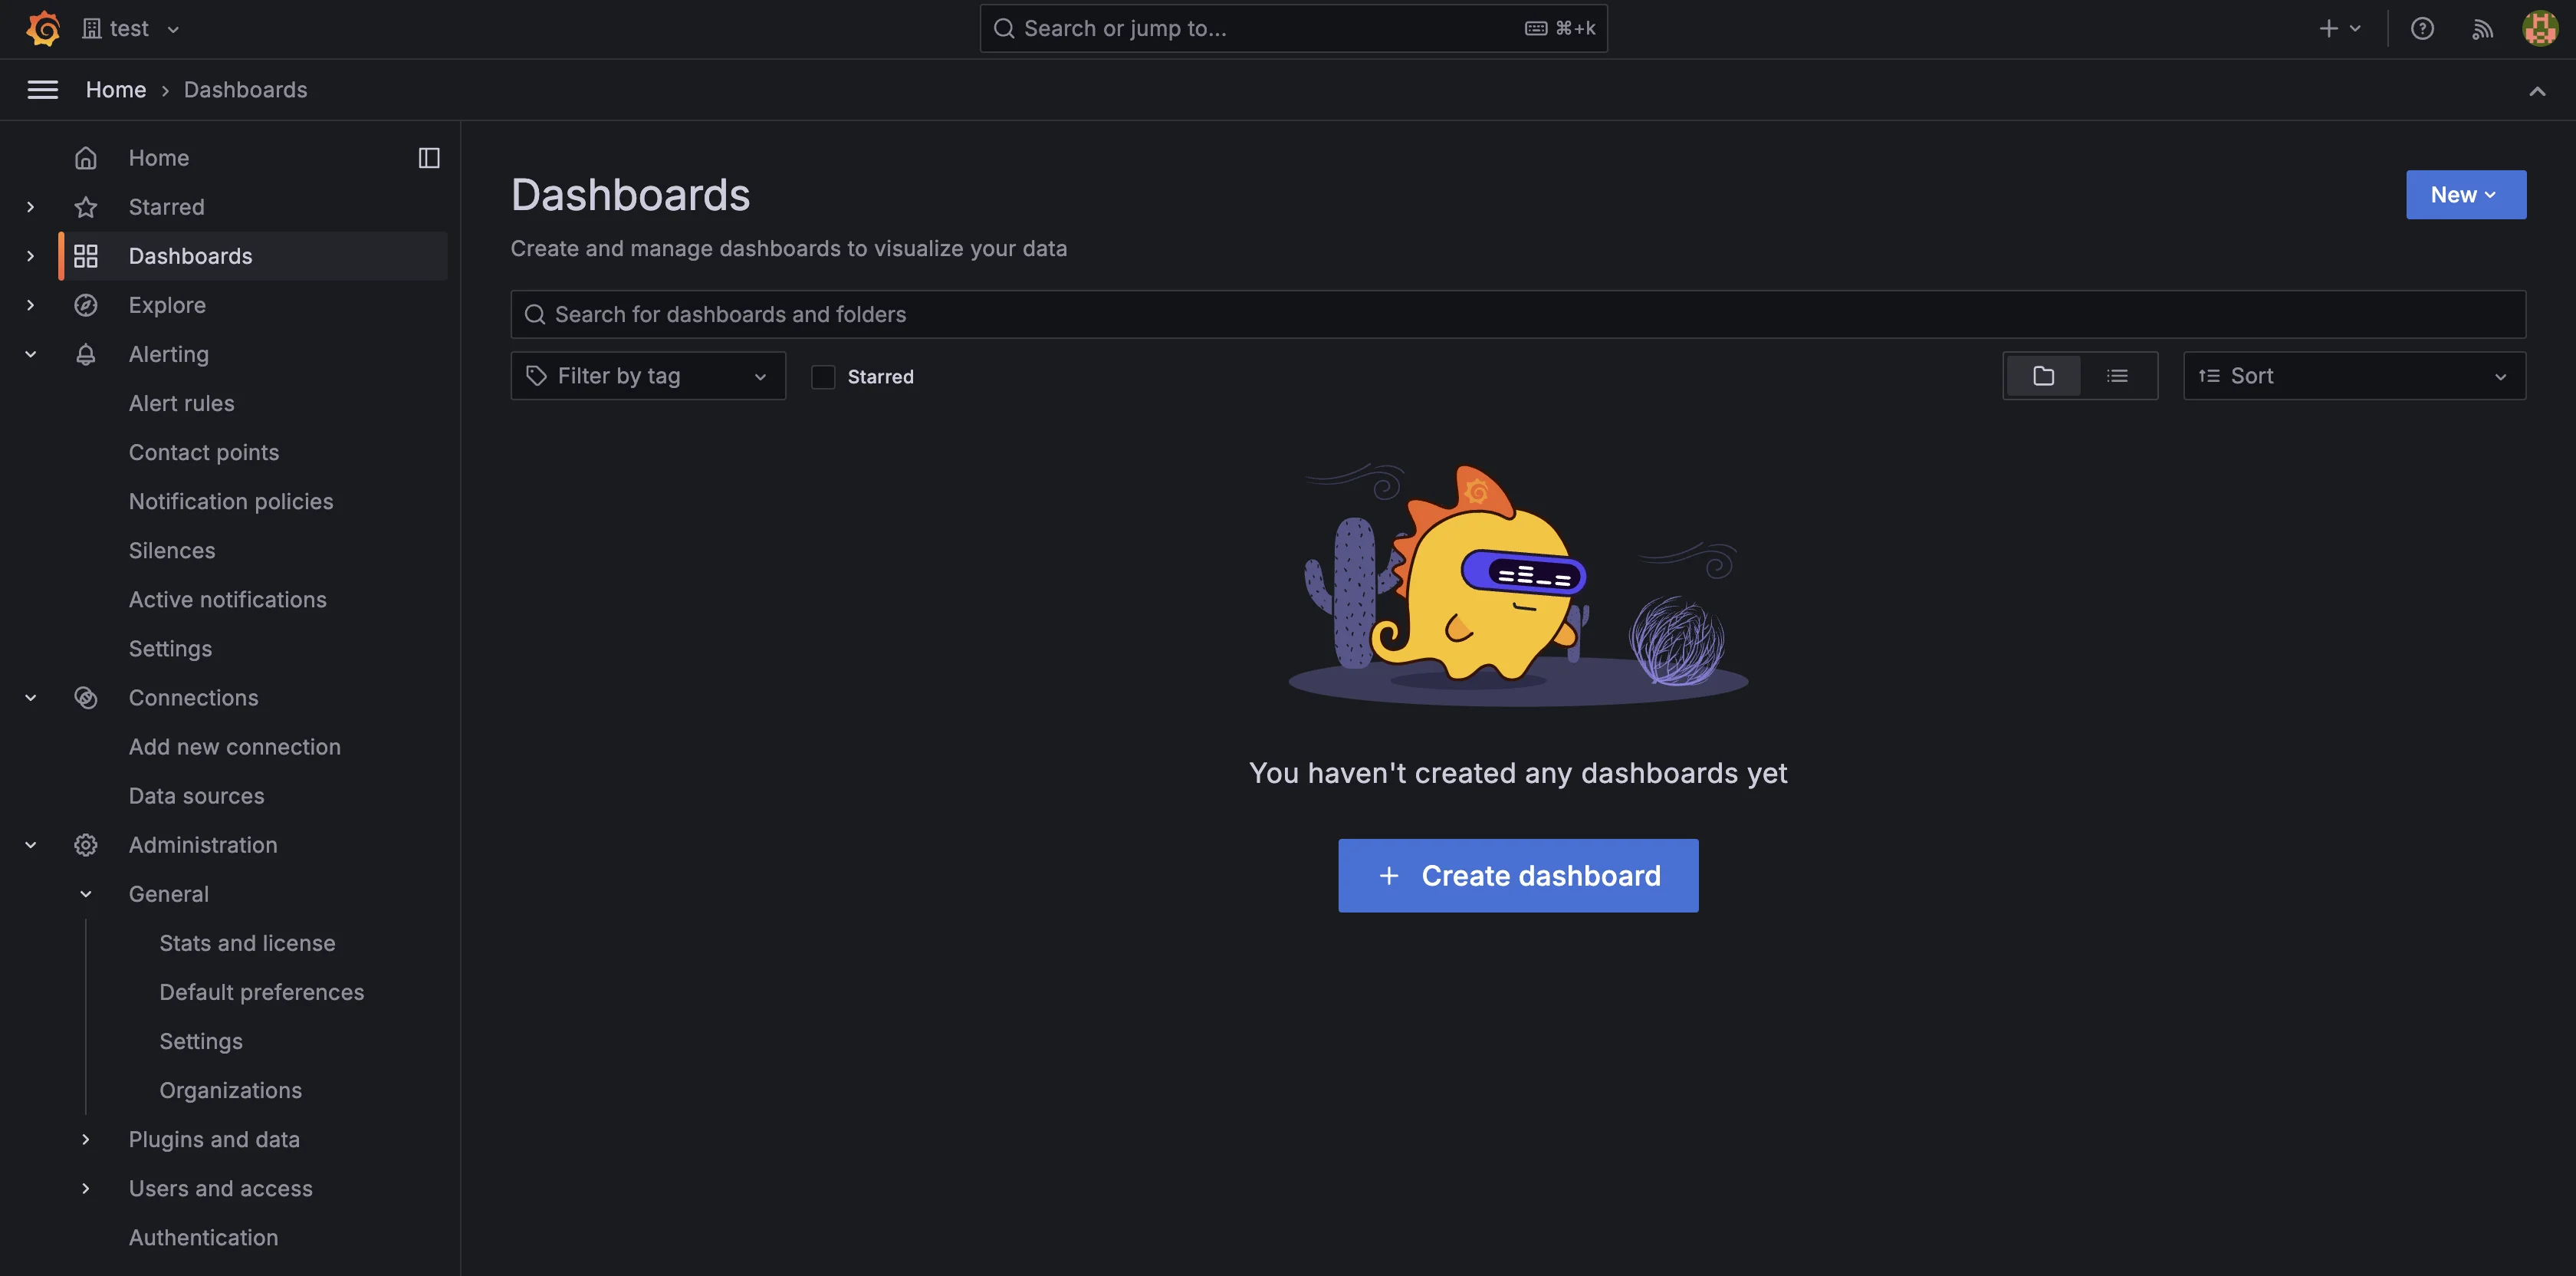
Create dashboard Click the Add visualization button
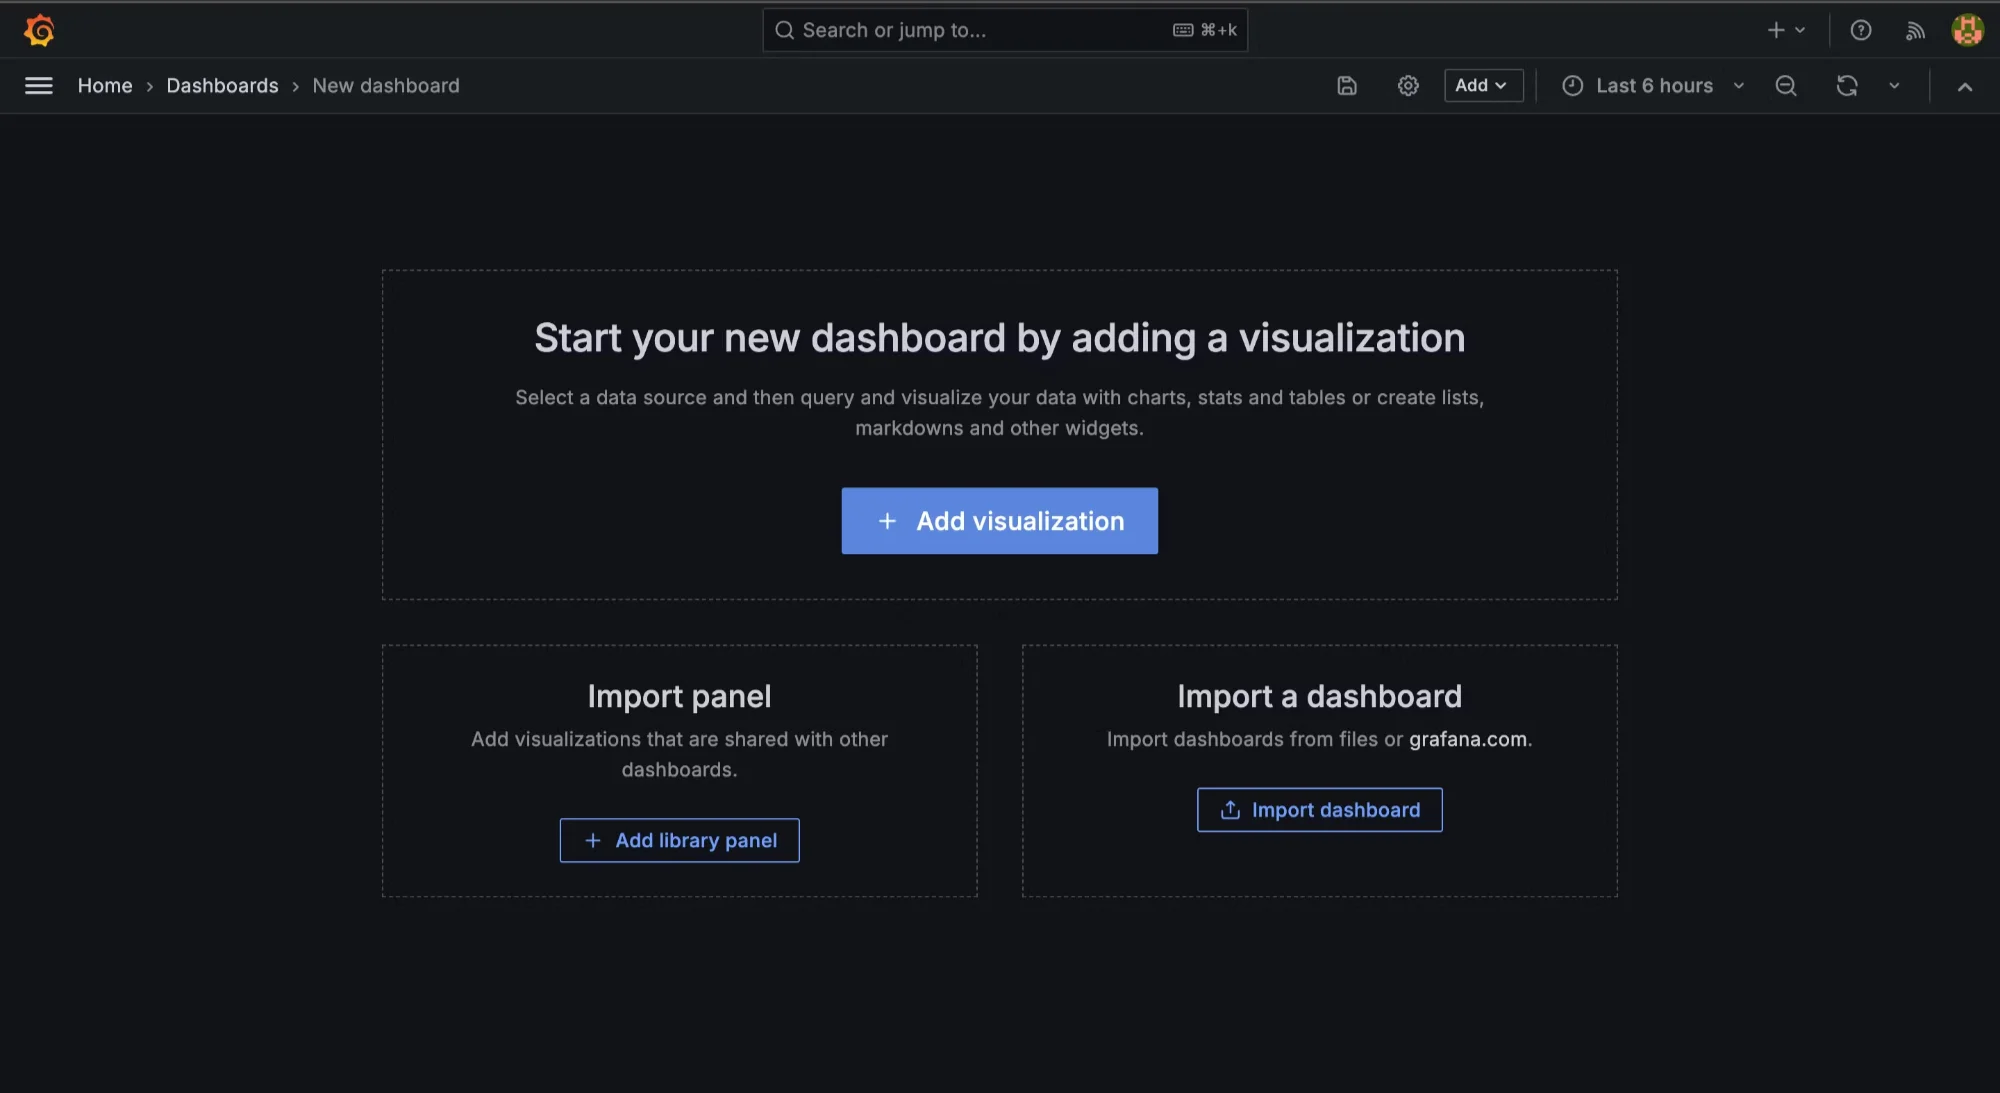
Adding visualization Select Prometheus as the data source
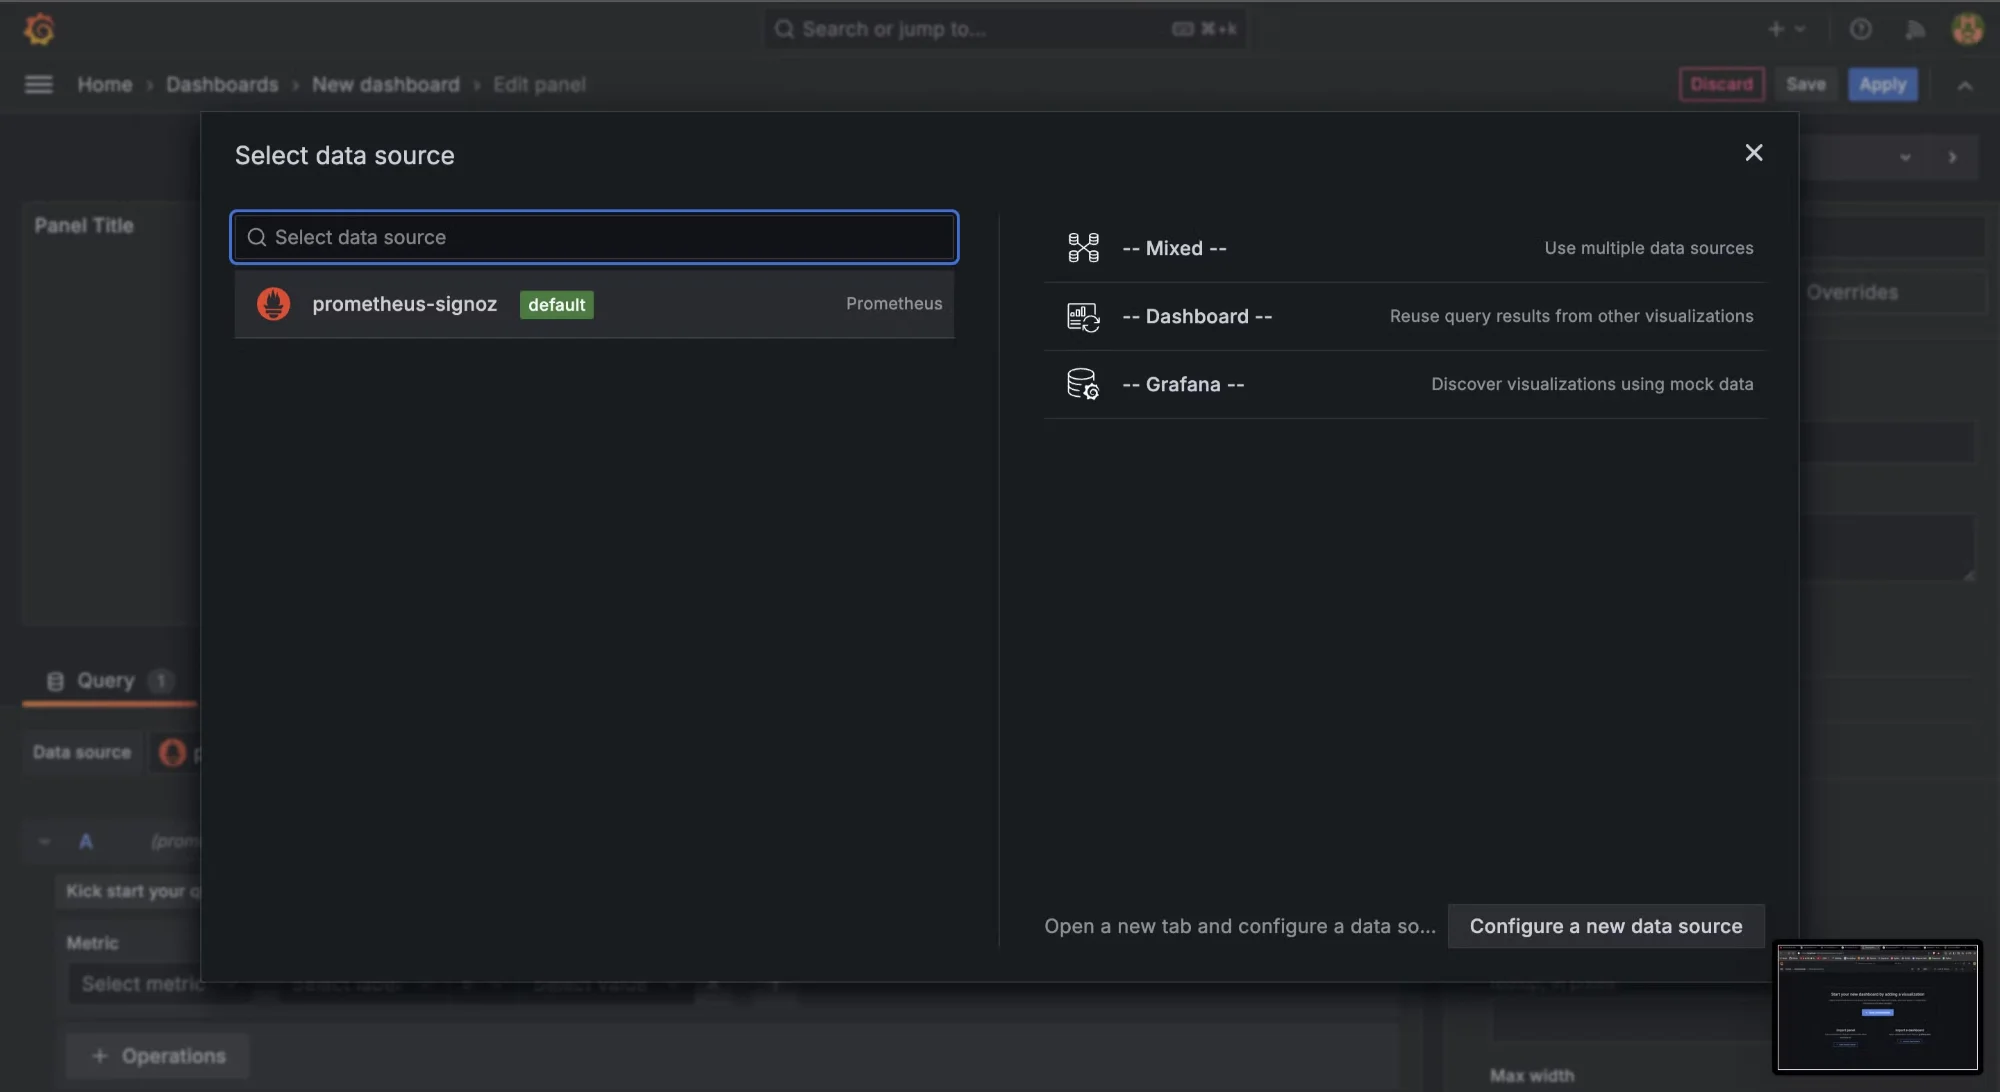
Select datasource Use PromQL to Run Queries
To query the HTTP request metrics from the application, in the panel's query editor, enter the following PromQL query to calculate the rate of HTTP requests over the last minute:
rate(http_server_requests_seconds_count{}[1m])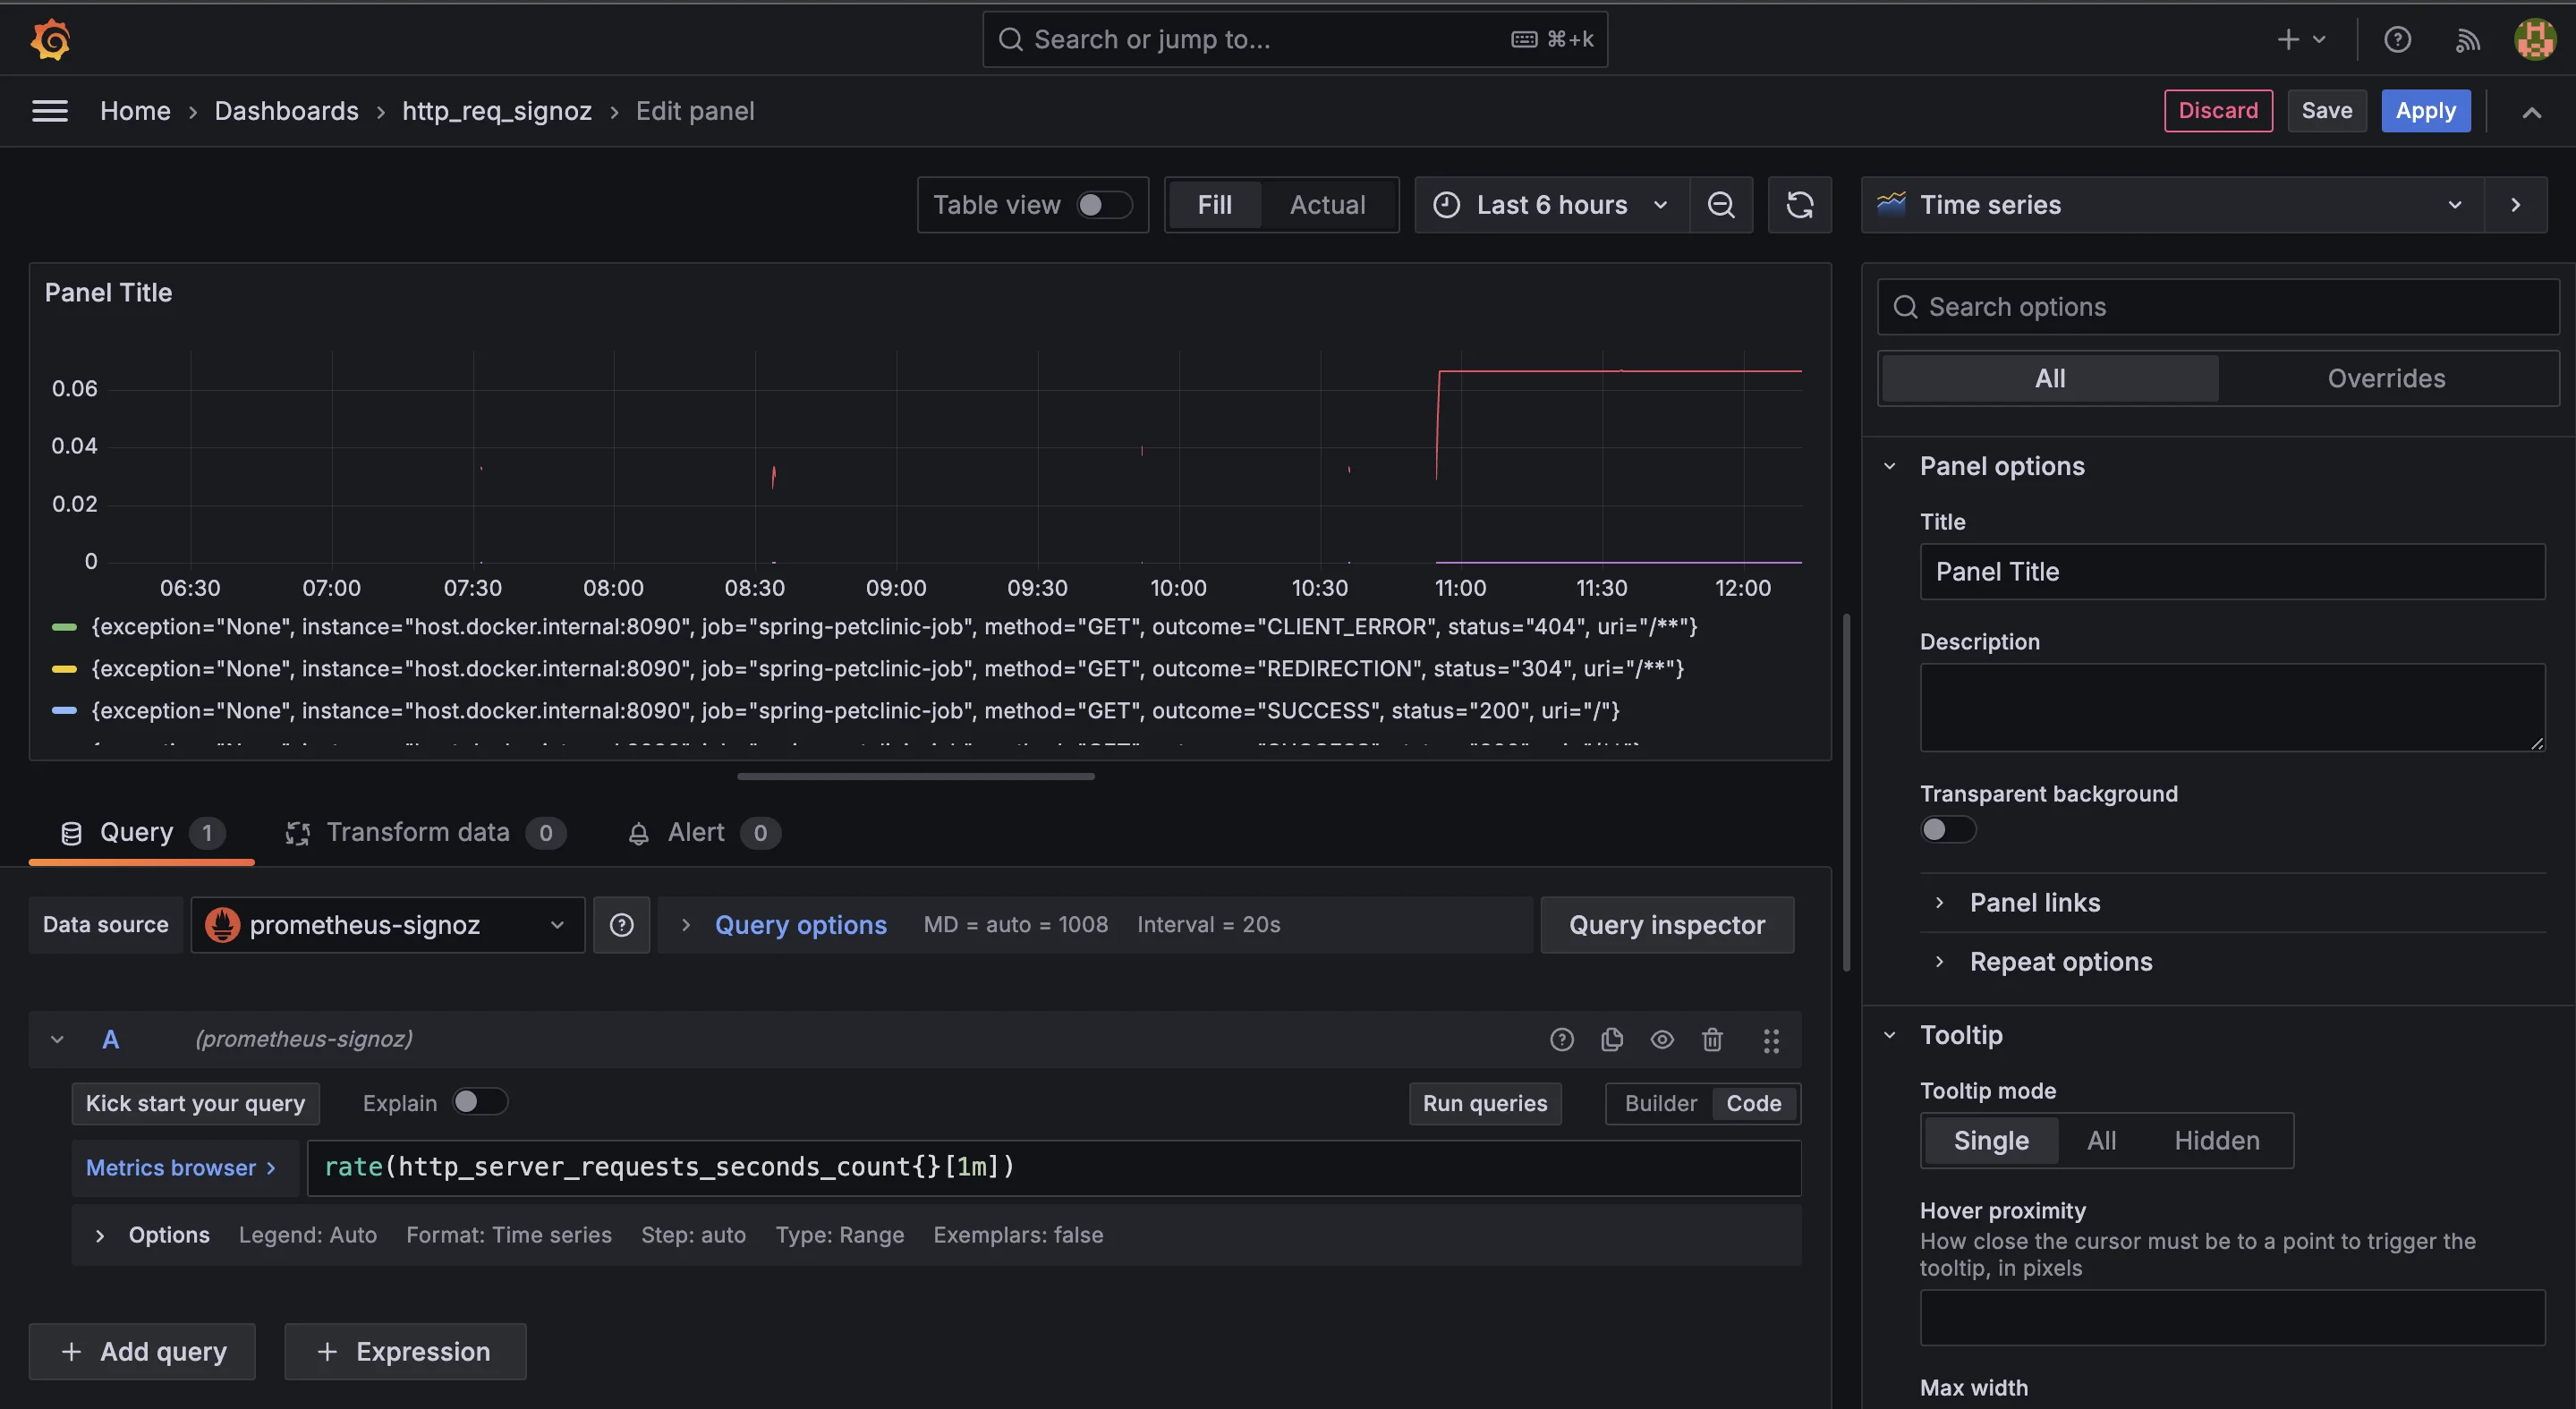
Querying HTTP request rate over the last minute This query retrieves the per-second rate of HTTP requests based on the
http_server_requests_seconds_countmetric. It calculates how many requests are happening every second, averaged over a one-minute window. This is useful for monitoring real-time traffic patterns and understanding how request volume changes over time.Set the Unit to Requests Per Minute After running the query, you’ll want to format the result to show requests per minute instead of per second. In the Panel settings on the right, scroll to the Standard options section. Here, you can set the Unit dropdown to display the rate in seconds, which represents the requests per second.
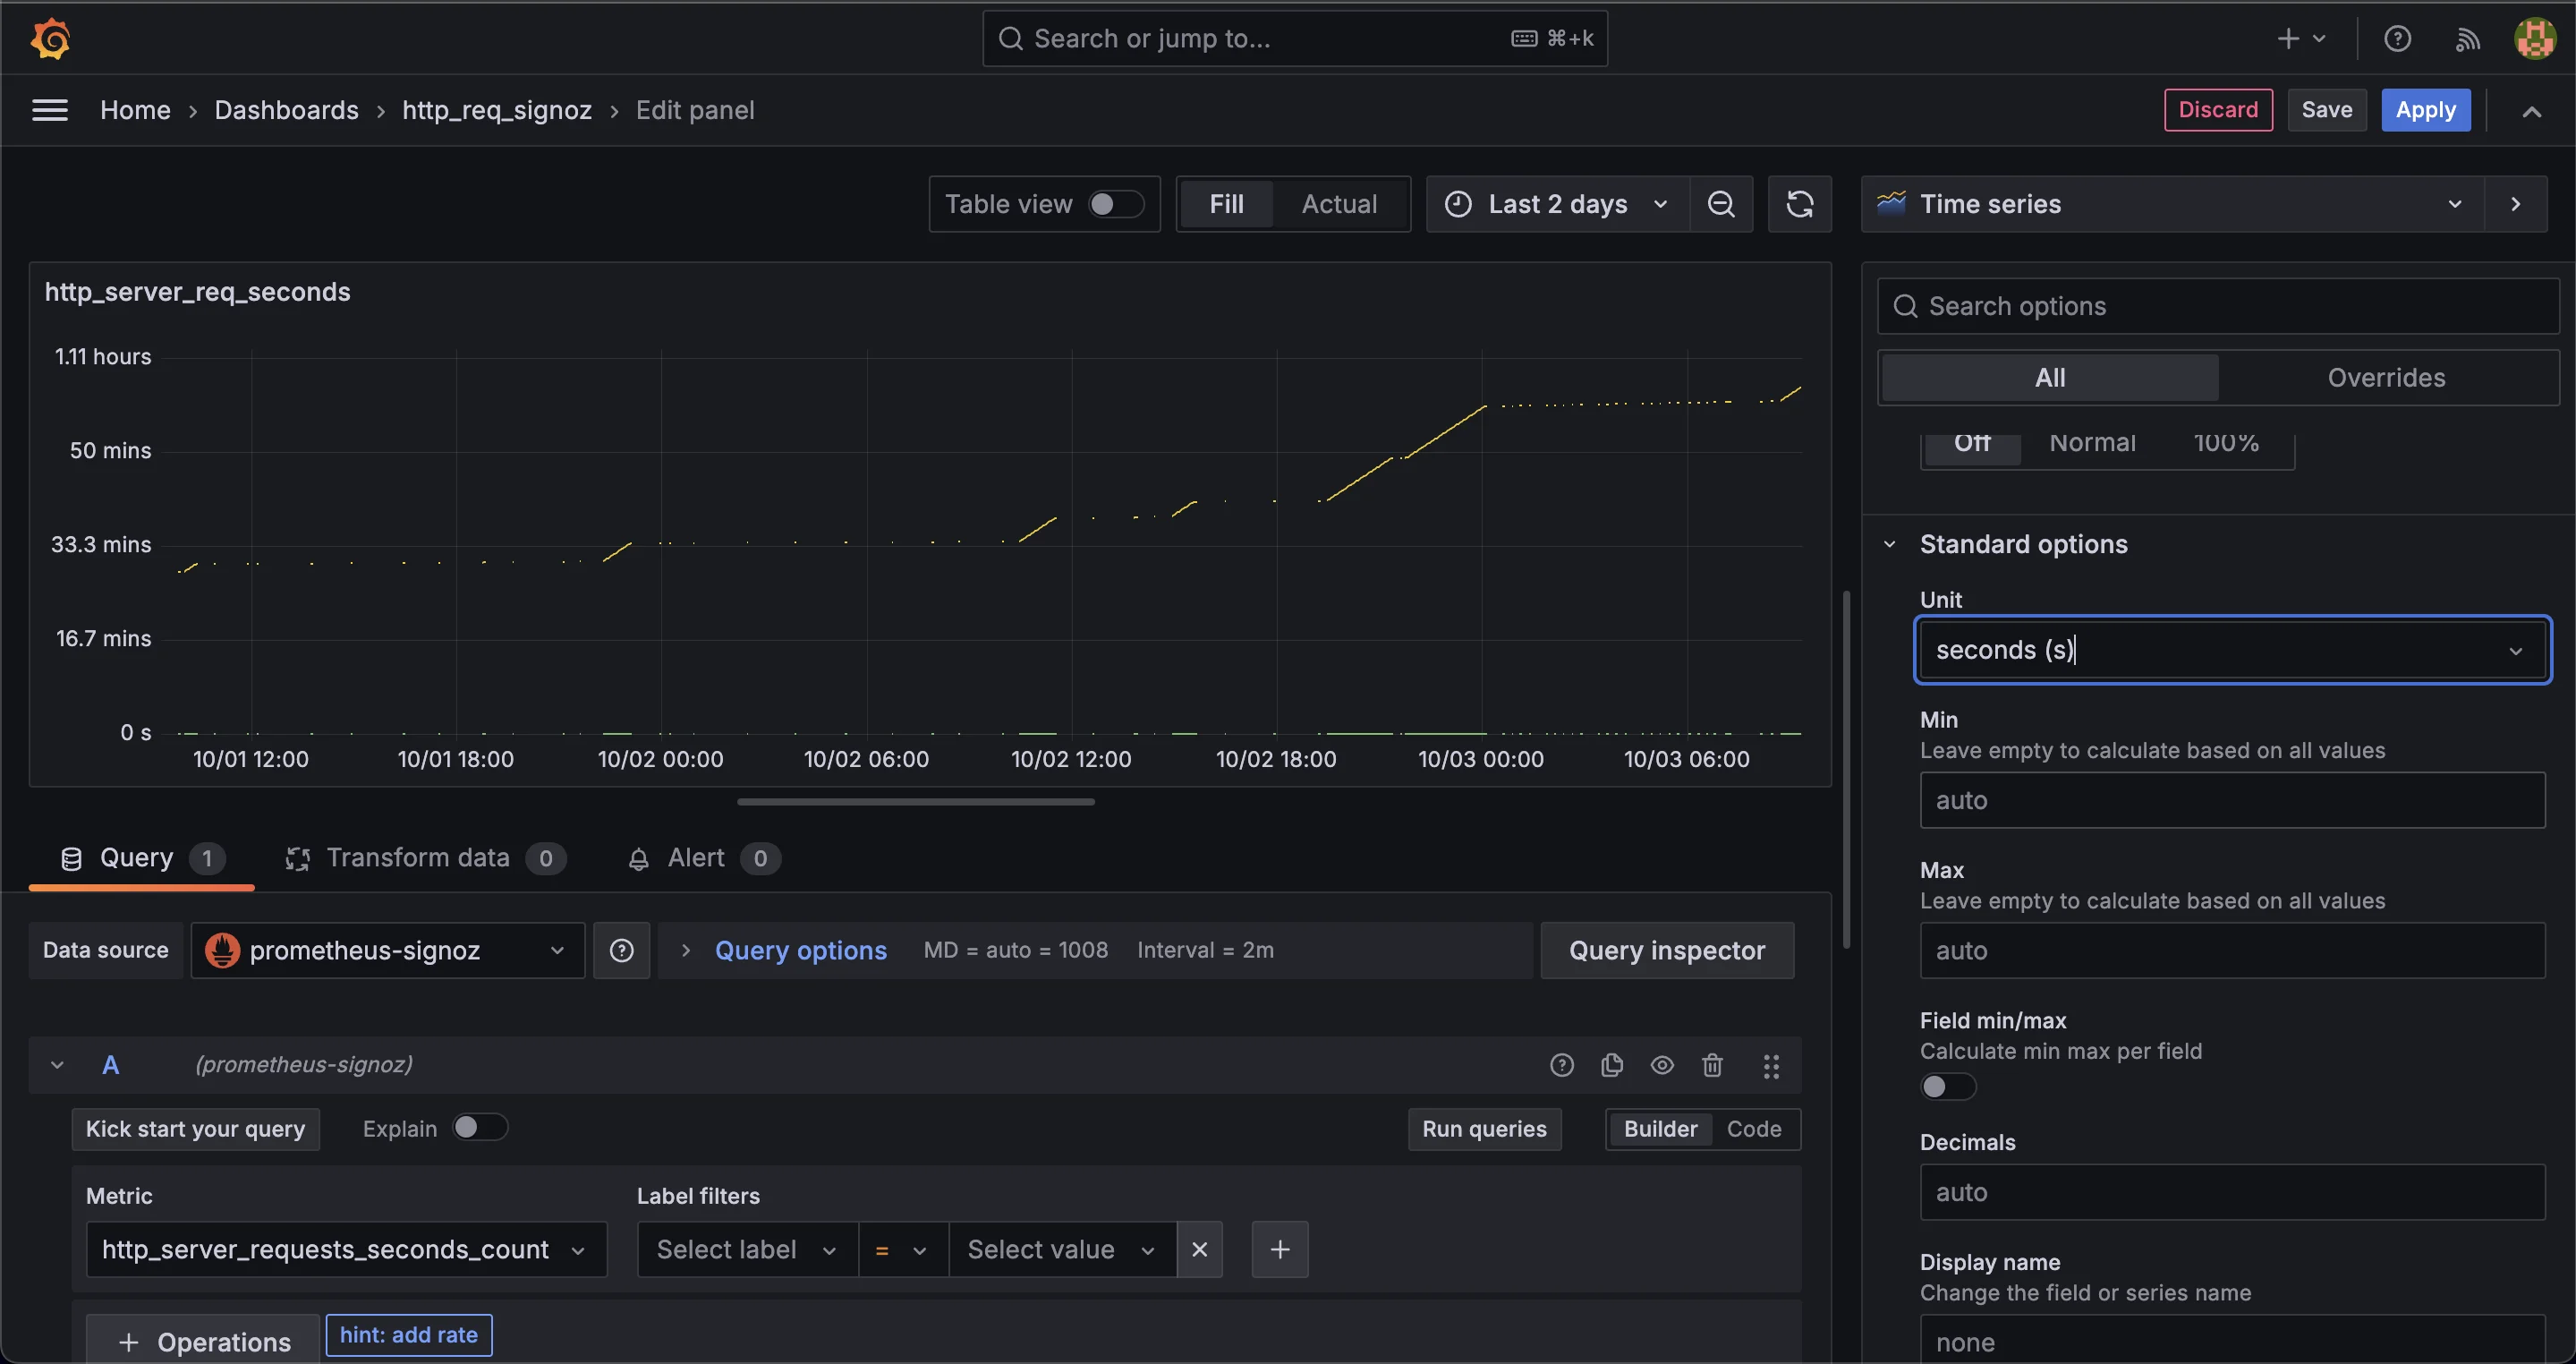
Unit response set to seconds Since Grafana doesn’t have a built-in option to display requests per minute, you will need to manually convert the per-second rate by multiplying it by 60, which leads us to the next step.
Multiply by 60:
To calculate requests per minute, modify your query to multiply the per-second rate by 60. This will convert the requests-per-second data into requests-per-minute. Update your PromQL query like this:
rate(http_server_requests_seconds_count[1m]) * 60This adjusted query takes the per-second rate over the last minute and multiplies it by 60 to show the total number of requests made each minute.
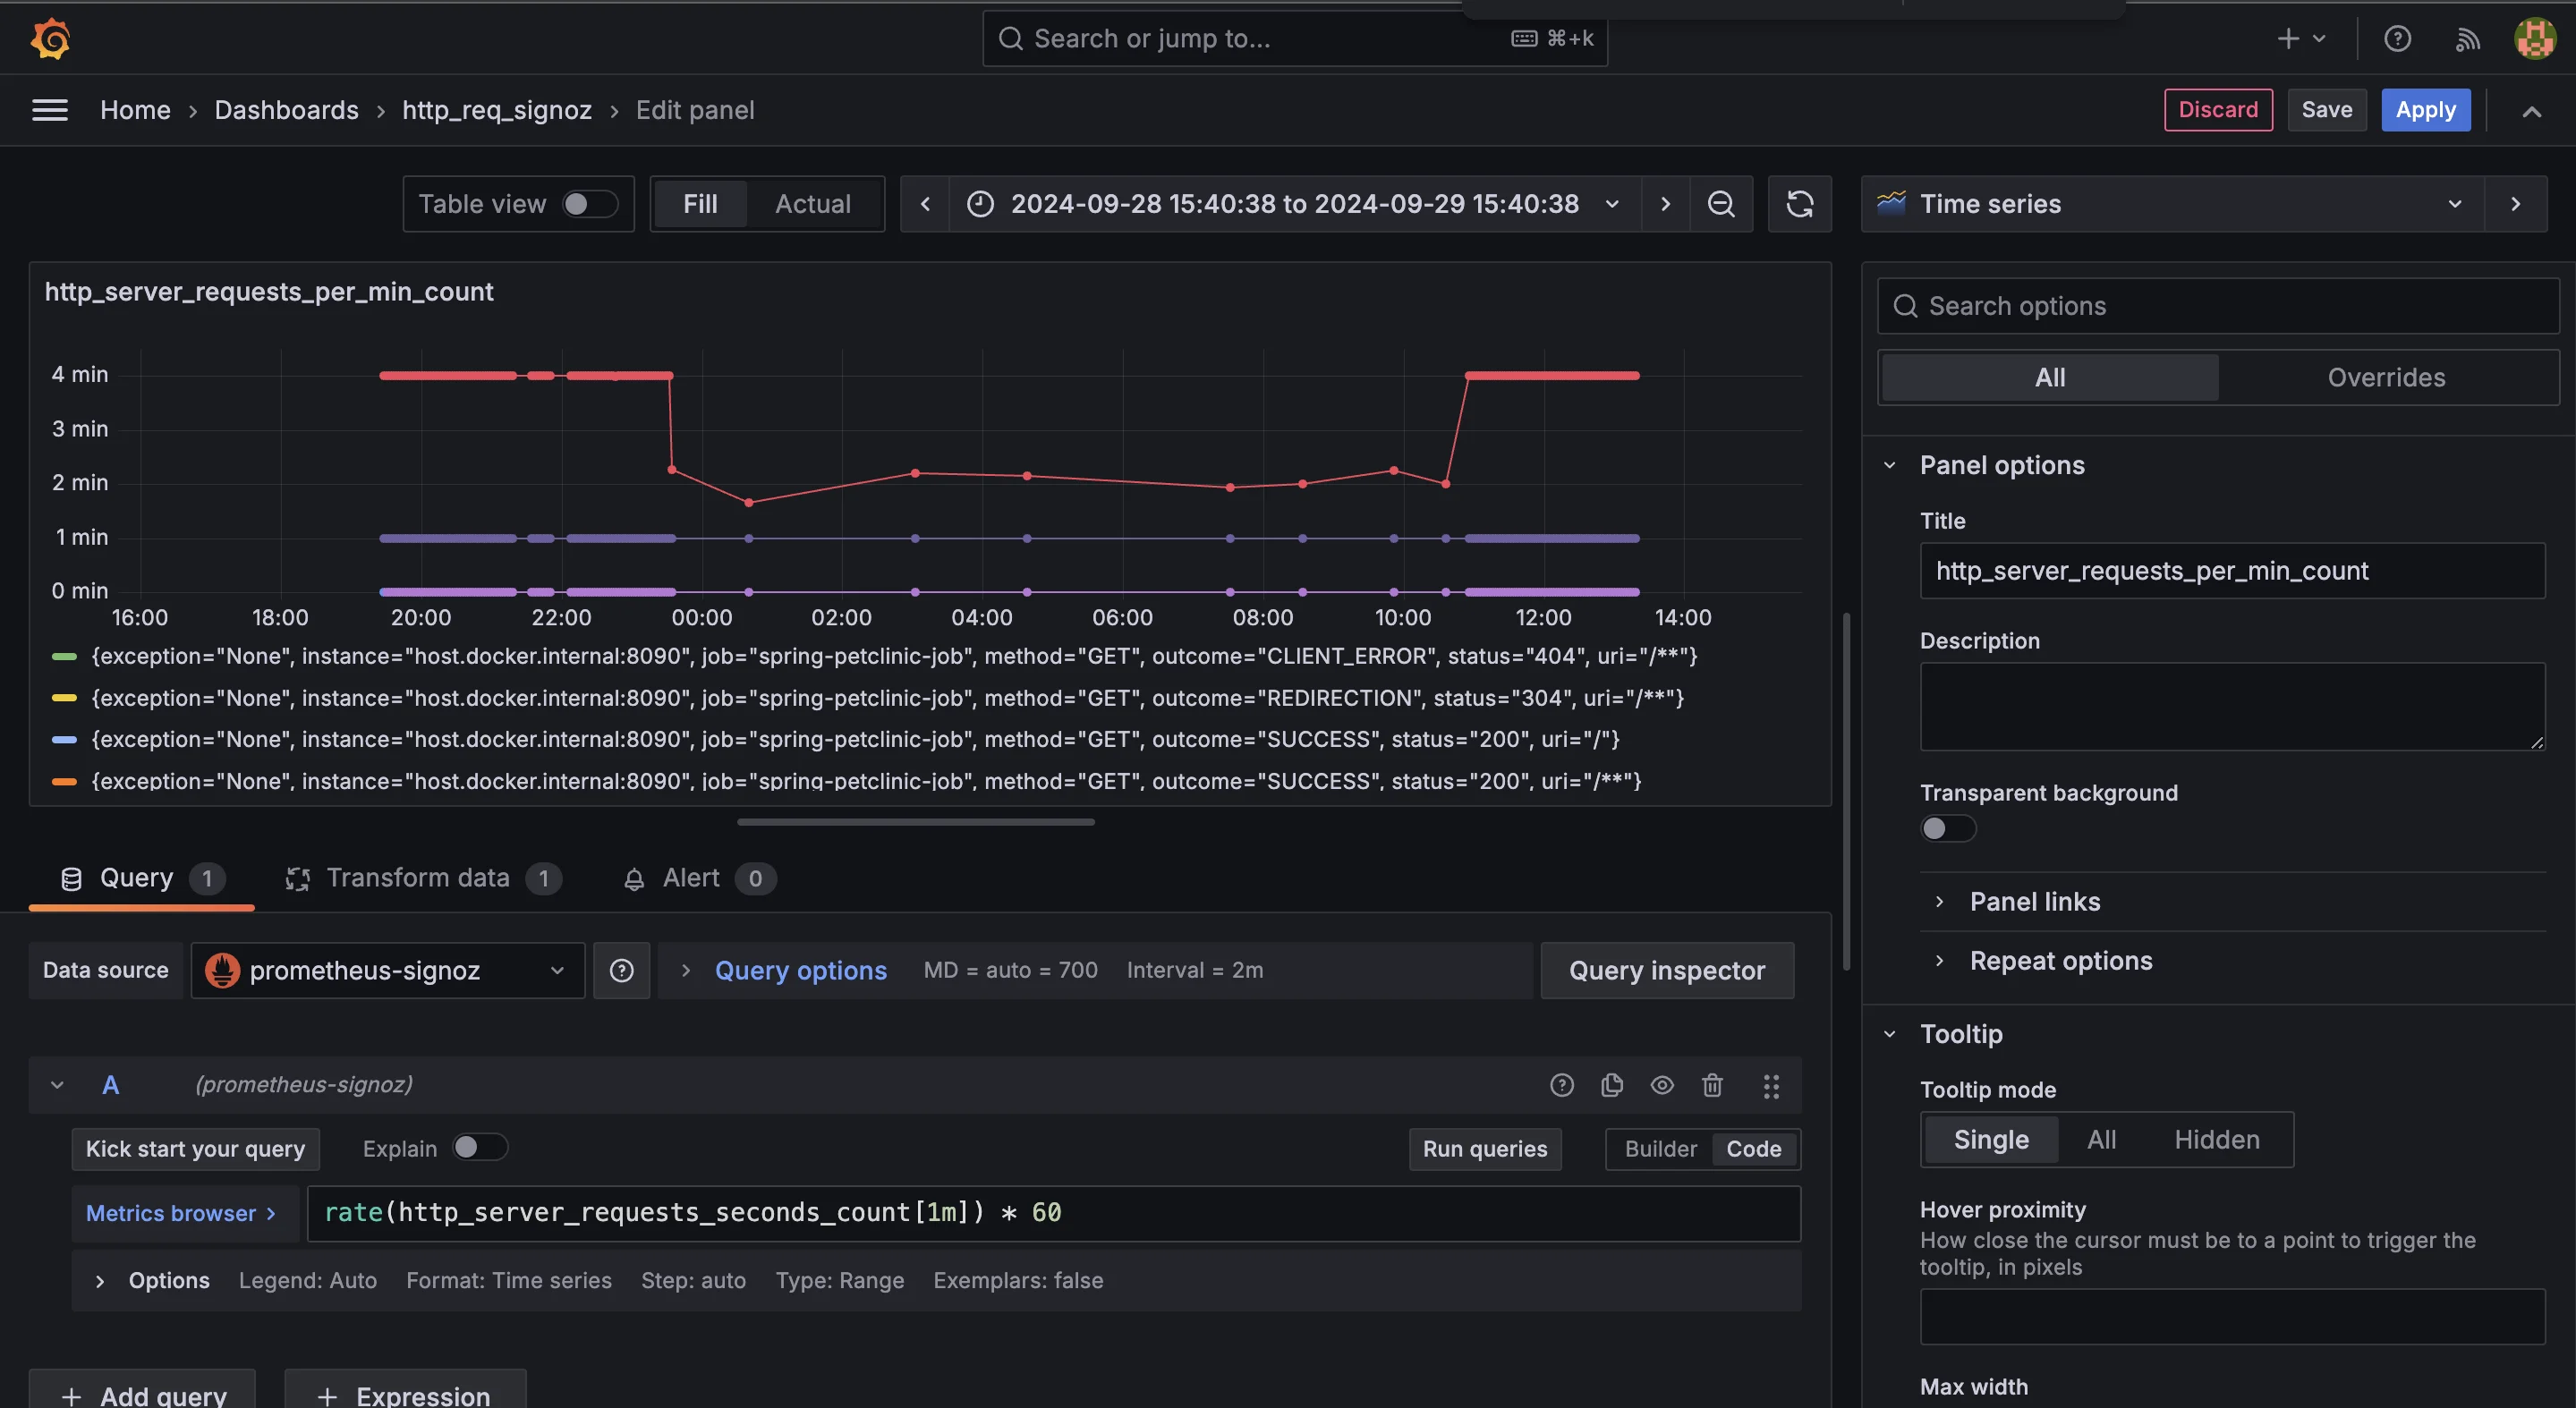
http_server_requests_seconds_count dashboard Customize the Panel To improve the readability and relevance of your dashboard, it's helpful to customize the panel:
Set the panel title: In the General tab, rename the panel to something more descriptive, such as "
HTTP Requests per Minute." This makes it easier to understand the panel’s purpose at a glance.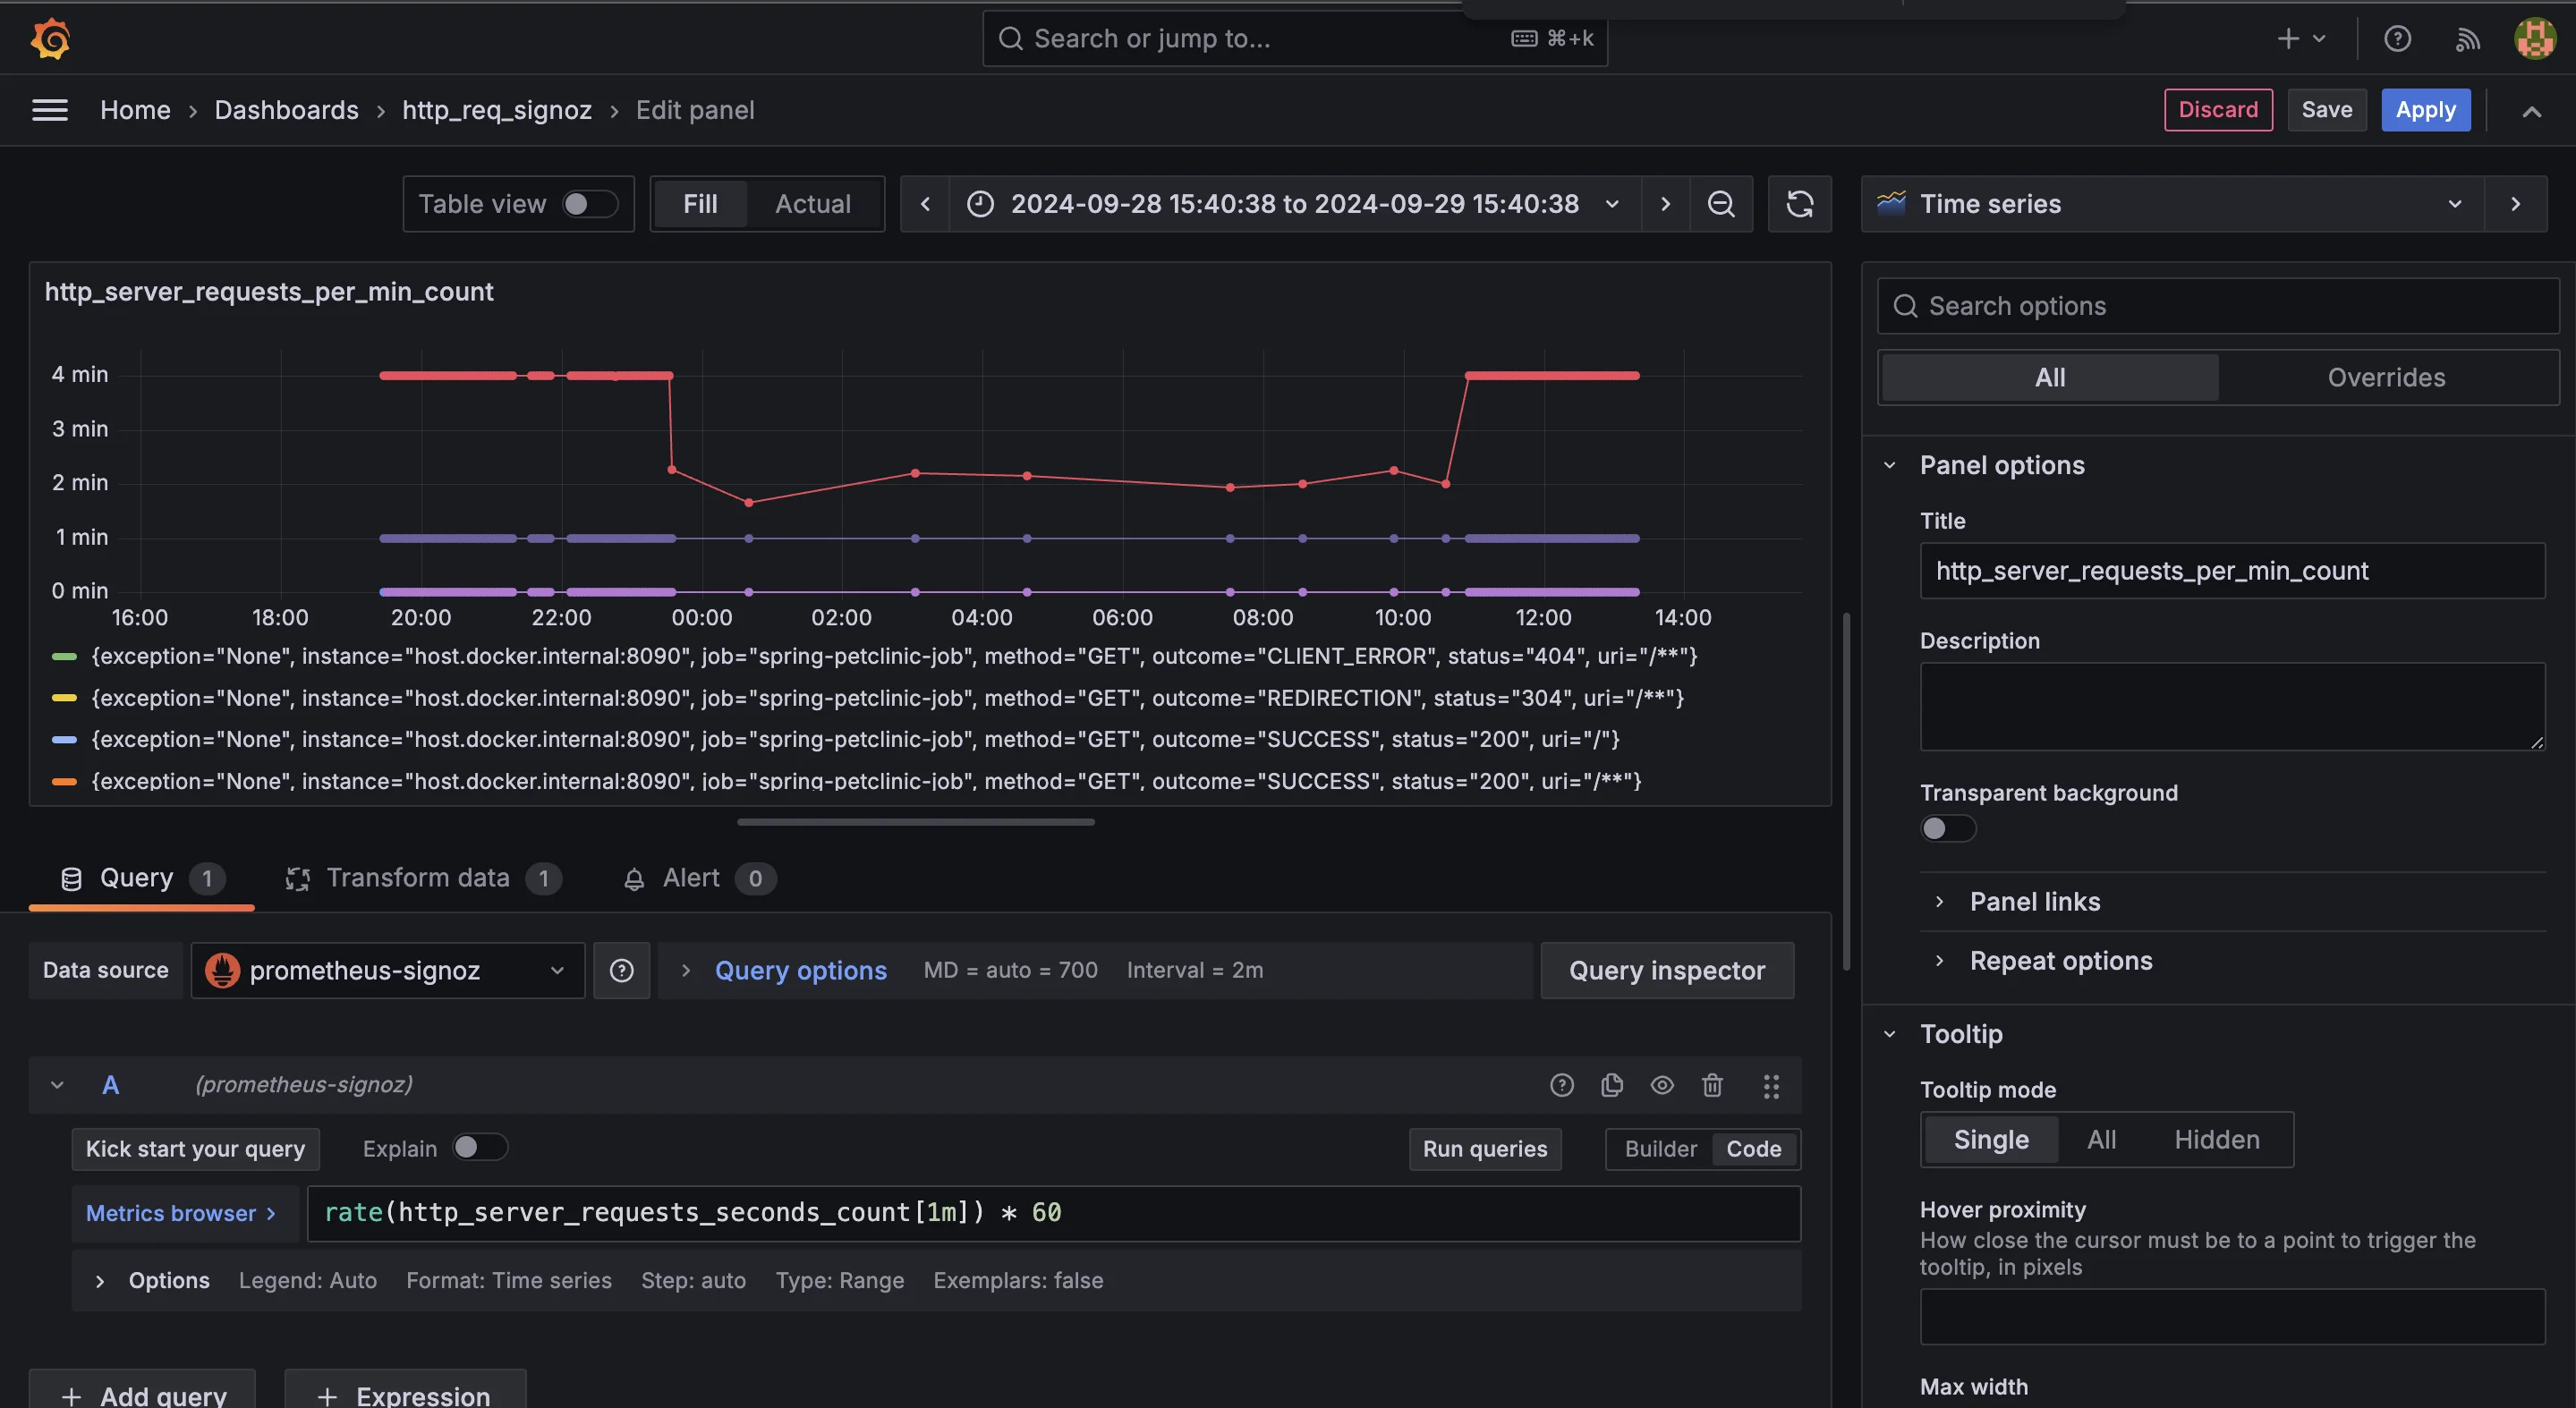
changing the name of the panel tile Customize as per needs: You can configure the Y-axis to automatically adjust to the scale of incoming request rates or set a custom range based on your expected traffic volume. In the Display settings, you can also fine-tune the legend to provide more context about the data shown on the dashboard.
Apply the changes: Once you’ve customized the panel to meet your needs, click Apply to save your settings and add the panel to the dashboard.
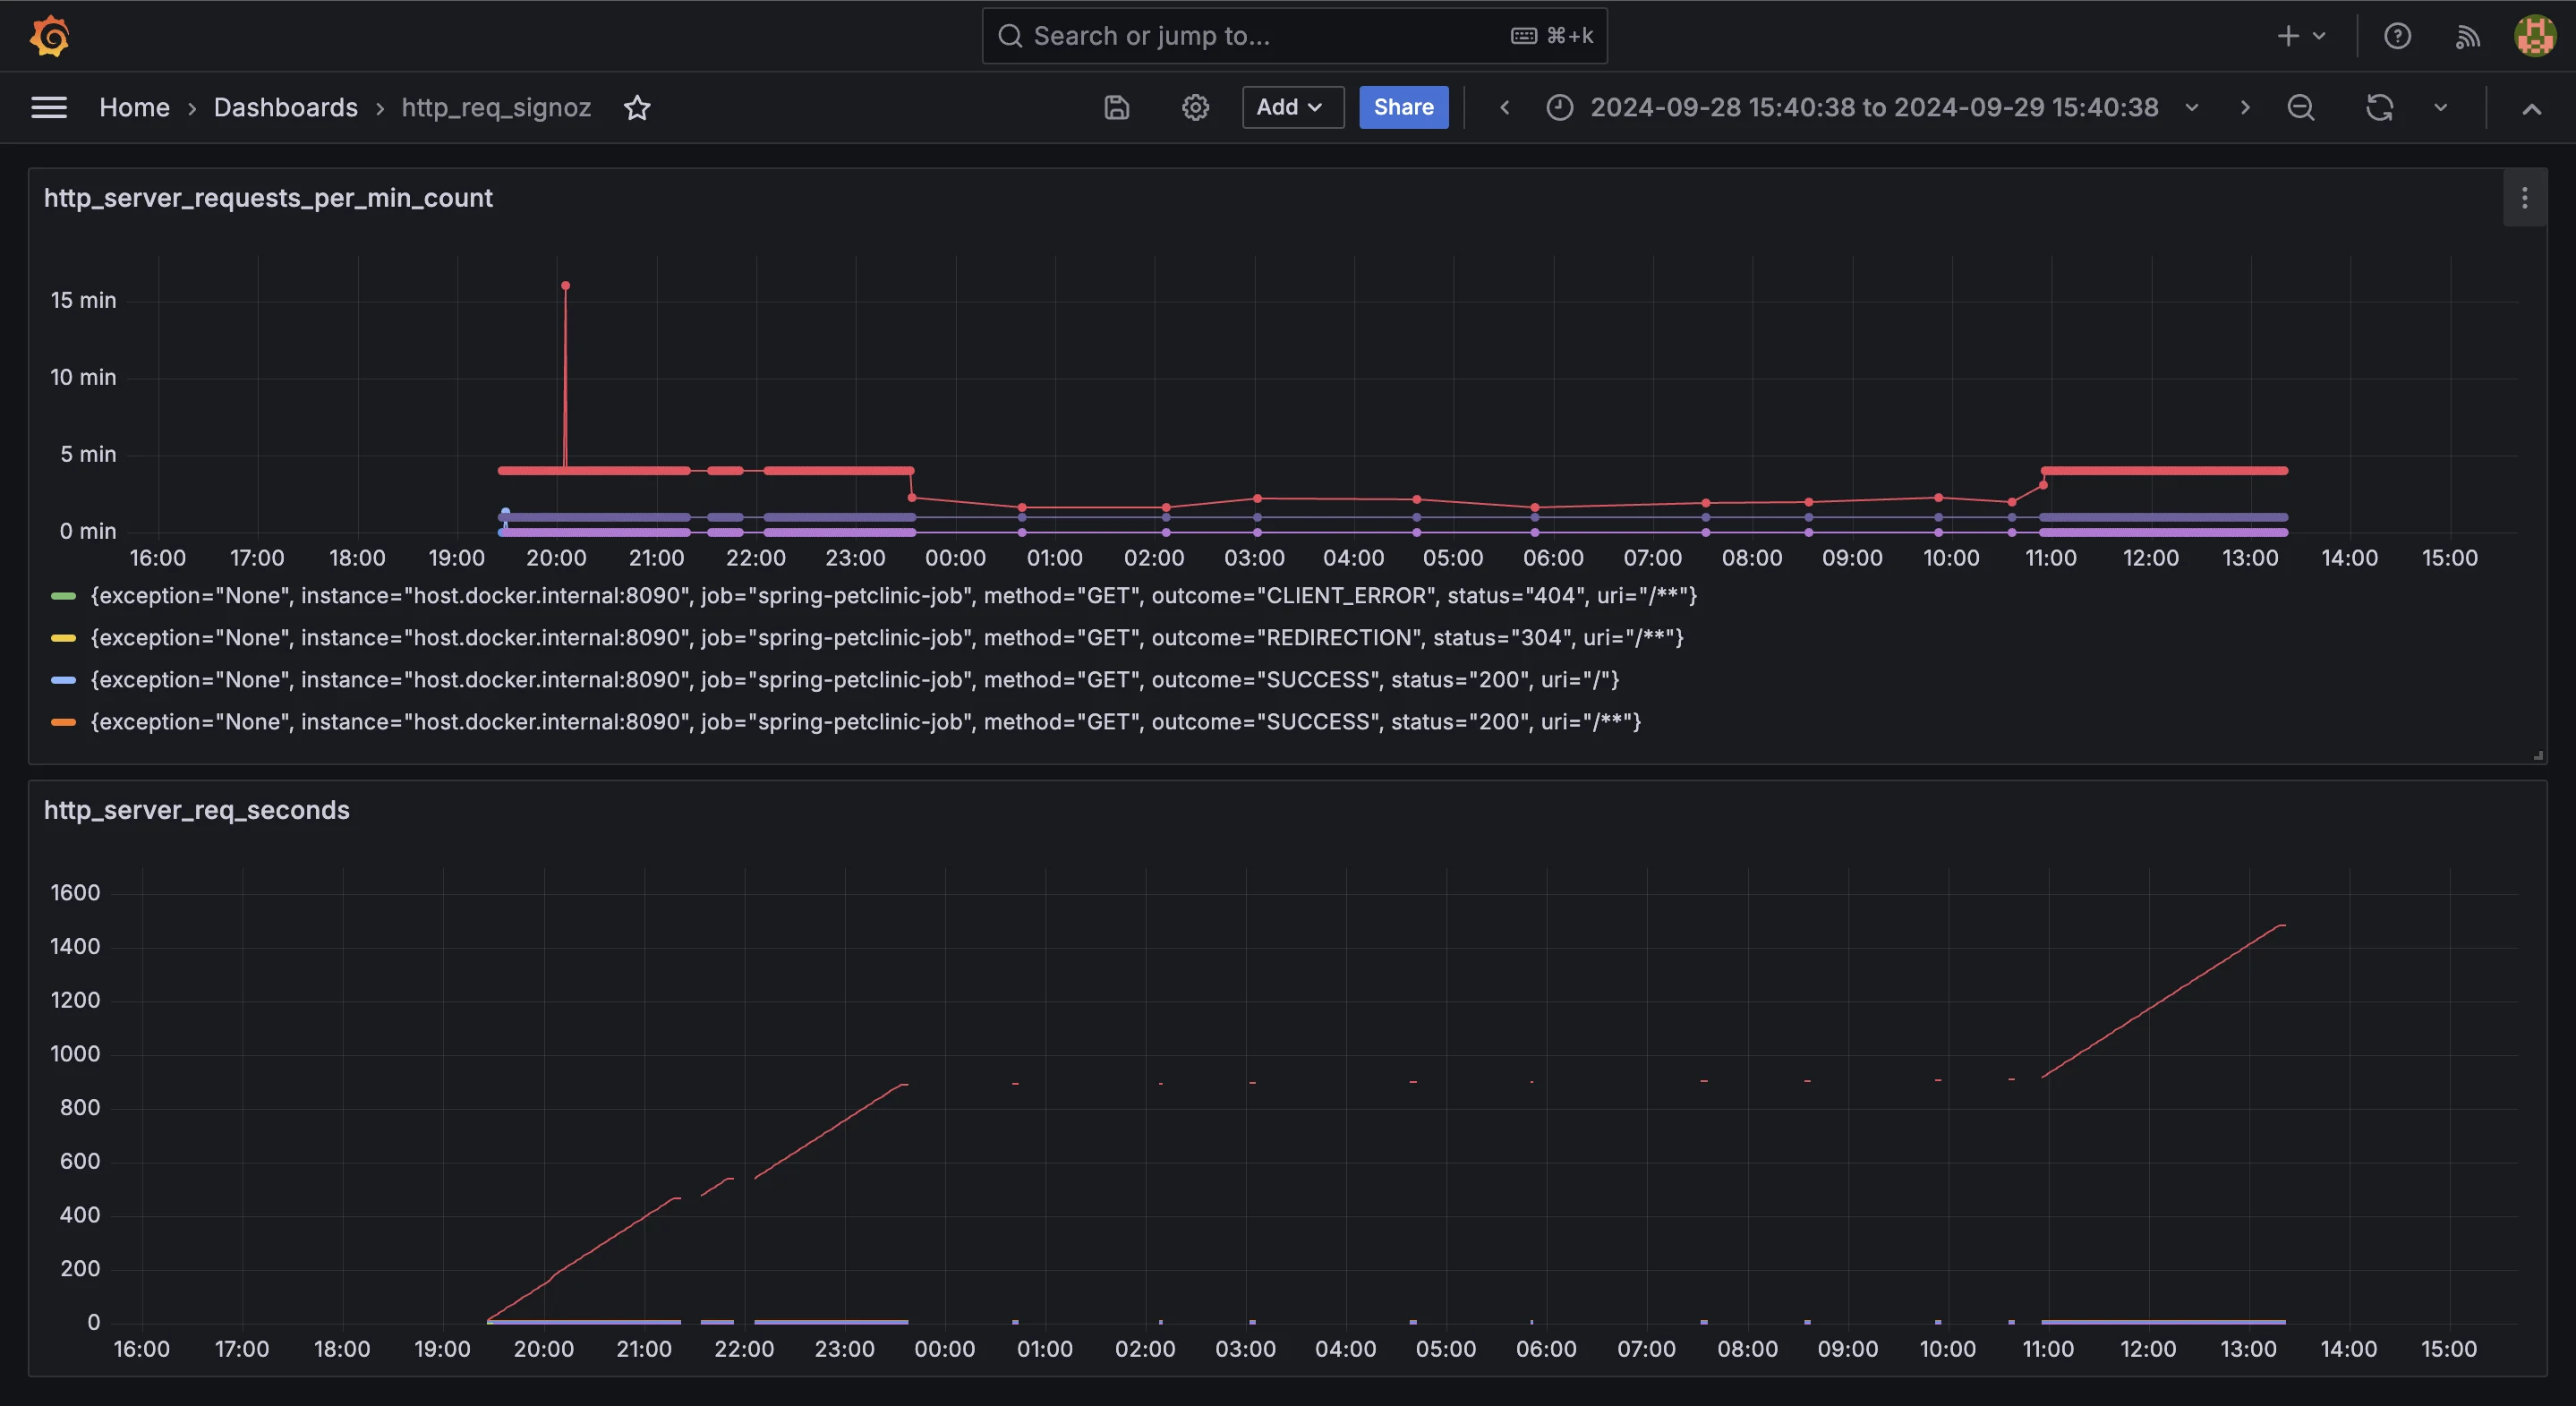
Dashboard overview Optional- Set Up Alerts To stay informed of significant changes in HTTP request rates, you can configure alerts in Grafana. Alerts will notify you when specific conditions are met, such as sudden spikes or drops in traffic.Add alerts: Go to the Alert tab in the panel configuration, where you can define thresholds for high or low request rates that will trigger notifications. This can be useful for early detection of performance issues or traffic anomalies. To know more about Setting up the Alerts you follow the official docs here.
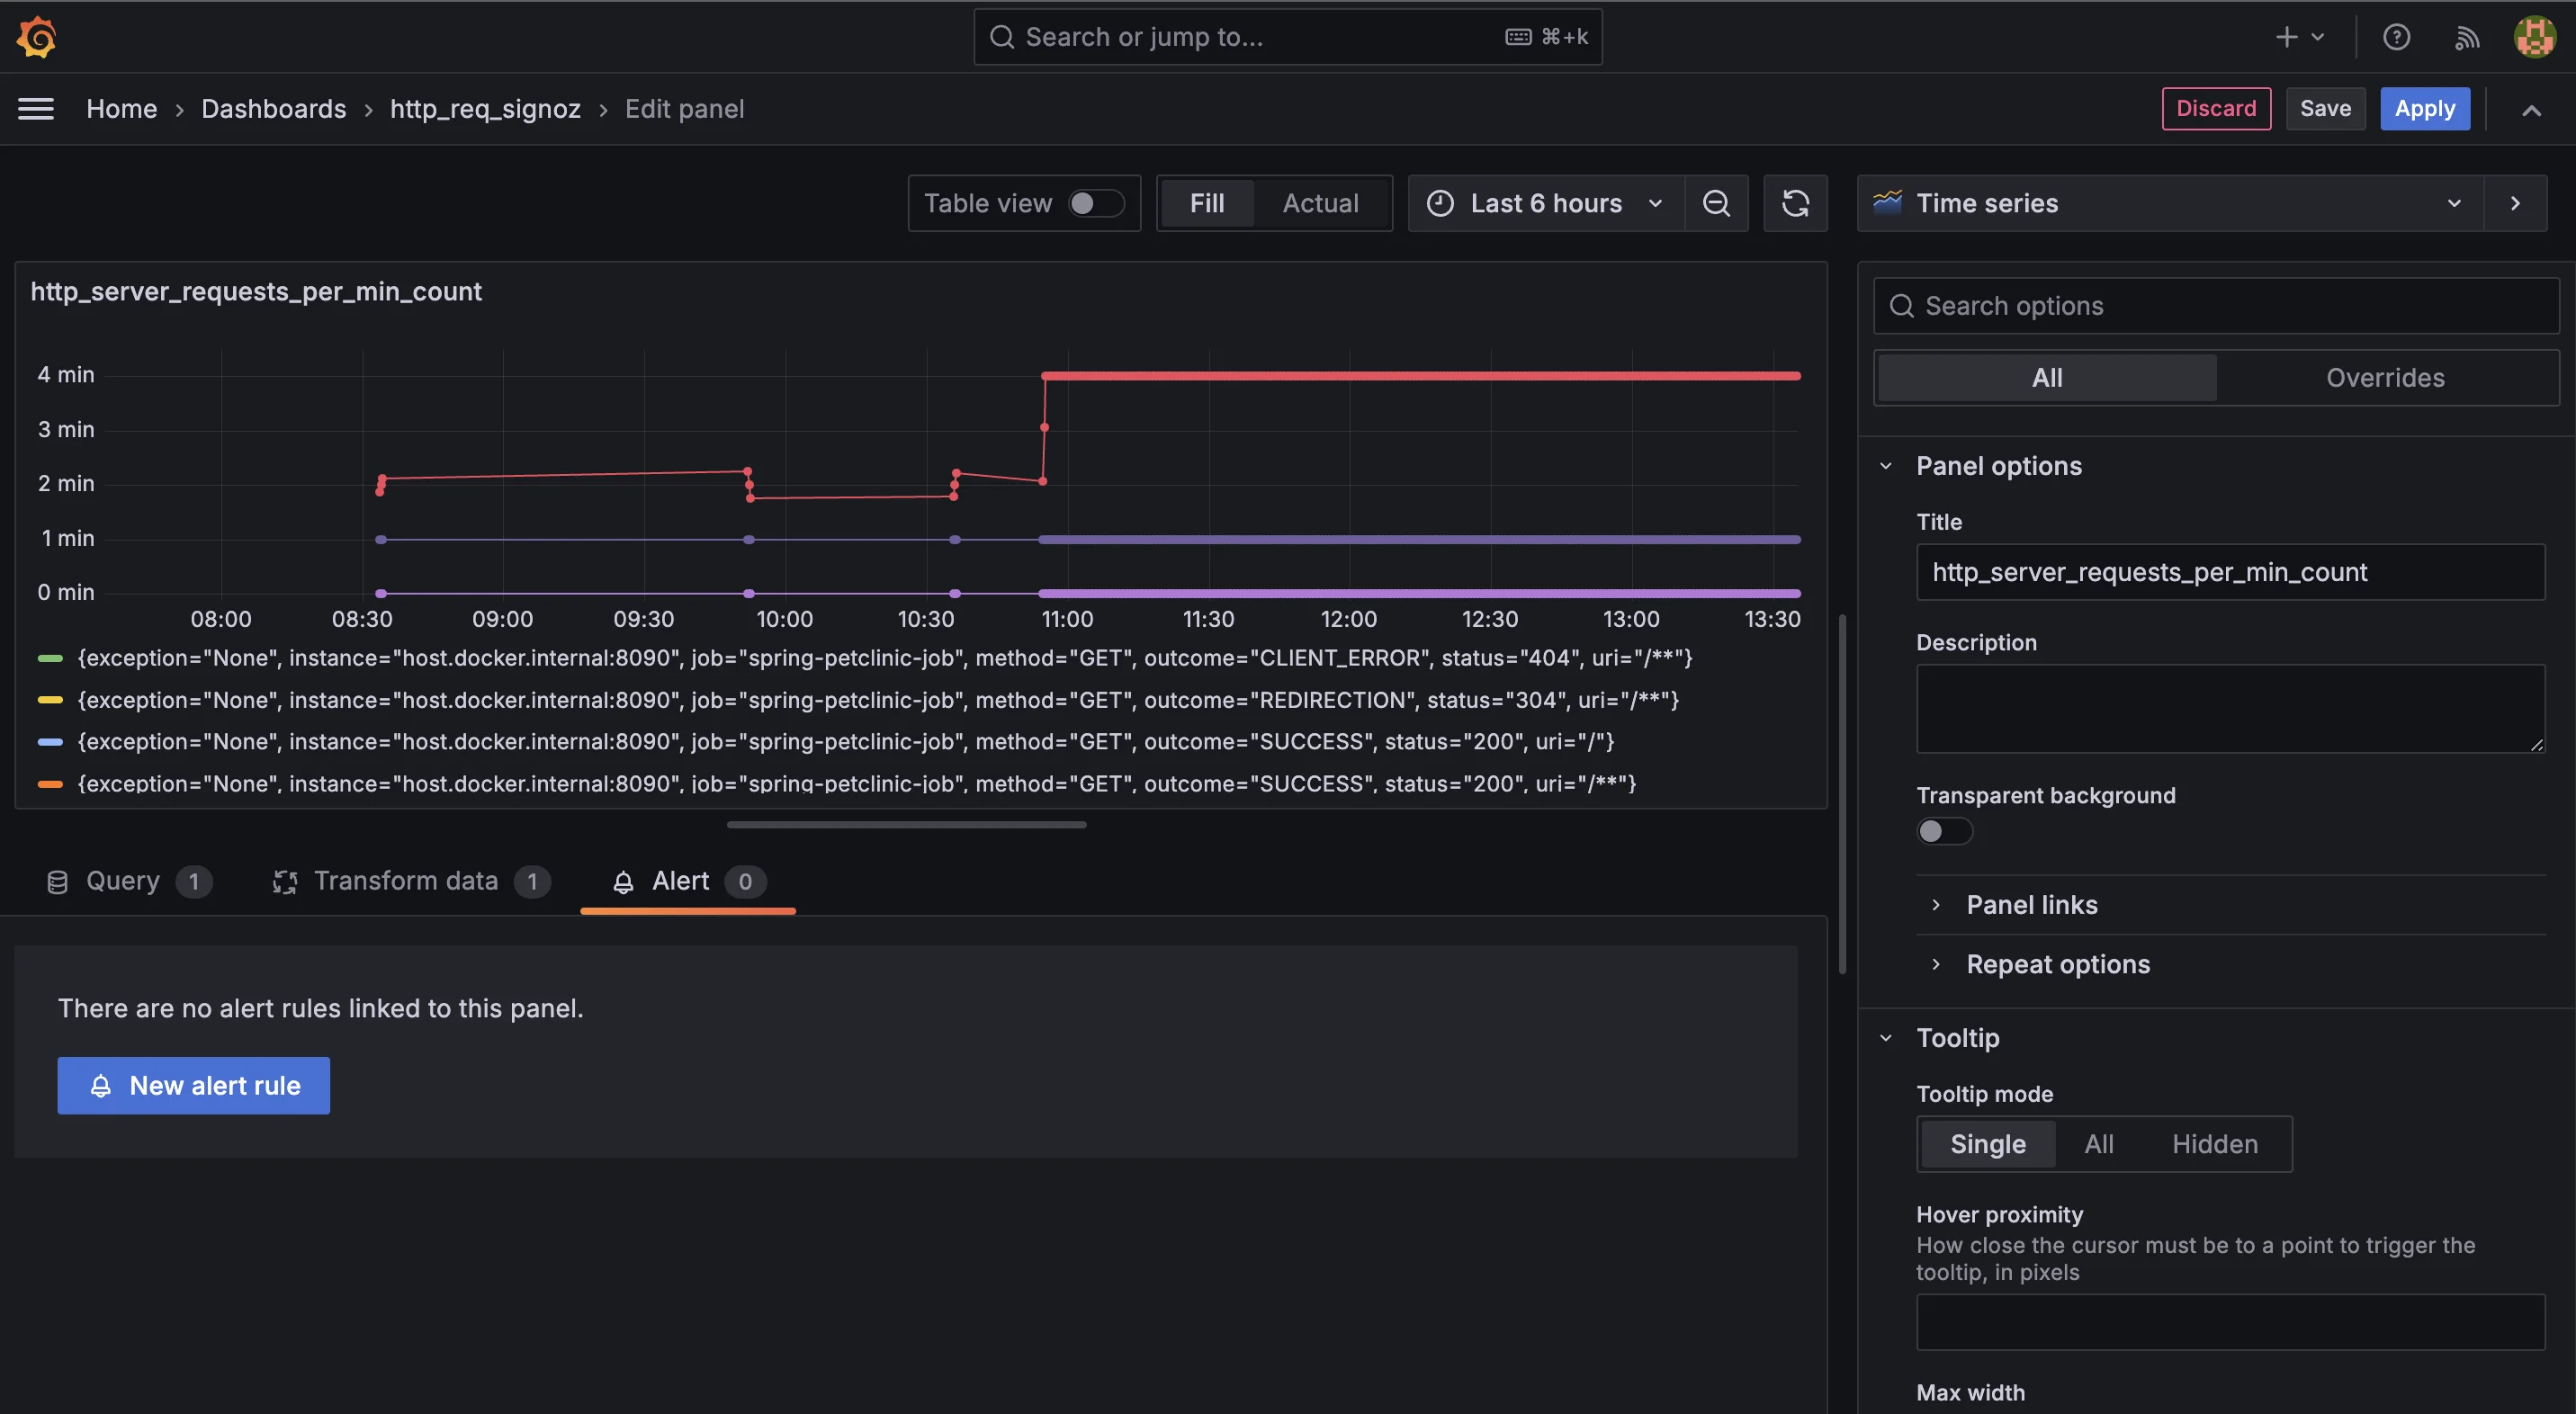
Alerts tab Once configured, your dashboard should give you real-time insight into your HTTP request patterns, enabling proactive monitoring of your application’s performance.
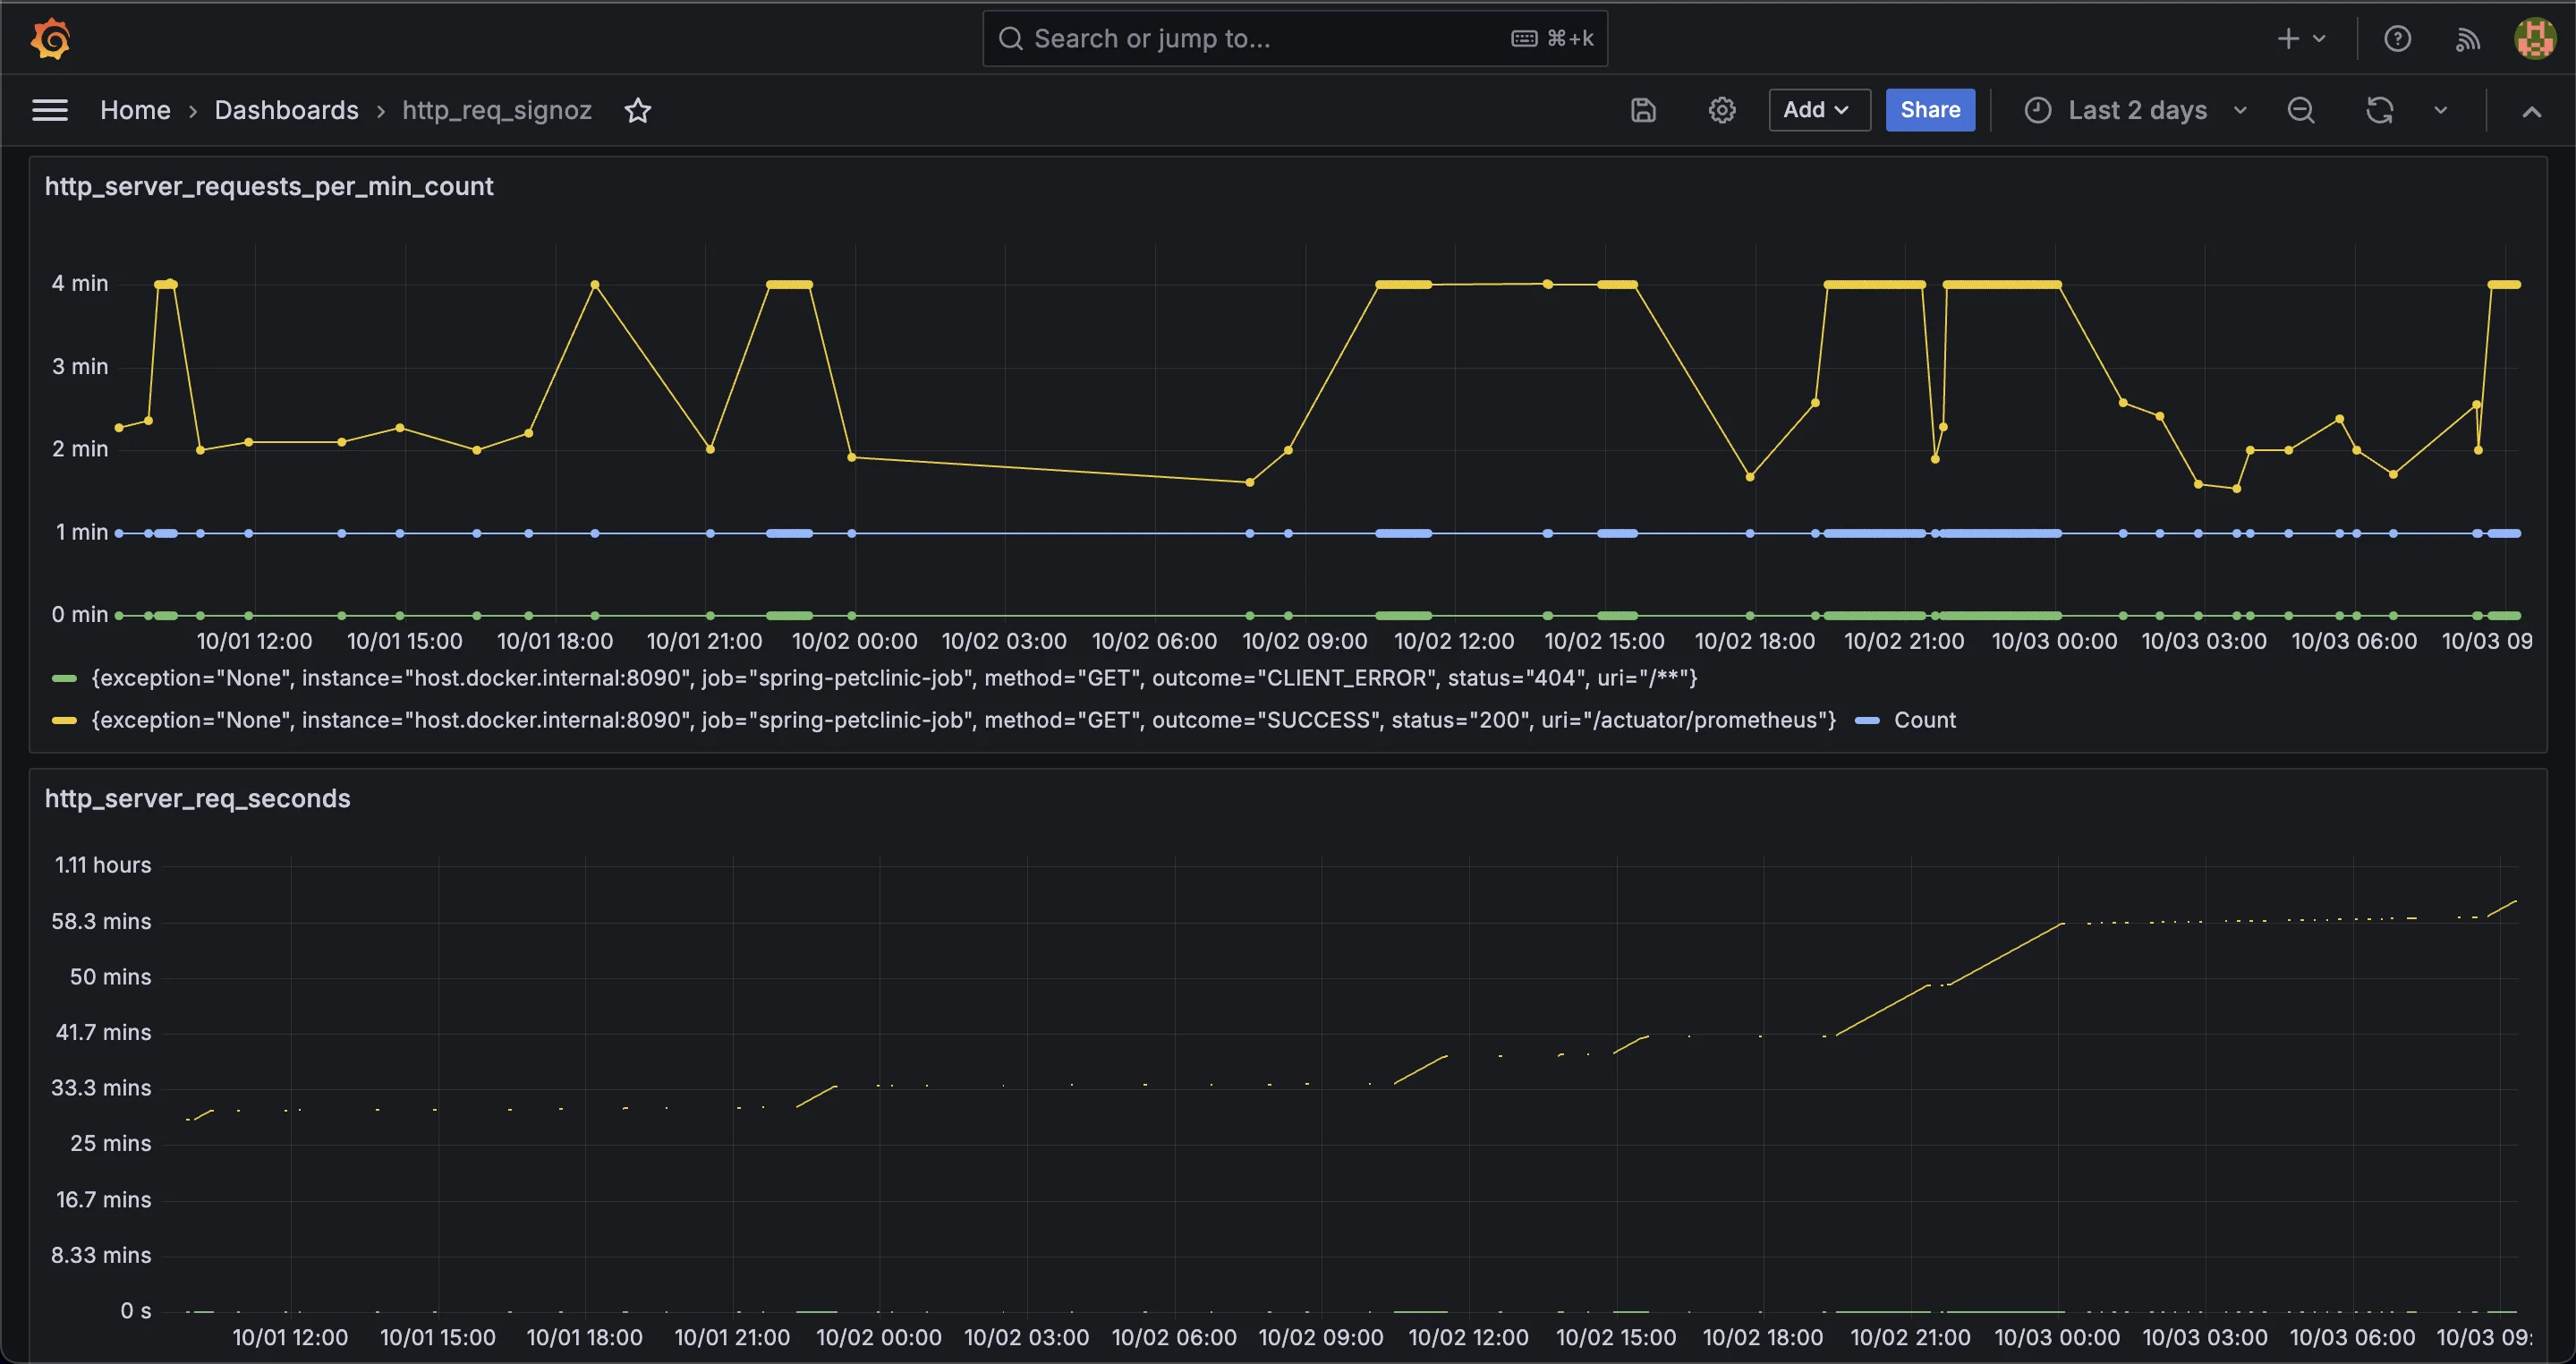
Final dashboard
Crafting the Perfect PromQL Query
PromQL (Prometheus Query Language) is essential for extracting and analyzing metrics from your monitoring setup. Here's a breakdown of the basic structure of a PromQL query, focusing on how to monitor HTTP requests:
Understanding the Query Components
- Metric Selection:
http_server_requests_seconds_count{}: This part of the query selects all the time series associated with the metrichttp_server_requests_seconds_count, which tracks the number of HTTP requests over time. The empty{}allows you to filter further using labels (such as status codes or URIs) if needed. - Time Range:
[1m]: This specifies the time frame during which the rate is calculated—in this example, a 1-minute window. You may change this depending on your analytical requirements, such as tracking trends over shorter or longer intervals. - Rate Calculation:
rate(): Therate()function computes the average per-second rate of increase for the metric within the specified time range. It helps you understand how fast HTTP requests are being received by the server.
Practical Adjustments for Different Scenarios
Hourly Request Rates: If you want to calculate the request rate per hour instead of per second, you can adjust the time range and multiply by the number of seconds in an hour:
rate(http_server_requests_seconds_count{}[1h]) * 3600This query calculates the per-second rate over the past hour and multiplies it by 3600 (the number of seconds in an hour) to give you requests per hour.
Filtering by Specific Endpoint: If you're interested in monitoring requests to a particular endpoint, you can filter the metric by its URI label:
rate(http_server_requests_seconds_count{uri="/api/users"}[1m]) * 60This query monitors only the requests to the
/api/usersendpoint over a 1-minute period, multiplied by 60 to get the requests per minute.Grouping by Status Code: To analyze request patterns by status codes (e.g., 200, 404), you can use the
sum by (status)clause to group requests based on their HTTP status:sum by (status) (rate(http_server_requests_seconds_count{}[1m])) * 60This query calculates the request rate for each status code and aggregates them, showing you the number of requests per minute, broken down by their status (e.g., success, errors).
Interpreting and Analyzing HTTP Request Graphs
Understanding the information presented in your HTTP request graphs is key to gaining insights into your application's performance and usage patterns. Here's how to interpret different trends and what they may indicate:
- A rapid rise in HTTP requests frequently indicates a spike in traffic. This might be attributed to an organic rise in user engagement, such as a promotional campaign or the introduction of a new feature. However, it might also indicate an external issue, such as a Distributed Denial of Service (DDoS) assault, in which malicious traffic overwhelms your server. Investigating these surges helps to discover the source and whether scaling or security measures are required.
- If your graph shows consistent peaks and valleys over time, these may represent predictable daily or weekly usage trends. For instance, your application might receive more requests during business hours or specific days of the week. Identifying these patterns allows you to plan resources more efficiently, such as allocating more server capacity during peak times or scheduling maintenance during periods of low activity.
- A sharp decline in the number of HTTP requests could be a red flag, suggesting a service outage, network failure, or an application malfunction. In this scenario, immediate investigation is crucial to restore normal operations and minimize downtime. Correlating the drop with other system metrics, such as server health or error logs, can help pinpoint the root cause.
By analyzing HTTP request graphs in Grafana, you can make informed decisions to optimize your application's performance:
- Identify peak usage times: Recognizing when your application experiences the highest traffic helps in resource planning, allowing you to allocate sufficient infrastructure to handle demand without over-provisioning during low-traffic periods.
- Detect and investigate anomalies: Whether it’s a sudden spike, unexpected pattern, or sharp drop, identifying anomalies in your request data gives you the opportunity to investigate and resolve potential performance issues before they escalate. Early detection can prevent larger problems, such as system crashes or slow response times.
- Correlate request rates with other metrics: To get a full picture of your application's health, correlate request rates with other key performance indicators, such as response times, error rates, or CPU usage. For example, an increase in request rates alongside a rise in error rates might indicate that your application is struggling to handle traffic, requiring optimizations to improve stability and responsiveness.
Best Practices for HTTP Request Monitoring with Grafana
- Set up alerts: Configure alerts for unusual spikes or drops in HTTP request rates to quickly address traffic surges, outages, or potential issues.
- Use appropriate time ranges: Short time ranges for real-time monitoring; longer time ranges for trend analysis over days, weeks, or months.
- Combine with other metrics: Pair HTTP request data with metrics like CPU usage, memory consumption, and database performance for a comprehensive view of your application’s health.
- Regularly update dashboards: Review and adjust dashboards to ensure they remain relevant as your application grows or changes.
- Monitor specific endpoints: Use PromQL labels to focus on critical endpoints or APIs, allowing you to monitor performance and detect issues specific to key parts of your application.
- Track status codes: Filter HTTP requests by status codes (e.g., 2xx, 4xx, 5xx) to identify successful transactions, client errors, or server failures, helping pinpoint where issues may occur.
- Use efficient data retention: Set appropriate data retention policies in Prometheus to balance long-term trend analysis and resource management, ensuring that you don’t overconsume storage while still tracking historical data.
- Leverage panel types in Grafana: Use different Grafana panel types, such as heatmaps, histograms, or tables, to better visualize specific aspects of HTTP request data and gain deeper insights.
Enhancing Your Monitoring Setup with SigNoz
To effectively monitor your applications and systems, leveraging an advanced observability platform like SigNoz can elevate your monitoring strategy. SigNoz is an open-source observability tool that provides end-to-end monitoring, troubleshooting, and alerting capabilities across your entire application stack.
Built on OpenTelemetry—the emerging industry standard for telemetry data—SigNoz integrates seamlessly with your existing Prometheus and Grafana setup. This unified observability solution enhances your ability to monitor HTTP requests per minute alongside deep traces, giving you a comprehensive view of your application's performance.
SigNoz complements this setup by offering additional monitoring features:
- Extend Prometheus Monitoring: Retain your existing Prometheus setup while enhancing it with tracing and logging capabilities.
- Faster Troubleshooting: Correlate metrics with traces and logs to quickly identify and resolve performance issues.
- Flexible Data Analysis: Use both PromQL and SigNoz's advanced query builder for versatile data exploration and analysis.
- Unified Dashboards: Build custom dashboards that bring together metrics, traces, and logs, helping you monitor key performance indicators and identify trends effectively.
To get started with HTTP request monitoring of your application with SigNoz, follow the steps in this section.
SigNoz Cloud is the easiest way to run SigNoz. Sign up for a free account and get 30 days of unlimited access to all features.
You can also install and self-host SigNoz yourself since it is open-source. With 24,000+ GitHub stars, open-source SigNoz is loved by developers. Find the instructions to self-host SigNoz.
Benefits of using SigNoz for End-to-End Monitoring
By integrating SigNoz into your monitoring workflow, you unlock several significant advantages:
- Comprehensive Monitoring: Gain a complete view of how your services handle HTTP requests, with metrics, traces, and logs in one place.
- Proactive Problem Resolution: Real-time alerts and detailed traces allow your team to catch and fix issues before they impact users.
- Data-Driven Optimizations: Analyze how your system handles traffic spikes and optimize your application’s performance with advanced querying capabilities.
Key Takeaways
- Grafana and Prometheus work together to help visualize and track key metrics from your web application. Prometheus collects and stores the data, while Grafana displays it in a way that's easy to understand through real-time dashboards.
- The
http_server_requests_seconds_countmetric helps you understand how many requests your server handles over time. By analyzing this data, you can gauge the overall traffic to your application and identify any unusual spikes or drops in requests. - PromQL (Prometheus Query Language) enables you to filter and analyze specific HTTP request data, such as monitoring requests to a particular endpoint or filtering by status codes. Learning to write precise PromQL queries ensures that your Grafana dashboards display the correct information.
- Regular analysis of HTTP request graphs offers valuable insights, can detect performance issues, identify trends, and make informed decisions about scaling or optimizing your application. For example, noticing a sudden increase in request rates could help you address load-balancing challenges or potential security threats.
- While Grafana and Prometheus are powerful, integrating them with solutions like SigNoz can provide additional features such as enhanced visualization, real-time alerting, and a more user-friendly interface. This can simplify the monitoring process and give you a broader view of your application’s health.
FAQs
What is the difference between rate() and irate() in Prometheus queries?
rate()calculates the average increase over a time range, providing smooth graphs.irate()focuses on the last two data points for quicker, but more volatile, results.
How can I monitor specific endpoints or status codes separately?
Use labels in your query, like:
rate(http_server_requests_seconds_count{uri="/api/users", status="200"}[1m]) * 60
This tracks successful requests to the /api/users endpoint.
What are some common issues that high request rates might indicate?
High request rates may indicate:
- Increased app usage
- DDoS attacks
- Inefficient API usage
- Caching or load balancing issues
How often should I update my Grafana dashboards for HTTP request monitoring?
Review your dashboards monthly to ensure they still provide relevant insights. Update them when:
- Adding new features or endpoints to your application
- Changing your infrastructure or scaling your application
- Identifying new metrics or patterns you want to monitor
