How to Retrieve All Prometheus Metrics - A Step-by-Step Guide
Prometheus has become a cornerstone of modern monitoring and observability solutions. Its powerful metric collection and querying capabilities make it an essential tool for DevOps and SRE teams. But how do you retrieve all metrics from a Prometheus instance? This guide will walk you through the process step-by-step, covering everything from basic API usage to advanced querying techniques.
Understanding Prometheus Metrics and Their Importance
Prometheus metrics are numerical measurements collected at regular intervals to monitor the health and performance of systems and applications. These metrics play a crucial role in maintaining system observability, allowing you to track trends, identify issues, and make data-driven decisions.
Types of Metrics Collected by Prometheus
Prometheus collects four main types of metrics, each serving a specific purpose in monitoring system behavior and performance:
Counters: A counter is a cumulative metric that can only increase over time (or reset to zero upon restart). It’s used to track the number of times an event has occurred, e.g., the total number of requests a system has handled or the number of errors that have occurred.
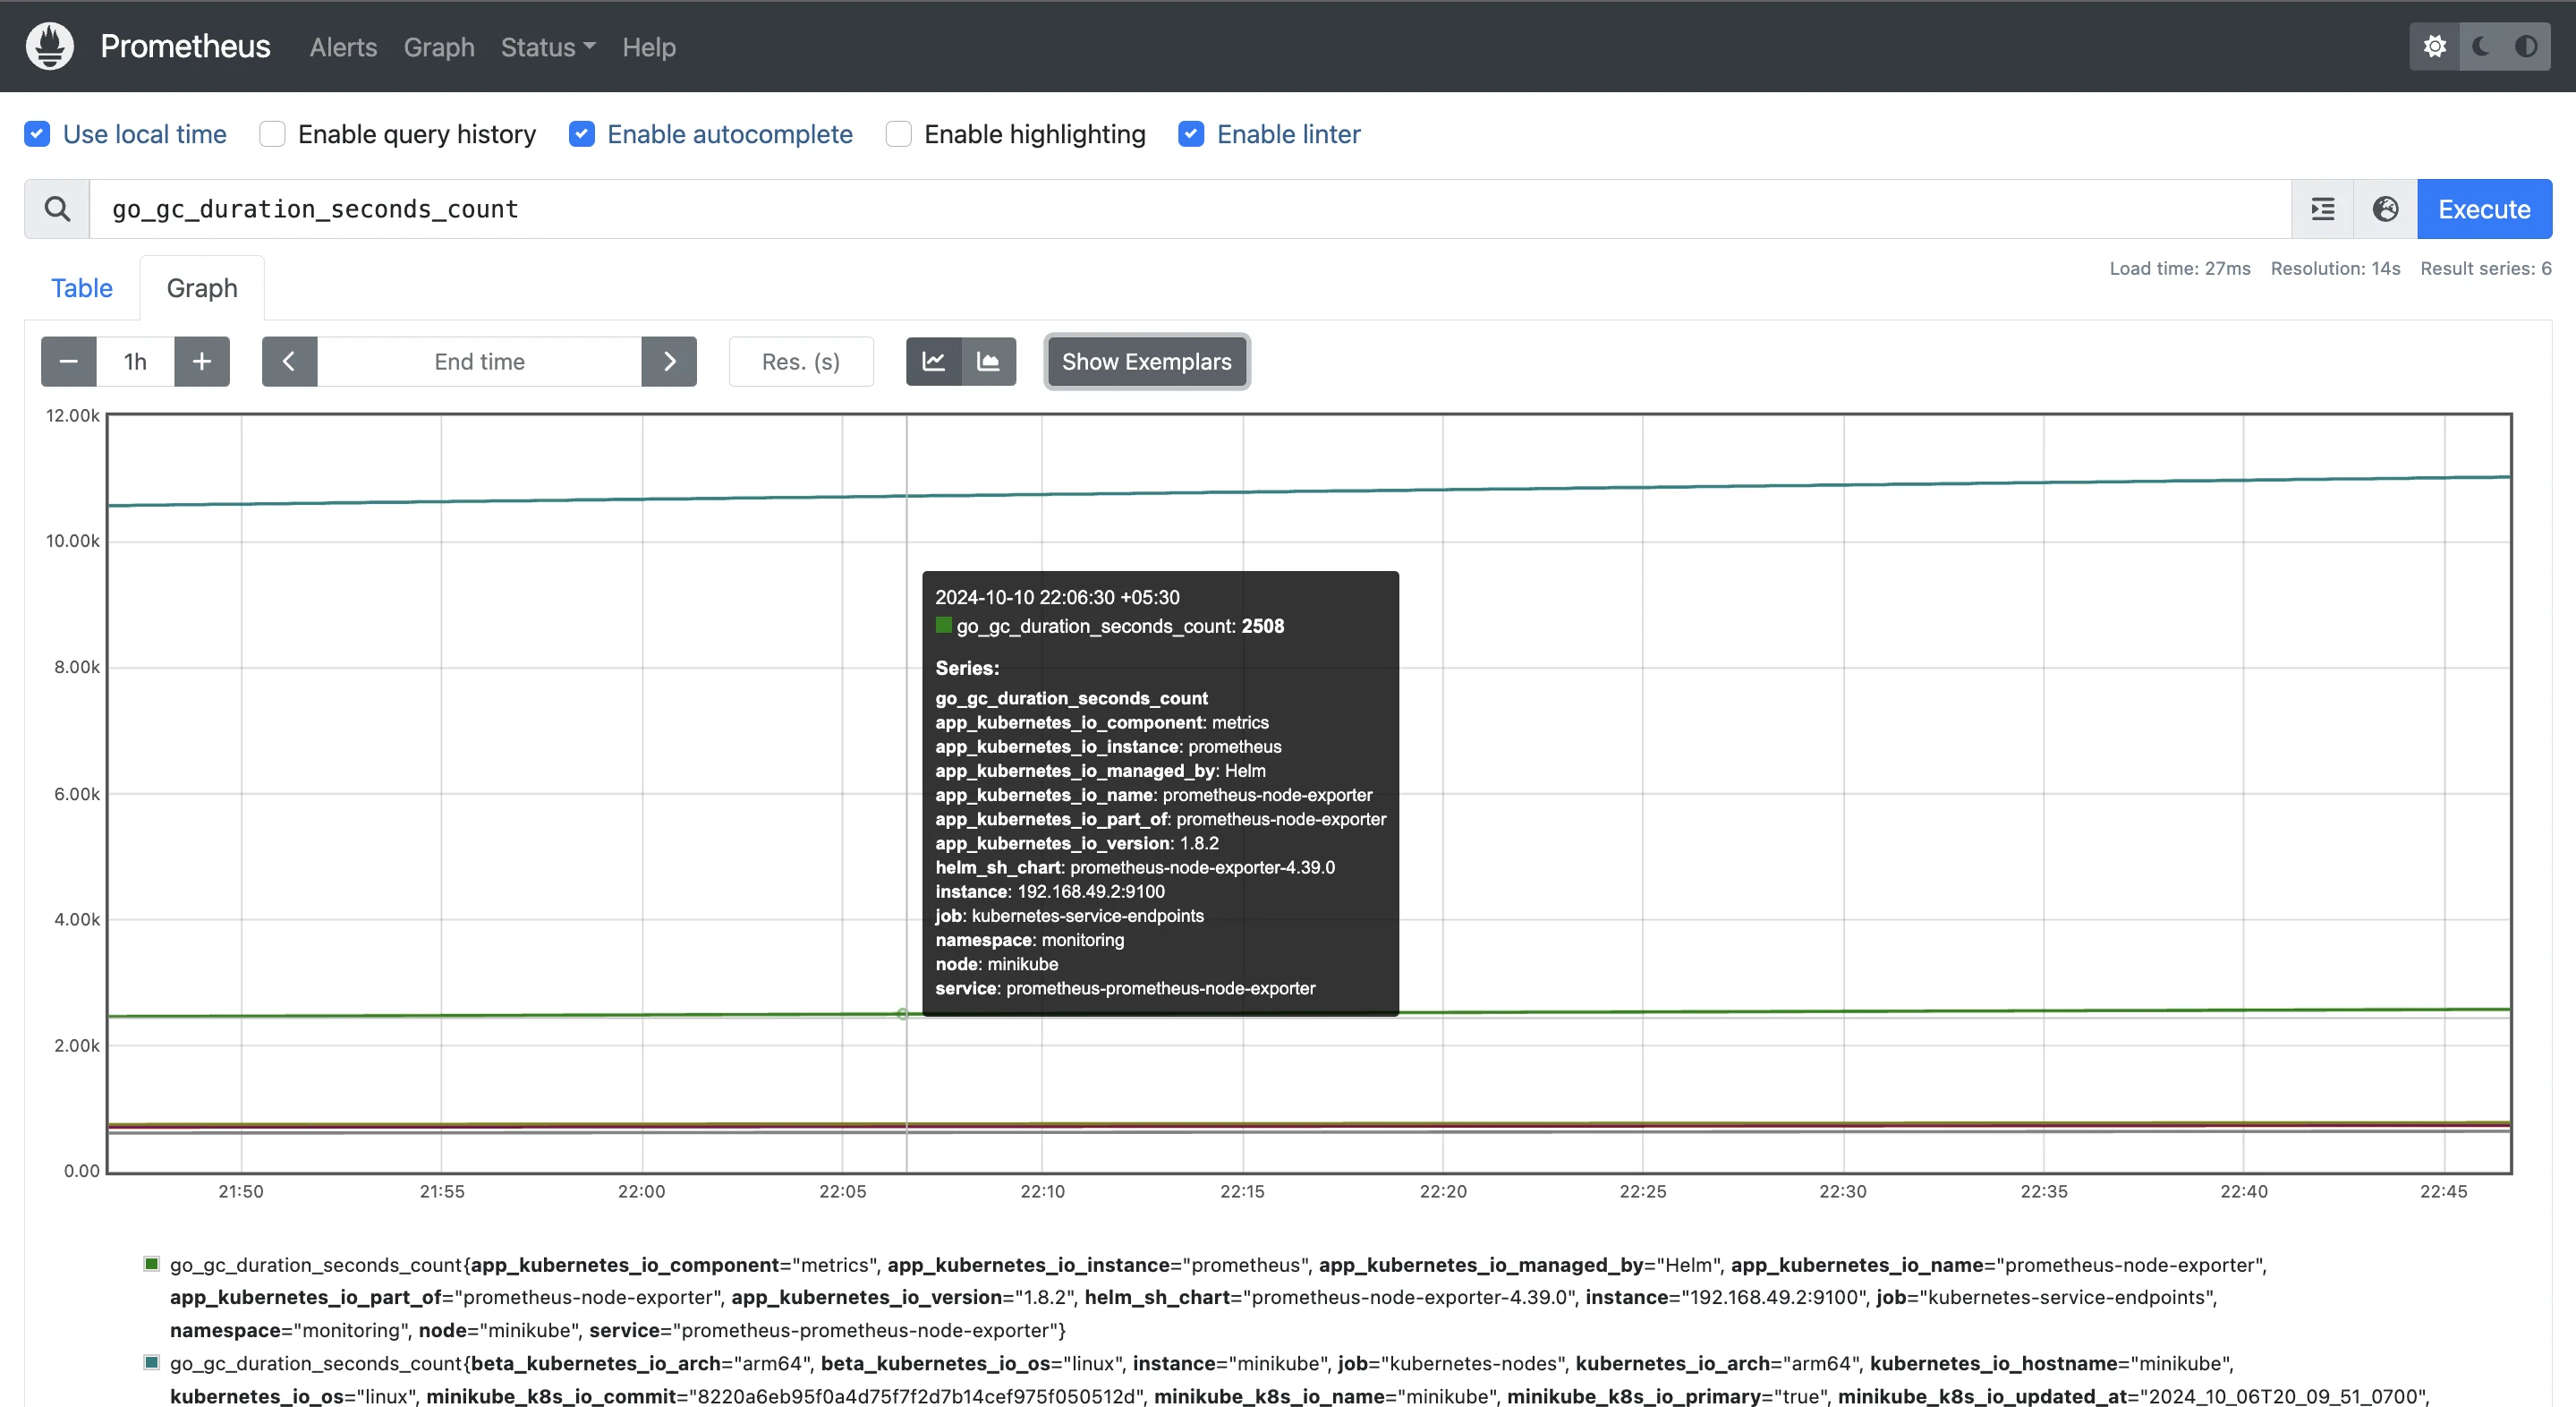
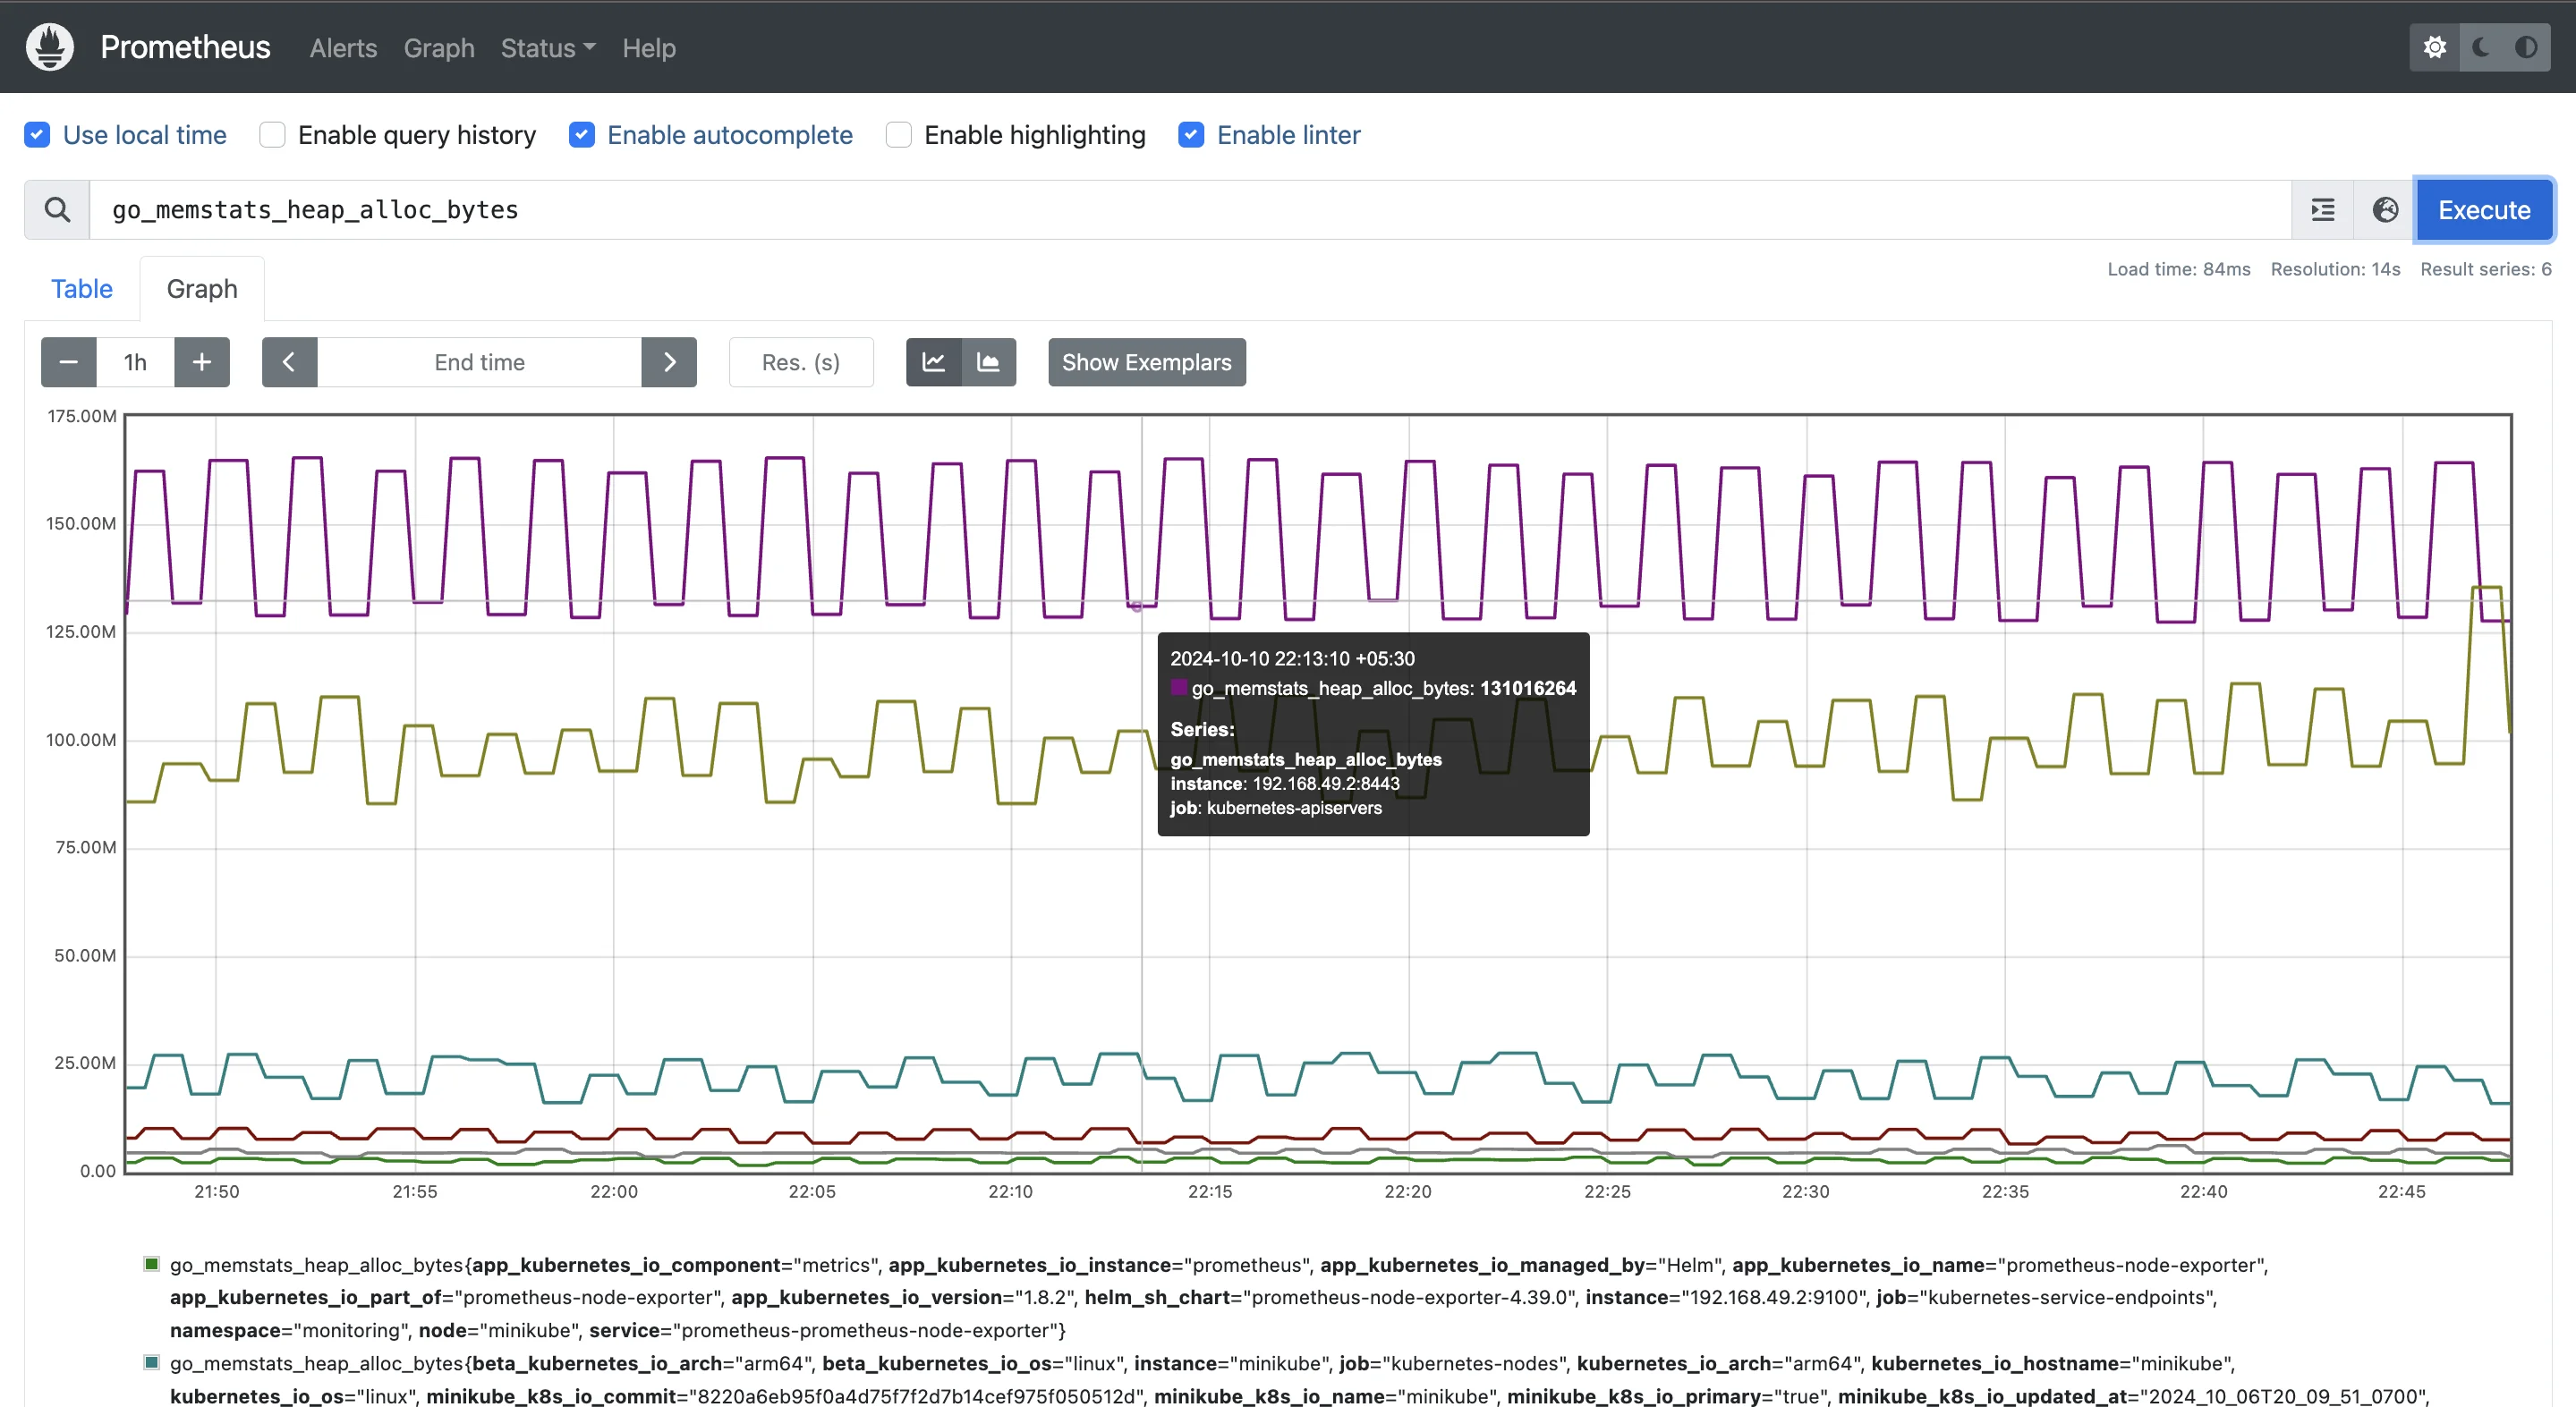
Counter graph Gauges: Unlike counters, gauges can go up or down. They measure values that fluctuate, like CPU usage, memory consumption, or the number of active users. For instance, if you monitor memory usage, the gauge will show you that the system is using 50% of the memory at one point and 40% later on. Gauges provide real-time data about current resource usage.
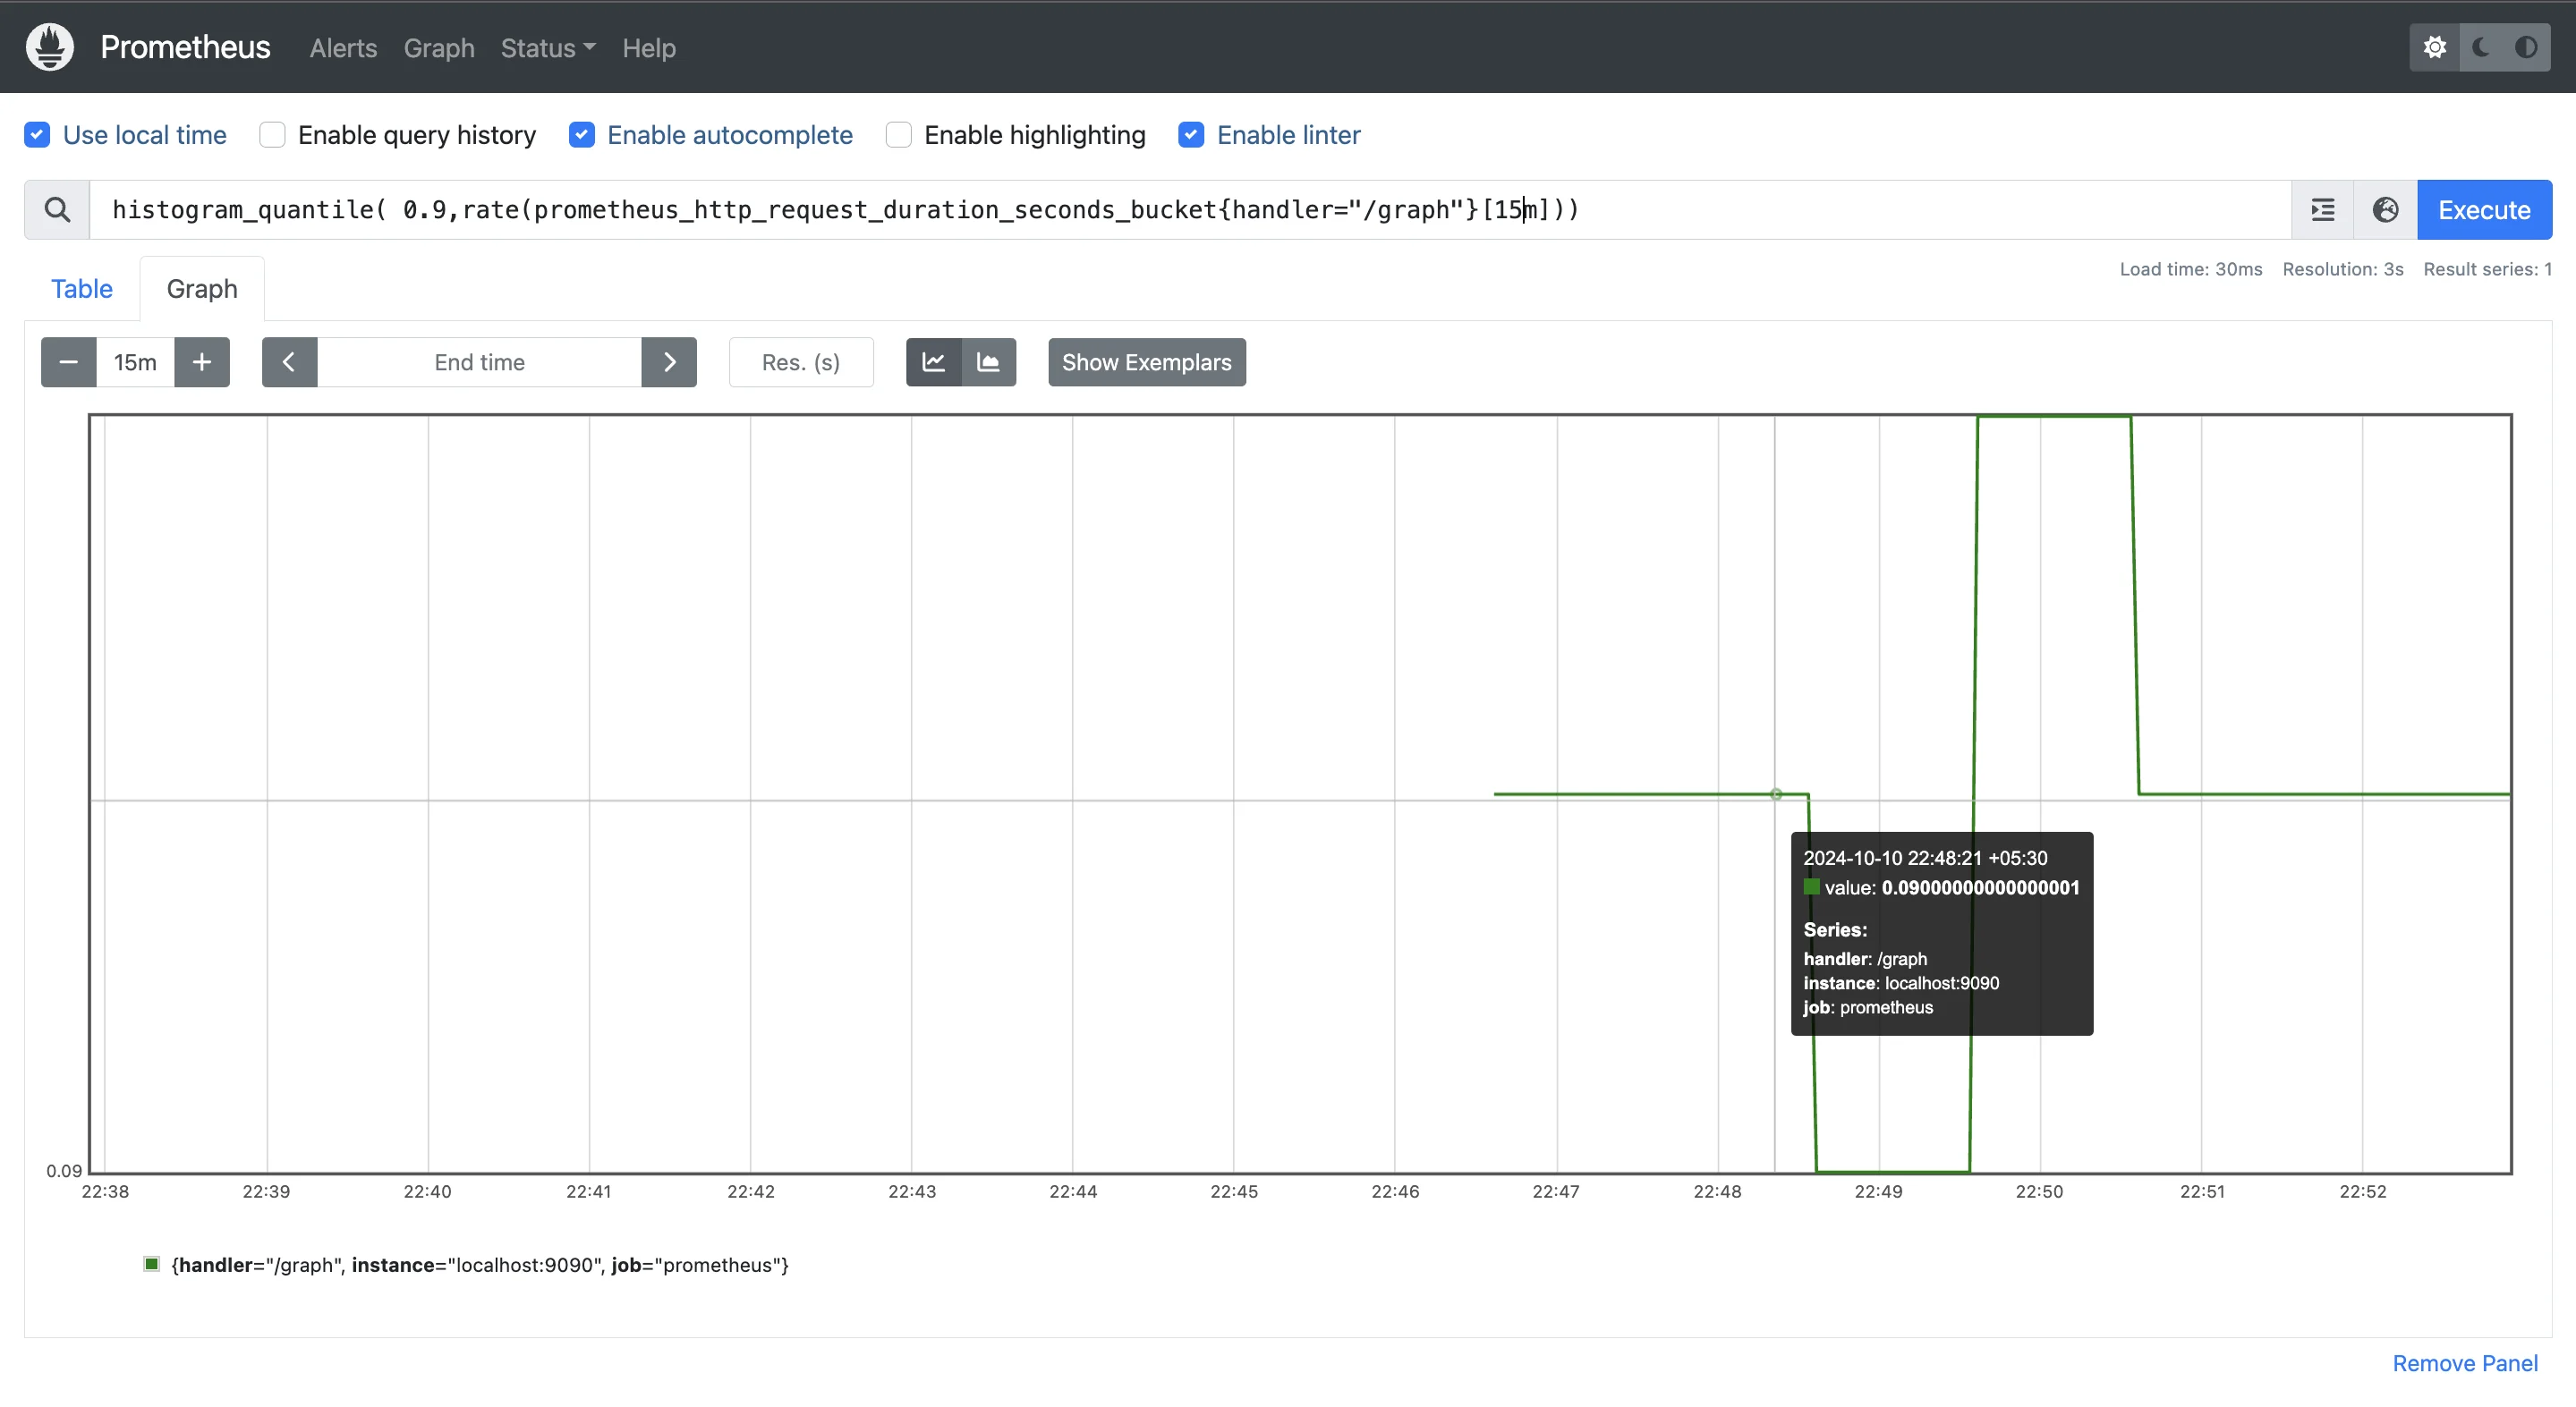
Gauges Histograms: Histograms are used to measure the distribution of values over time, which is useful for monitoring things like request durations or response sizes. A histogram groups data into buckets; for example, you could measure how many requests are completed in under 1 second, between 1 and 2 seconds, and so on.
Histograms Summaries: Summaries are similar to histograms but focus on calculating quantiles (like the 95th percentile) over a sliding time window. They help you get precise measurements of how long requests take, providing more detail on performance, especially when you need specific statistical data for latency or response times.
For a more in-depth explanation of Prometheus Core Metric Types, refer to this guide.
Importance of Comprehensive Metric Collection
The importance of comprehensive metric collection cannot be overstated when it comes to monitoring and managing the performance of systems and applications. Let’s break down why it’s so essential:
- Real-time insights: Metrics provide immediate visibility into how your system is performing, allowing you to spot and address issues as they happen.
- Historical data: By collecting metrics over time, you can analyze trends, such as increasing resource usage, and plan accordingly.
- Alerts for potential issues: You can set up alerts to notify you of problems, such as high CPU usage, before they become critical, helping you prevent downtime.
- Capacity planning and optimization: Metrics help you plan for future resource needs and optimize system performance by identifying inefficiencies.
How Prometheus Stores and Collects Metrics
Prometheus stores metrics in its custom time-series database (TSDB), which is optimized for handling timestamped data points. This structure is ideal for tracking system and application performance because it efficiently manages high-cardinality data, enabling real-time monitoring and historical trend analysis. Each metric is stored as a unique time series, identified by a metric name and labels (key-value pairs), which add context—such as the source of the metric (e.g., instance="hostname:9090", job="api-server"). These labels are critical for filtering, grouping, and querying metrics, allowing Prometheus to scale easily, even in large environments where thousands of metrics are collected.
Prometheus collects metrics in two ways:
- HTTP Scraping: This is the primary method Prometheus uses to collect metrics. Applications and services expose their metrics on a
/metricsendpoint, and Prometheus scrapes these endpoints at regular intervals, pulling data into its TSDB. - Push Gateway: This is an intermediary service for short-lived jobs that can't be scraped directly. These jobs push their metrics to the Pushgateway, which then exposes them for Prometheus to scrape.
Access to the collected metrics is provided through several methods:
- HTTP API: The primary interface for querying metrics (via endpoints like
/api/v1/query). - PromQL: A powerful query language used through the HTTP API for complex aggregation, filtering and analysis of collected data.
- Remote Storage: Optional integration for long-term storage and querying of metrics in external systems
- Integration APIs: Enabling visualization tools like Grafana to query and display the metrics.
How to Get All Metrics from a Prometheus Instance
To retrieve all the metrics from a Prometheus instance, you can make use of the Prometheus HTTP API. This API provides a powerful and flexible way to query the data stored in Prometheus, enabling you to retrieve metrics, query historical data, and even set up complex monitoring queries.
Overview of the Prometheus HTTP API
The Prometheus HTTP API is an essential tool for interacting with the Prometheus server. It allows you to perform a wide range of operations such as querying data, managing alerts, and fetching metadata about the metrics being collected. The API endpoints are designed to be accessible, making it simple to integrate with other services or tools. By using this API, you can programmatically access the data you need for analysis or automation purposes. One of the core endpoints in the Prometheus API is /api/v1/query, which is specifically designed for querying metrics. This endpoint is used when you want to retrieve the current value of a specific set of metrics or perform queries based on Prometheus Query Language (PromQL).
The /api/v1/query endpoint is the most commonly used endpoint in Prometheus for querying time-series data. This endpoint allows you to run PromQL queries against the Prometheus database and fetch results for metrics, giving you a direct way to analyze and monitor your systems.
Step-by-Step Guide to Forming a Query to Fetch All Metrics
Here's a step-by-step guide to forming a query that fetches all metrics:
Construct the API URL: Start by forming the base URL to access your Prometheus server. If your Prometheus server is running on
localhostand using the default port9090, the URL would look like this:http://localhost:9090/api/v1/queryForm the query parameter: The query parameter should be constructed to fetch all metrics. Use the following PromQL query for this purpose:
query={__name__=~".+"}Combine the URL and query: Combine the base API URL and the query to create the final request. Here’s an example:
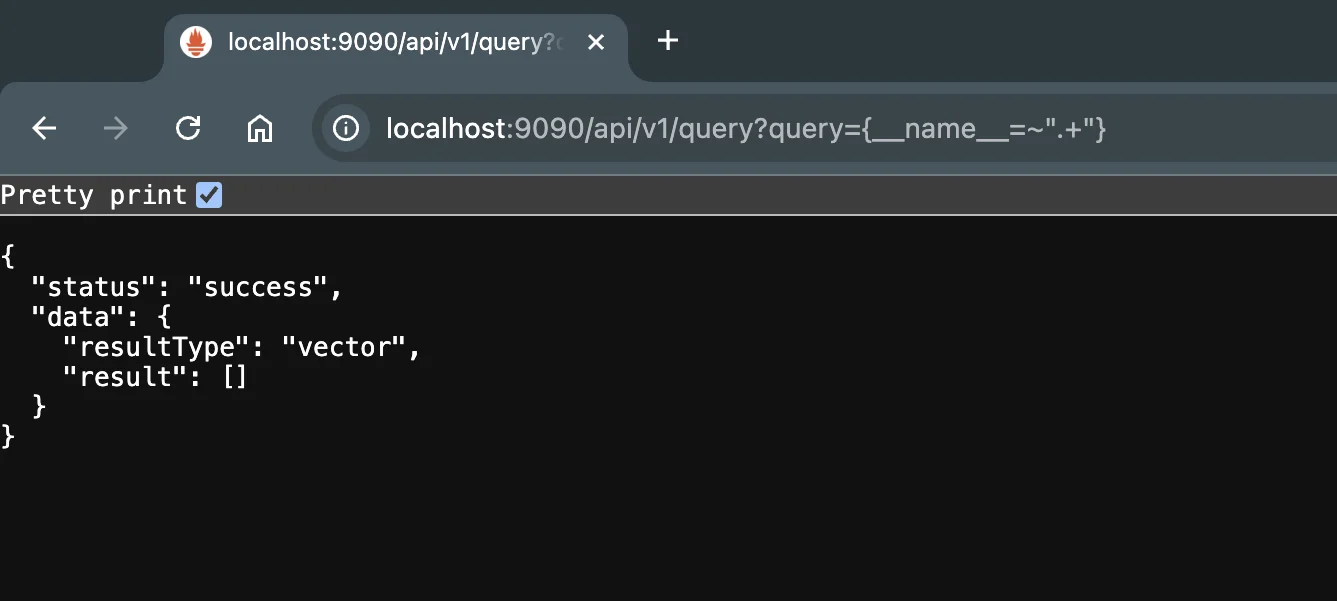
http://localhost:9090/api/v1/query?query={__name__=~".+"}
Here's an example using curl to make the API request:
You can use the curl command to send a request to the Prometheus API and retrieve the metrics. Here's an example:
curl 'http://localhost:9090/api/v1/query?query={__name__=~".+"}'
This command will return a JSON response containing all the metrics and their current values.
Using PromQL to Retrieve All Metrics
PromQL, or Prometheus Query Language, is a powerful tool for querying and retrieving metrics stored in Prometheus. It allows users to construct queries that can filter, aggregate, and manipulate time series data to gain insights into system and application performance.
To retrieve all metrics in Prometheus, you can use the following syntax:
{__name__=~".+"}
Let's break it down:
{}specifies a selector for time series data.__name__is a special label that represents the metric name.- The
=~operator enables the use of regular expressions (regex), making it possible to specify complex patterns for matching metric names. - The
".+"regex pattern matches one or more occurrences of any character, effectively capturing any metric name that contains at least one character. This makes it useful for retrieving all available metrics since every valid metric name must contain at least one character.
How to Filter Metrics by Specific Labels or Instances
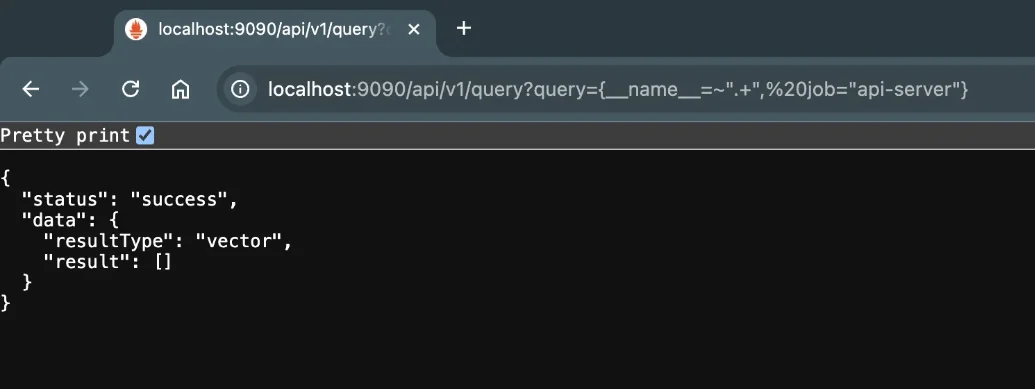
You can refine your queries further by filtering metrics using specific labels. Labels in Prometheus provide additional context, such as the job or instance from which the metric originates. For example, if you only want metrics related to a specific service (like api-server), you can include label-based filtering:
{__name__=~".+", job="api-server"}
This query will return all metrics that are associated with the job labeled as "api-server."
Accessing Prometheus Metrics Through Different Methods
While the HTTP API is powerful, there are several other ways to access Prometheus metrics:
This offers a quick way to explore metrics and run queries. You can access the web UI at:
http://<prometheus-server>:<port>
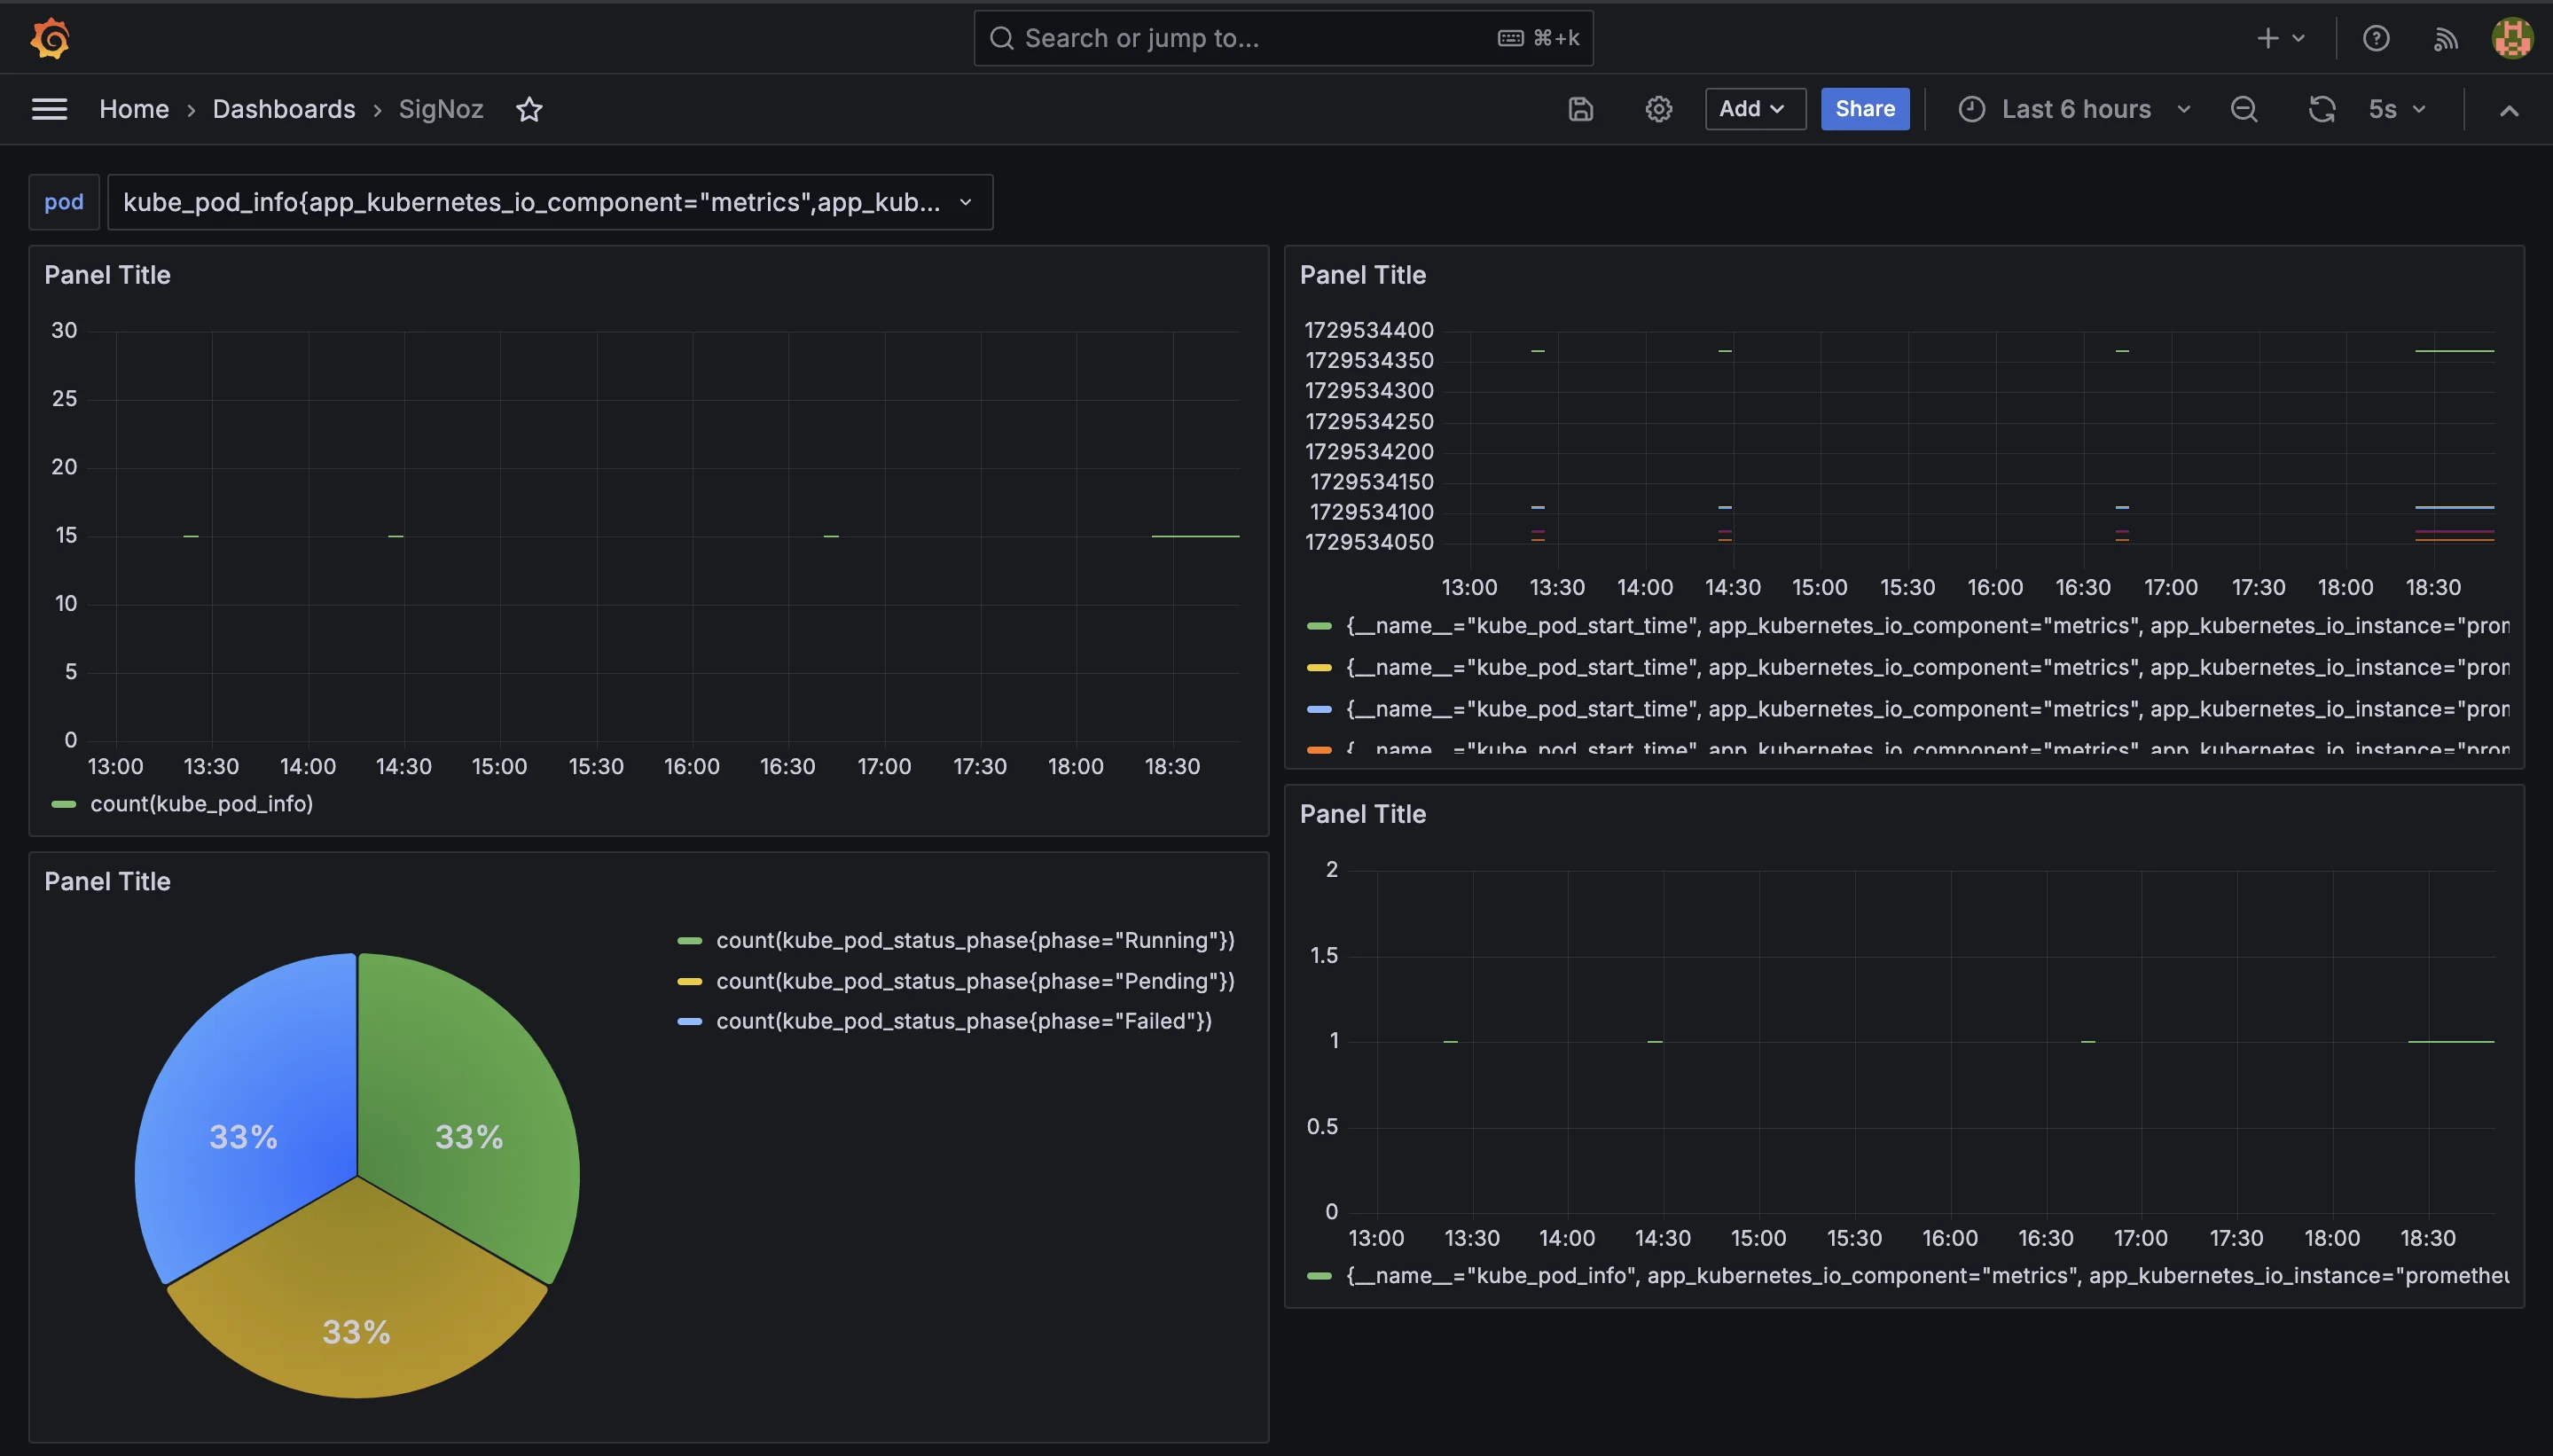
Prometheus landing page Grafana:
Grafana is a popular visualization tool that integrates well with Prometheus. It provides rich dashboarding capabilities for your metrics.
Grafana Dashboard Client Libraries:
Prometheus offers client libraries in various languages. Here's is an example in Python:
from prometheus_api_client import PrometheusConnect

# Connect to Prometheus
prom = PrometheusConnect(url="http://localhost:9090", disable_ssl=True)

# Get all metrics
metrics = prom.all_metrics()

# Print the metrics in a formatted way
print("### Output from Prometheus Metrics Script ###\n")
# Print each metric in a bullet point format
for metric in metrics:
    print(f"- {metric}")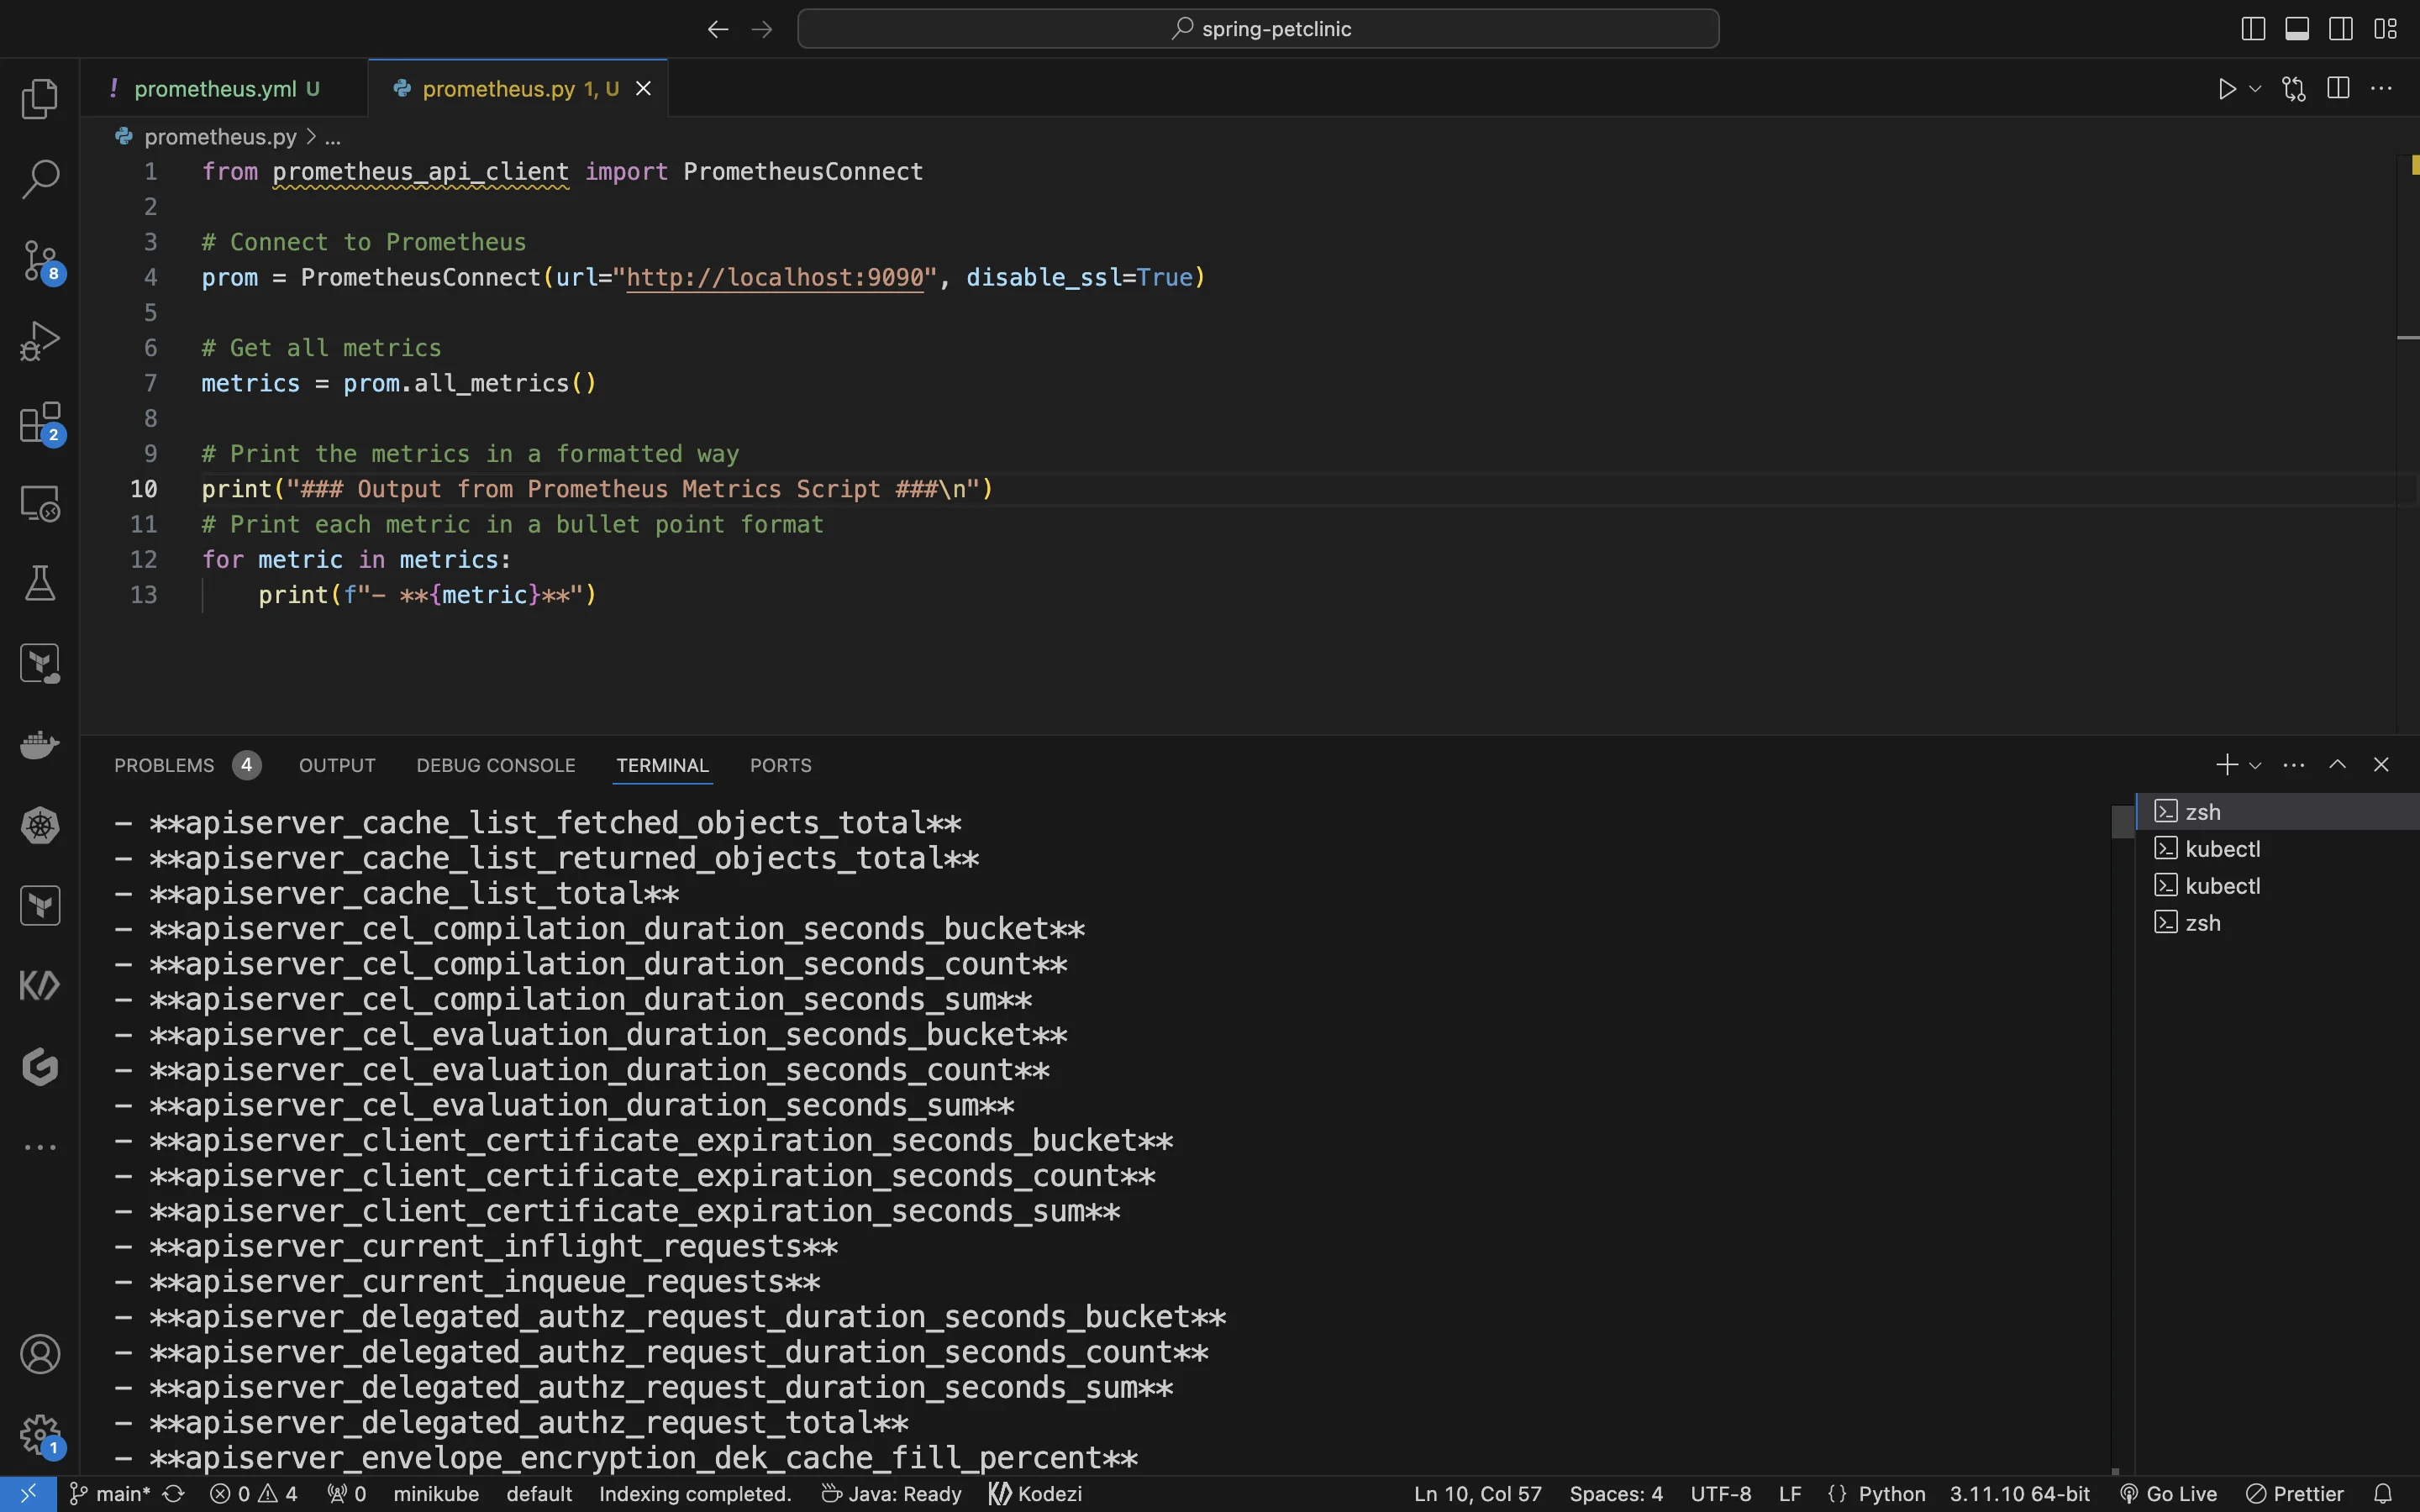
Collecting metrics using client library Command-Line Tools:
Tools like
promtoolcan query Prometheus from the command line:promtool query instant http://localhost:9090 '{__name__=~".+"}'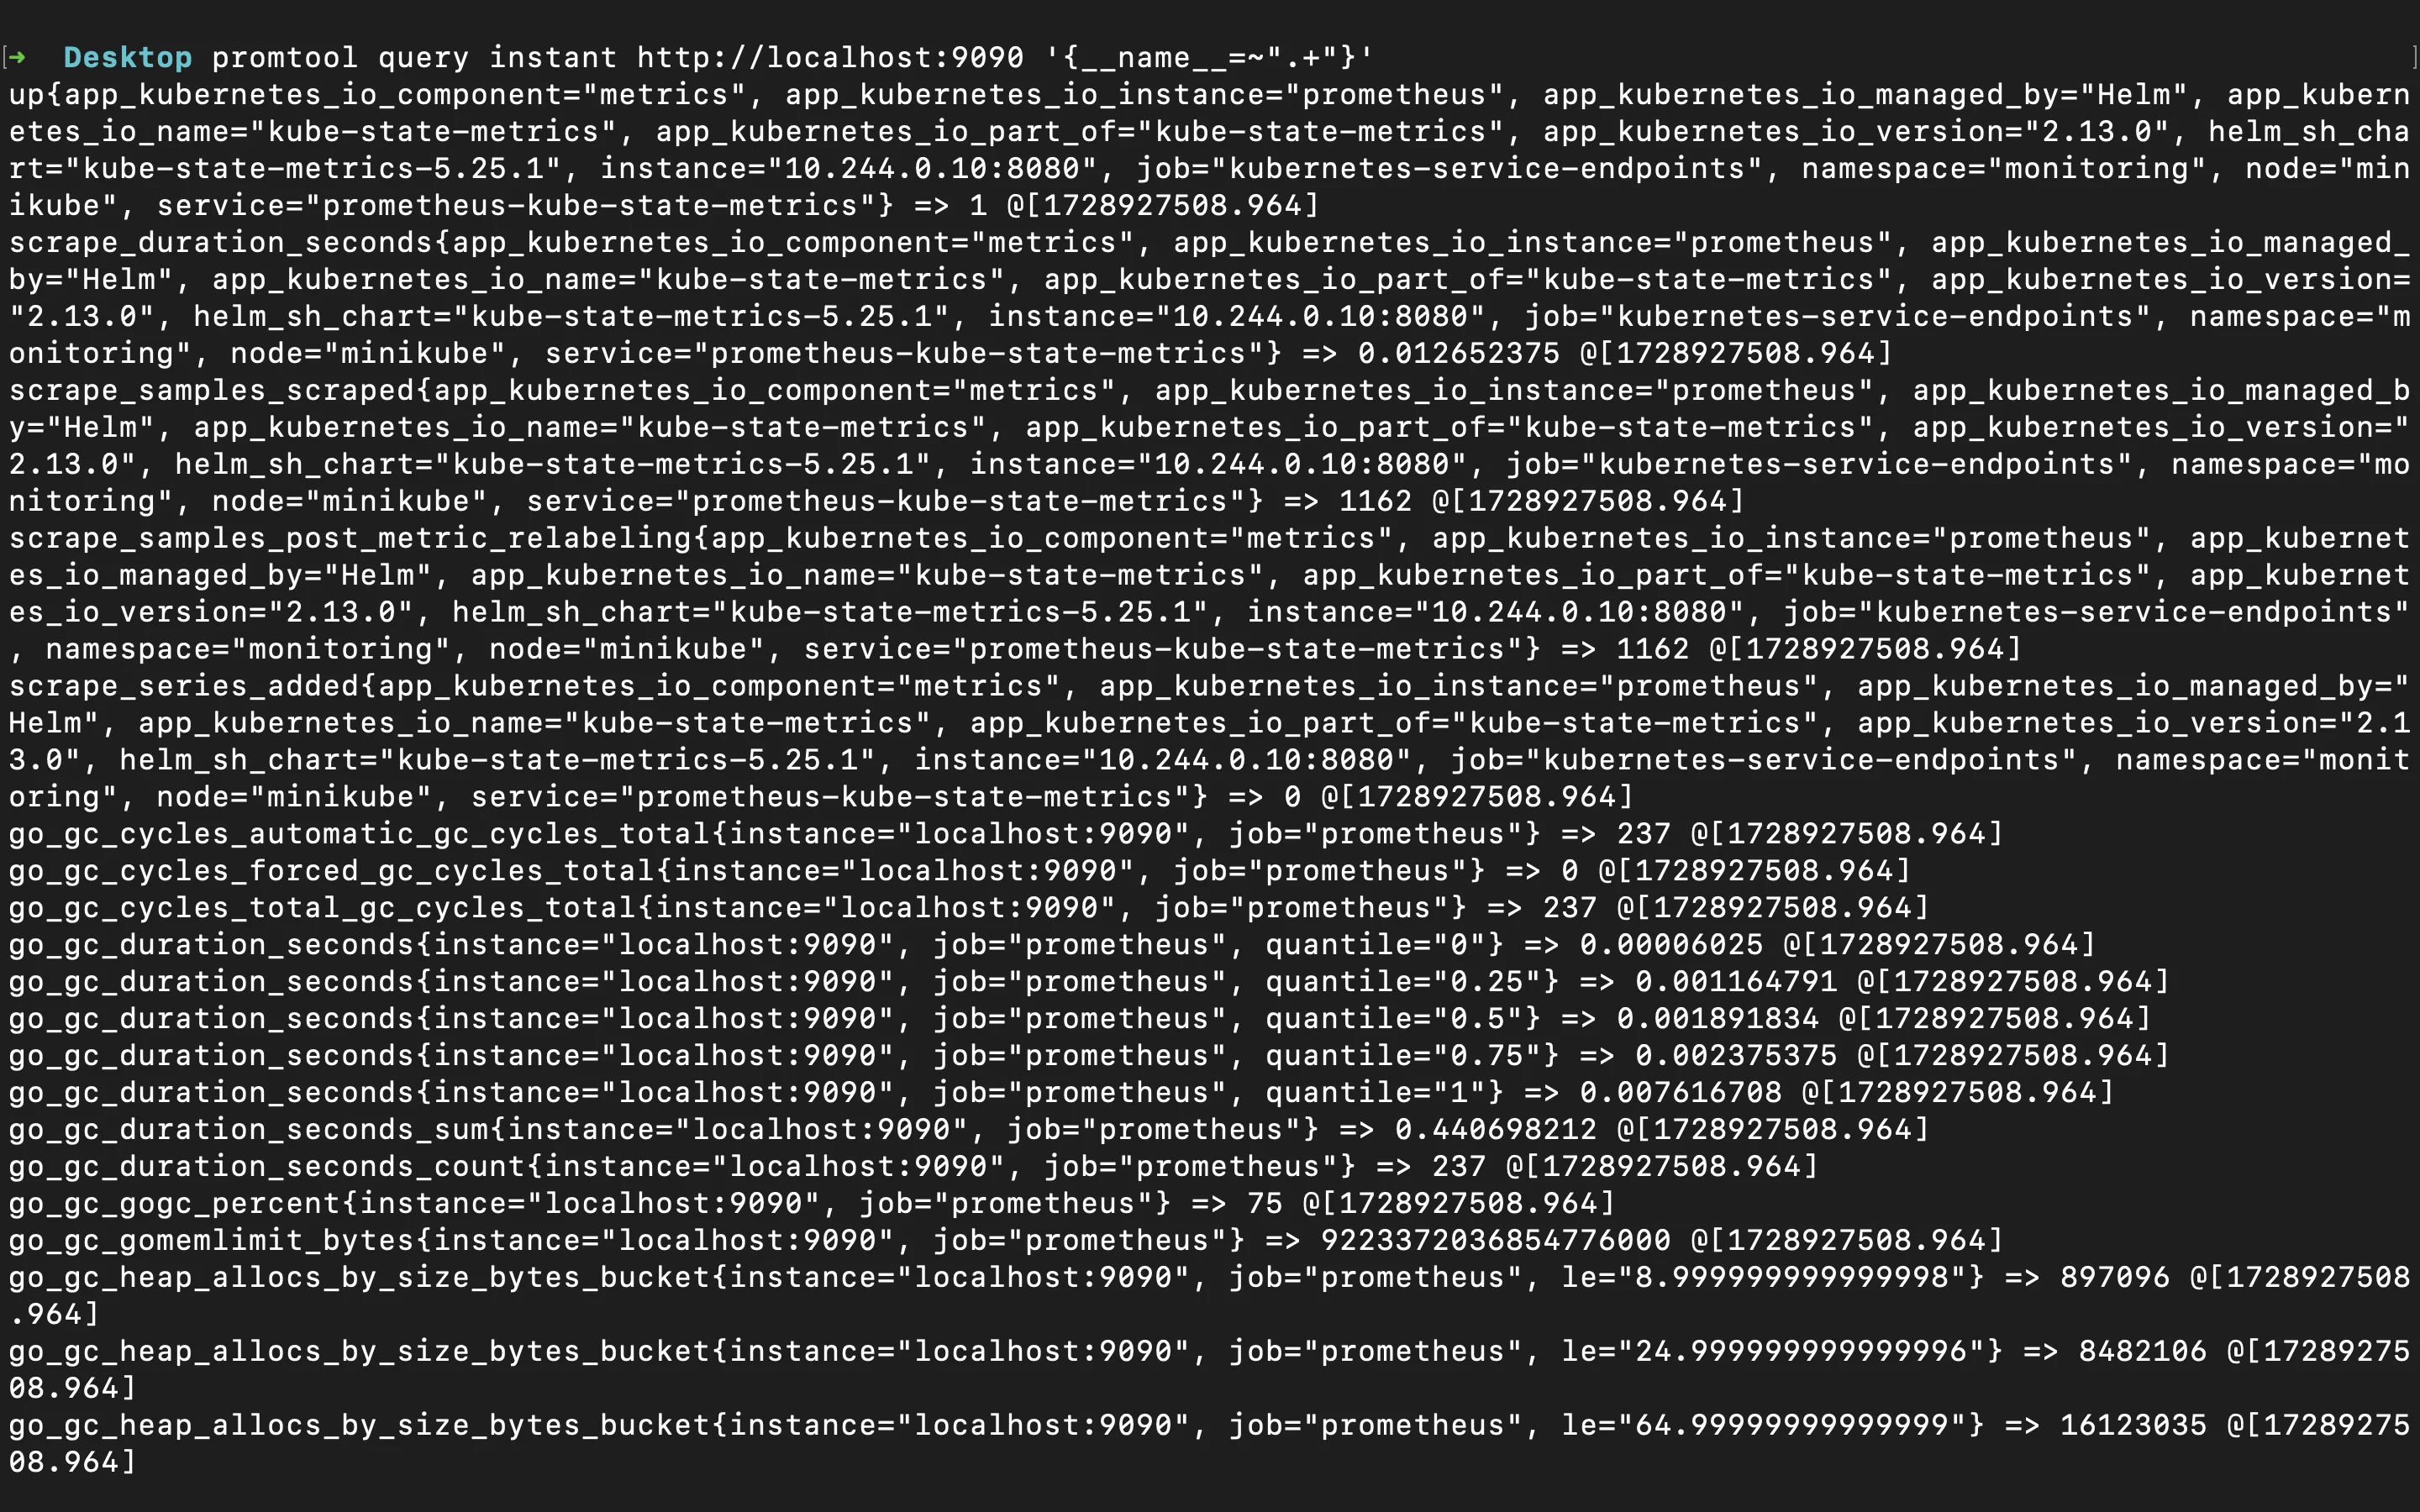
Using promtool to query prometheus metrics
Best Practices for Handling Large Volumes of Metrics
When dealing with large volumes of metrics in Prometheus, it's essential to follow certain best practices to ensure that your monitoring system remains efficient and manageable. Below are some key strategies to keep in mind:
Implement Naming Conventions: Establish consistent and meaningful naming conventions for your metrics. This helps you and your team understand what each metric represents at a glance. For instance, use names like
http_requests_totalfor a counter tracking total HTTP requests. Good naming practices make it easier to query and manage your metrics over time.Use Labels Effectively: Labels allow you to add dimensions to your metrics, offering richer insights into your data. For example, if you're measuring HTTP requests, you can include labels for different HTTP methods and endpoints, like
http_requests_total{method="GET",endpoint="/api/users"}. This lets you filter and aggregate metrics based on these dimensions, providing more detailed analysis.Be Cautious with High Cardinality: High cardinality occurs when a metric has too many unique label combinations, which can lead to performance issues. Labels that change frequently, such as user IDs, should be avoided to prevent excessive cardinality. Instead, focus on labels that give valuable, stable dimensions without overwhelming your system with millions of unique combinations.
Query Optimization: When querying a large dataset, it's crucial to optimize your queries to avoid fetching excessive data unnecessarily. Use time ranges and step intervals to manage the volume of data returned. For example:
{__name__=~".+"}[5m:1m]This query fetches data for all metrics over the last 5 minutes, with a 1-minute interval between data points. By setting specific time ranges and intervals, you reduce the data volume and speed up query execution.
Analyzing and Interpreting Prometheus Metrics
Once you've retrieved your metrics, the next step is analysis. Here are some techniques:
Identify Key Performance Indicators (KPIs): Focus on the key metrics that impact your service level objectives (SLOs) and service level agreements (SLAs). In Kubernetes, these may include pod CPU and memory usage, pod restarts, and network traffic. For example, metrics like
container_cpu_usage_seconds_totalorcontainer_memory_usage_bytesare essential for evaluating resource usage in your cluster.Spot Trends and Anomalies: Prometheus metrics help identify patterns or abnormalities over time. You can leverage PromQL functions like
rate()andincrease()to track resource utilization. For example, monitoring CPU usage trends in containers can help you detect issues before they escalate:rate(container_cpu_usage_seconds_total[5m])This query reveals the per-second rate of CPU usage by containers over a 5-minute window, helping identify spikes in resource consumption.
Analyze Counter Metrics with
rate()andincrease()Functions:For counter metrics (e.g., request counts), the
rate()function calculates the per-second average rate of increase over a specified time window, whileincrease()provides the total increase over that period. These functions are crucial for understanding throughput and performance trends. For example, to track pod restarts:increase(kube_pod_container_status_restarts_total[5m])This query highlights pod restart events over a 5-minute period, which can indicate stability issues in your deployments.
Combine Metrics: Create compound queries by combining multiple metrics to derive deeper insights. For instance, you might want to calculate the ratio of pods in a failed state compared to the total number of pods.
For example, to assess the error rate in your application, you can compare the number of failed requests (
http_requests_failed_total) to the total number of requests (http_requests_total). This gives a clearer view of your application's reliability.rate(kube_pod_status_failed[5m]) / rate(kube_pod_status_phase{phase="Running"}[5m])This query computes the percentage of failed pods relative to the total number of running pods in the last 5 minutes, helping assess the health of your cluster.
Enhancing Metric Collection with SigNoz
When working with Prometheus API to gather all metrics from an instance, pairing it with a comprehensive observability tool like SigNoz significantly enhances the way metrics are collected, visualized, and analyzed. Built on OpenTelemetry, the emerging industry standard for telemetry data, SigNoz offers a unified platform for monitoring your system.
OpenTelemetry’s support allows SigNoz to unify your Prometheus and Grafana metrics with traces and logs, delivering an end-to-end view of system performance. This results in a richer monitoring experience beyond what traditional setups offer.
SigNoz complements this setup by offering additional monitoring features:
- Unified Observability: Correlating metrics, traces, and logs, SigNoz gives a holistic view of your application's health. This feature helps in faster root cause identification.
- Custom Dashboards and Alerts: You can create real-time dashboards combining Prometheus metrics with traces for in-depth monitoring of key performance indicators (KPIs). Integrated alerting ensures that issues are caught early.
- Flexible Querying: SigNoz supports PromQL alongside its own query builder, empowering users to analyze telemetry data with a versatile querying system.
- Distributed Tracing: The platform’s tracing capabilities track requests across distributed services, helping pinpoint bottlenecks and optimize service performance.
By leveraging OpenTelemetry and combining traditional metrics with advanced tracing, SigNoz extends Prometheus' capabilities, providing a complete observability solution to ensure comprehensive system monitoring and faster issue resolution.
SigNoz Cloud is the easiest way to run SigNoz. Sign up for a free account and get 30 days of unlimited access to all features.
You can also install and self-host SigNoz yourself since it is open-source. With 24,000+ GitHub stars, open-source SigNoz is loved by developers. Find the instructions to self-host SigNoz.
Key Takeaways
- Retrieving all Prometheus metrics gives you complete visibility into your system's performance and health. Access to every available metric helps in detecting anomalies, understanding trends, and pinpointing potential issues before they escalate, ensuring reliable and efficient operations.
- Prometheus offers robust mechanisms for querying and retrieving metrics. The Prometheus HTTP API allows you to fetch raw metrics directly, while PromQL (Prometheus Query Language) lets you write flexible and powerful queries to filter, aggregate, and analyze those metrics in real time. Understanding these tools is essential for efficient data retrieval and analysis.
- Handling large volumes of metrics efficiently is key to maintaining system performance. Employ best practices such as effective labeling of metrics to avoid high cardinality, which can slow down queries. Additionally, optimize your queries by using time ranges, step intervals, and recording rules, which can reduce query load on the server and improve response times.
- Tools like SigNoz can complement your Prometheus setup by enhancing analysis and visualization capabilities. SigNoz integrates well with Prometheus and provides an intuitive interface for creating custom dashboards, setting alerts, and gaining deeper insights into your metrics. It also supports distributed tracing, helping you get a full picture of application performance, especially in microservices environments.
FAQs
What's the difference between scraping metrics and using the Prometheus API?
Scraping is when Prometheus collects metrics from defined targets at regular intervals. The Prometheus API, on the other hand, is used to query and retrieve metrics that have already been collected and stored in the time-series database. Scraping gathers data; the API provides access to that data for analysis.
How can I optimize queries when retrieving all metrics from Prometheus?
To optimize your queries, consider using time ranges and step intervals to reduce the amount of data returned. Avoid querying metrics with high-cardinality labels, as they can slow down performance. Recording rules can also help by precomputing frequently-used complex queries and storing their results for faster access.
Is it possible to retrieve metrics from multiple Prometheus instances simultaneously?
Yes, you can either use Prometheus federation to aggregate metrics across instances or implement tools like Thanos, which allows you to query multiple Prometheus instances seamlessly. You can also make parallel API requests to different Prometheus instances manually.
How frequently should I query for all metrics in a production environment?
Query frequency should be based on the level of detail required and the capacity of your system. Frequent queries, such as every few seconds, can overload your Prometheus server. For general monitoring, querying every few minutes works well. For real-time insights, you might want to explore push-based systems or streaming solutions instead.
