Is It Possible to Use Grafana Without Prometheus? - Prometheus Monitoring
Grafana is widely known for its powerful data visualization capabilities, often used in conjunction with Prometheus for monitoring and metrics collection. However, many users wonder if it is possible to use Grafana without Prometheus. The answer is yes! Grafana's versatility allows it to support a wide range of data sources, making it a flexible tool for various use cases.
In this article, we will explore the possibility and benefits of using Grafana without Prometheus, and provide a step-by-step guide on setting up Grafana with MySQL as the data source.
Understanding Grafana
Grafana is an open-source platform for monitoring and observability that excels in visualizing data from a variety of sources. It offers a highly customizable dashboarding experience, allowing users to create, explore, and share dashboards that display data from different systems.
Common Data Sources Supported by Grafana
Grafana supports numerous data sources out-of-the-box, including:
- MySQL
- InfluxDB
- Elasticsearch
- PostgreSQL
- Prometheus
- Graphite
- Cloudwatch
- Azure Monitor
These integrations enable users to visualize data from various databases and services, making Grafana a versatile tool for many applications.
Benefits of Using Grafana Without Prometheus
- Flexibility in Data Source Selection: Grafana's support for multiple data sources means you can choose the one that best fits your needs, whether it's a SQL database, a time-series database, or a cloud service.
- Simplified Architecture: By using Grafana with a data source like MySQL, you can simplify your monitoring architecture, which might be beneficial for specific use cases.
- Cost Savings: Depending on your requirements, using a single data source can reduce complexity and costs associated with managing multiple monitoring tools.
Practical Example: Setting Up Grafana with MySQL
Let's dive into a practical example of setting up Grafana with MySQL as the data source.
Step 1: Install Grafana
Download and install Grafana from the official website. Follow the installation instructions for your operating system.
Step 2: Set Up MySQL and Create a Sample Database
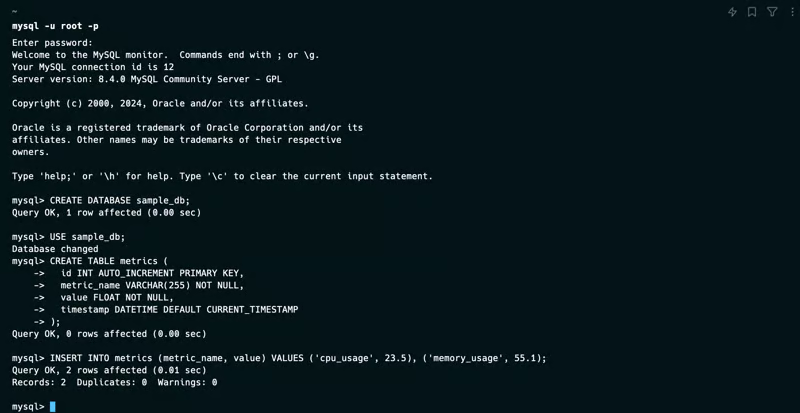
Install MySQL on your system if it's not already installed. Create a sample database and table for storing your data:
CREATE DATABASE sample_db;
USE sample_db;
CREATE TABLE metrics (
  id INT AUTO_INCREMENT PRIMARY KEY,
  metric_name VARCHAR(255) NOT NULL,
  value FLOAT NOT NULL,
  timestamp DATETIME DEFAULT CURRENT_TIMESTAMP
);
INSERT INTO metrics (metric_name, value) VALUES ('cpu_usage', 23.5), ('memory_usage', 55.1);
Step 3: Configure Grafana to Connect to MySQL
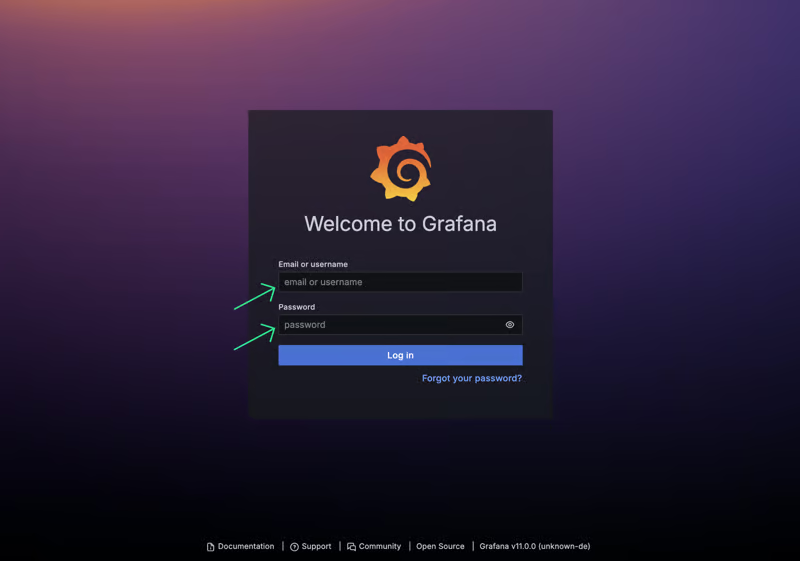
- Open Grafana in your browser (default URL is http://localhost:3000).
- Log in with the default credentials (admin/admin, you an read detailed guide to login here).
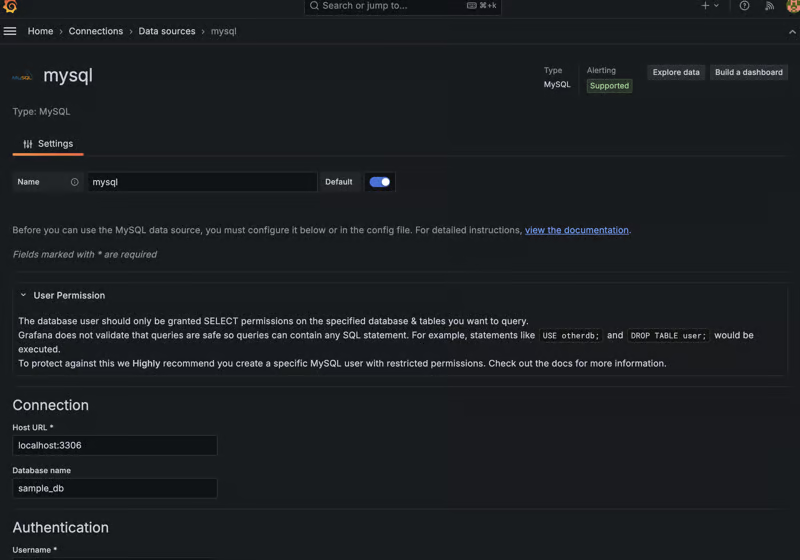
- Navigate to Configuration > Data Sources and click Add data source.

- Select MySQL from the list of data sources.
- Enter the necessary connection details (e.g., host, database name, user, and password) and click Save & Test to verify the connection.
- Host URL will be likely
localhost:3306 - Database Name:
sample_db - Add your database username and password in the authentication.
- Host URL will be likely
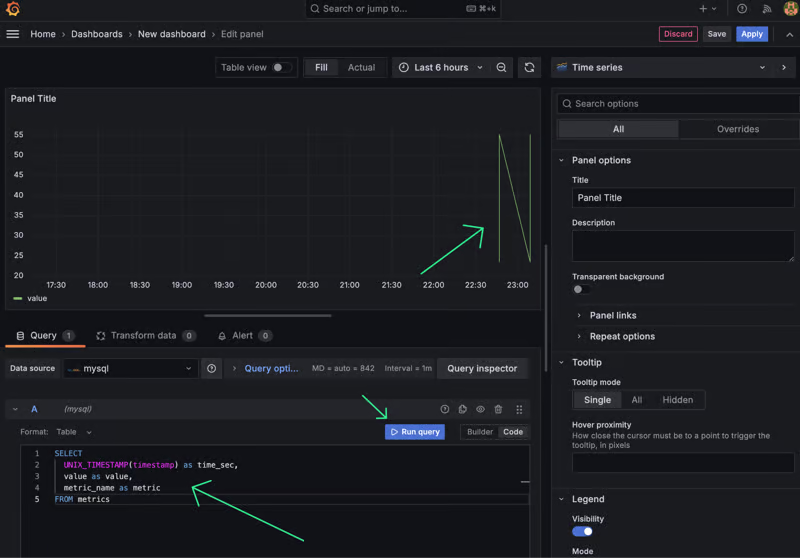
Step 4: Create a Simple Dashboard Using MySQL Data
- Navigate to Create > Dashboard and click Add new panel.
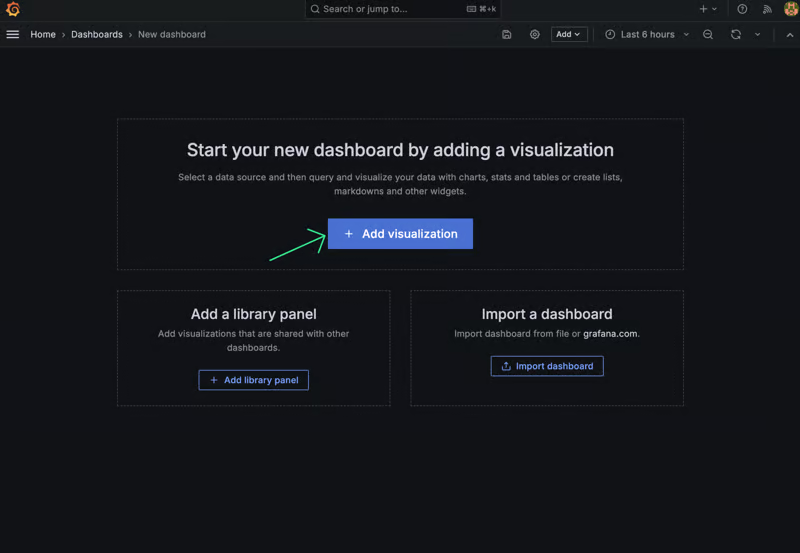
- Select your MySQL data source.
- Write a simple SQL query to fetch data from your sample table:
SELECT
  UNIX_TIMESTAMP(timestamp) as time_sec,
  value as value,
  metric_name as metric
FROM metrics
Customize the visualization as needed and save your dashboard.
Real-World Use Cases
Many organizations leverage Grafana with data sources other than Prometheus to meet specific needs:
- Web Application Monitoring: Using MySQL or PostgreSQL to track user interactions and performance metrics.
- Business Analytics: Visualizing data from SQL databases to monitor KPIs and other business metrics.
- IoT Data Visualization: Utilizing InfluxDB to collect and visualize sensor data.
Conclusion
Grafana is a versatile tool that can be used with a variety of data sources beyond Prometheus. This flexibility allows users to tailor their monitoring and visualization setup to their specific needs, simplifying architecture and potentially reducing costs.
For a deeper comparison between Prometheus and Grafana, you can check out this comprehensive article.
