How to Implement Moving Averages in Grafana Dashboards
Grafana dashboards offer powerful visualization capabilities for time series data, but can you effectively implement moving averages to smooth out fluctuations and identify trends? The answer is a resounding yes. Grafana provides multiple methods to calculate and display moving averages, enhancing your ability to analyze data patterns and make informed decisions. This comprehensive guide will walk you through the process of implementing moving averages in Grafana, from basic concepts to advanced techniques.
Understanding Moving Averages in Grafana
Moving averages are statistical calculations used to analyze data points by creating a series of averages of different subsets of the full data set. In Grafana, moving averages help smooth out short-term fluctuations and highlight longer-term trends or cycles.
Types of Moving Averages Supported in Grafana
Grafana supports several types of moving averages:
- Simple Moving Average (SMA): Calculates the arithmetic mean of a given set of values over a specified period.
- Weighted Moving Average (WMA): Assigns different weights to data points, typically giving more importance to recent data.
- Exponential Moving Average (EMA): Applies more weight to recent data points, creating a more responsive average to new information.
Benefits of Using Moving Averages in Grafana Dashboards
Moving averages are a valuable tool in Grafana dashboards, helping to reveal meaningful trends in time-series data by reducing noise and enhancing data interpretation. Here are some key benefits:
- Smoothing out data noise for clearer trend visualization
- Identifying support and resistance levels in time series data
- Generating potential buy or sell signals in financial data
- Highlighting seasonal patterns in cyclical data
Common Use Cases for Moving Averages in Data Visualization
Here are some common use cases where moving averages can enhance data insights:
- IT Operations: Monitoring server response times or resource utilization
- Finance: Analyzing stock prices or trading volumes
- E-commerce: Tracking sales trends or customer engagement metrics
- IoT: Smoothing sensor data for more accurate readings
Implementing Moving Averages Using Grafana's Built-in Features
Grafana offers native support for moving averages through its query language and built-in functions. Here's how to implement a simple moving average:
Open your Grafana dashboard and edit the panel where you want to add a moving average.
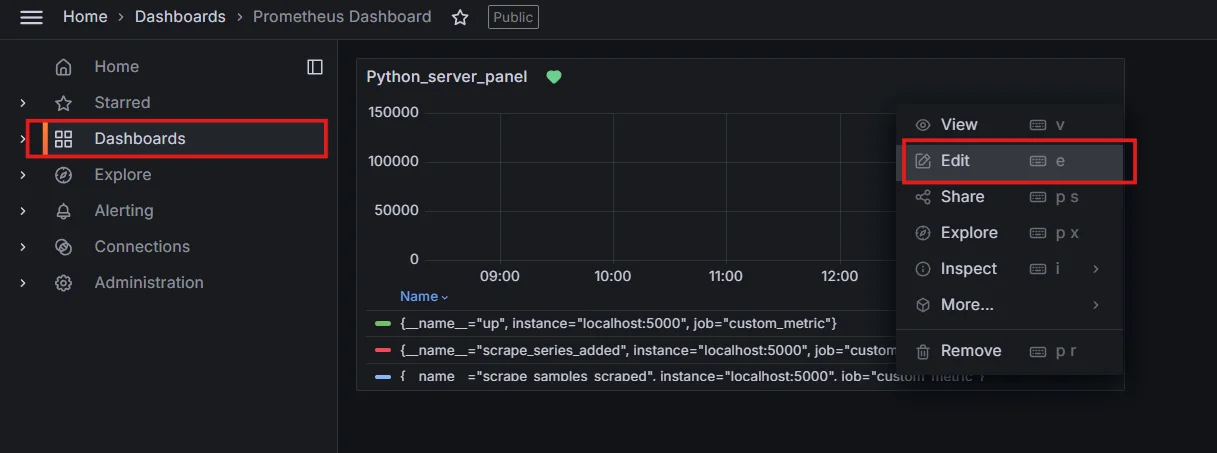
Editing panels in Grafana Dashboard In the query editor, use the
moving_average()function. The basic syntax is:moving_average(metric, windowSize)Replace
metricwith your data source andwindowSizewith the number of data points to include in the average.For example, to calculate a 7-day moving average of daily sales:
moving_average(sales_daily, 7)Note:
- The above query holds true only with InfluxDB as the data source, you can find the details in further sections for moving averages in other data sources.
- The moving average function needs to be used with the InfluxDB query to get the desired output, above example is just a part of it.
Adjust the time range and refresh rate of your panel to ensure you have enough data points for meaningful averages.
Best Practices for Optimizing Moving Average Performance in Grafana
Moving averages are commonly used in Grafana to smooth out time-series data, making it easier to identify trends. However, improper use can lead to performance issues or inaccurate insights.
To get the best results, follow these best practices for optimizing moving averages in your Grafana dashboards.
- Use appropriate time windows: Too small, and you'll see too much noise; too large, and you'll miss important short-term trends.
- Consider data frequency: Match your moving average window to your data collection interval for consistent results.
- Pre-aggregate data when possible: For large datasets, pre-calculate averages at the data source level to improve Grafana's performance.
Implementing Moving Averages with Different Data Sources
In Grafana, moving averages can be implemented differently depending on the data source you're using. Each data source has its own syntax and functions for calculating moving averages. Below are examples of how to implement moving averages with three common data sources: Prometheus, InfluxDB, and MySQL.
Moving Averages with Prometheus
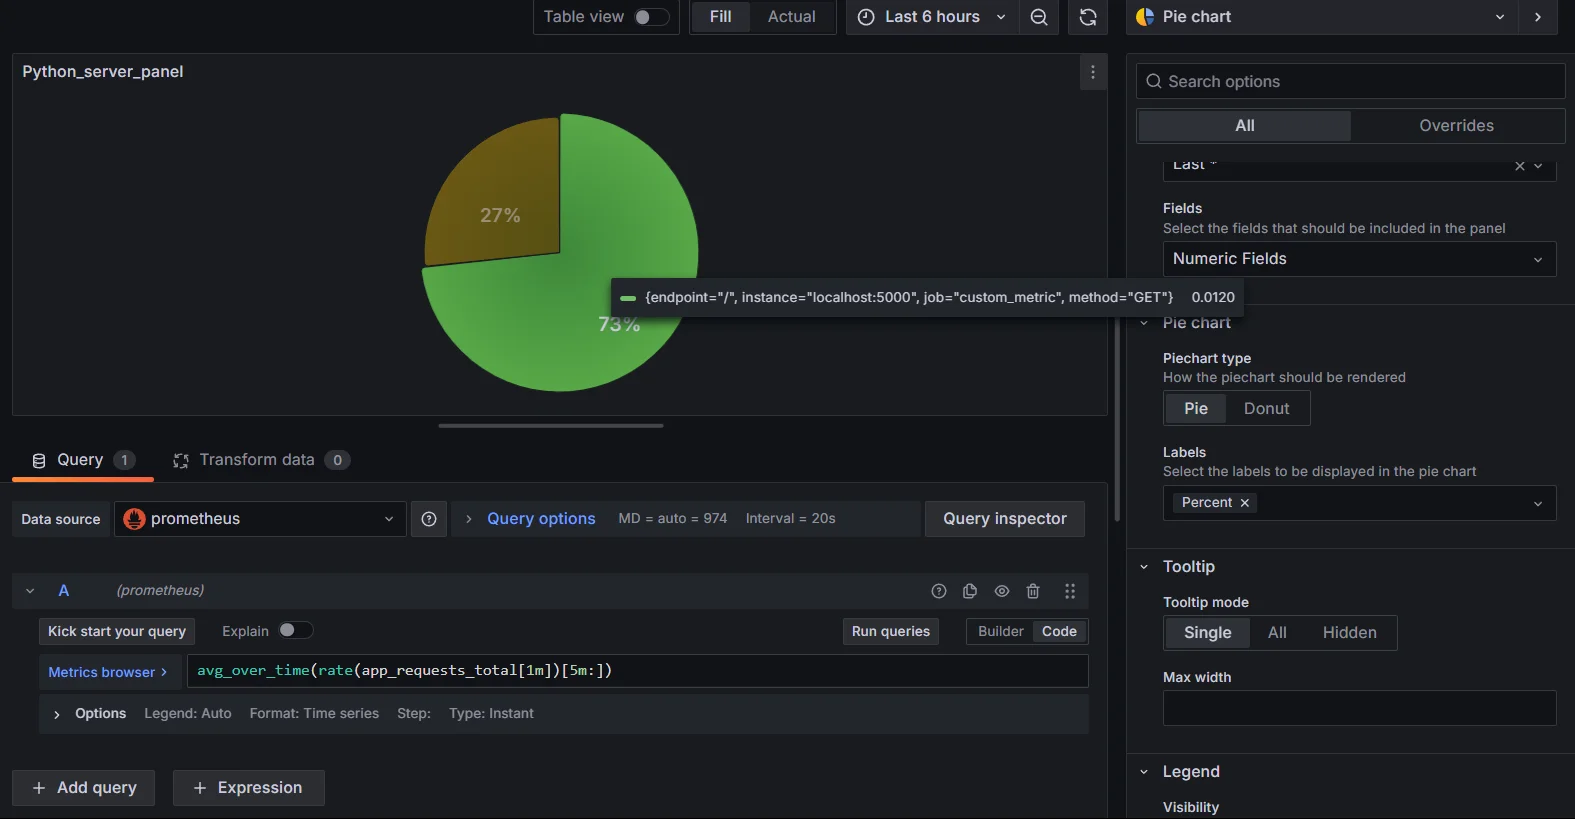
Prometheus does not have a built-in moving_average() function like some other time-series databases (e.g., InfluxDB). However, you can approximate a Simple Moving Average (SMA) in Prometheus using the avg_over_time() function, which calculates the average value over a specified time range.
Here's how you can implement a moving average in Prometheus:
The avg_over_time() function calculates the average value of a time series over a specified window of time.
Example: 5-minute moving average for HTTP requests
avg_over_time(rate(app_requests_total[1m])[5m:])
Limitations
- Prometheus does not natively support complex moving averages like Weighted Moving Averages (WMA) or Exponential Moving Averages (EMA).
- For advanced moving averages, use external tools like Grafana transformations or InfluxDB.
Moving Averages with InfluxDB
InfluxDB provides native functions like moving_average() and exponential_moving_average() for time-series analysis. This makes it more flexible for calculating various types of moving averages.
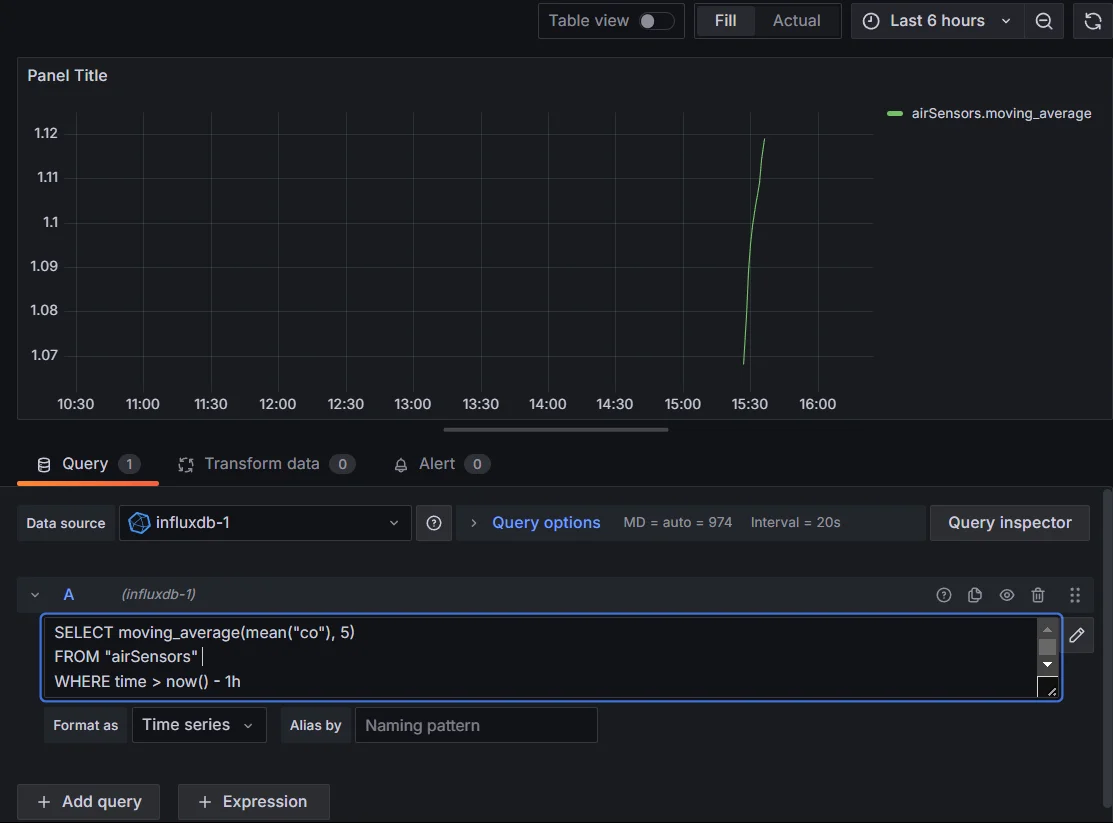
Simple Moving Average (SMA) in InfluxDB
SELECT moving_average(mean("co"), 5)
FROM "airSensors"
WHERE time > now() - 1h
GROUP BY time(1m)
Query Explanation:
- Calculates a 5-point moving average of the mean CO levels (carbon monoxide) from the "airSensors" measurement.
- Uses data from the last hour.
- Groups the data into 1-minute intervals to ensure consistent time windows for the moving average calculation.
This smooths out fluctuations in CO levels, providing a clearer trend over time.
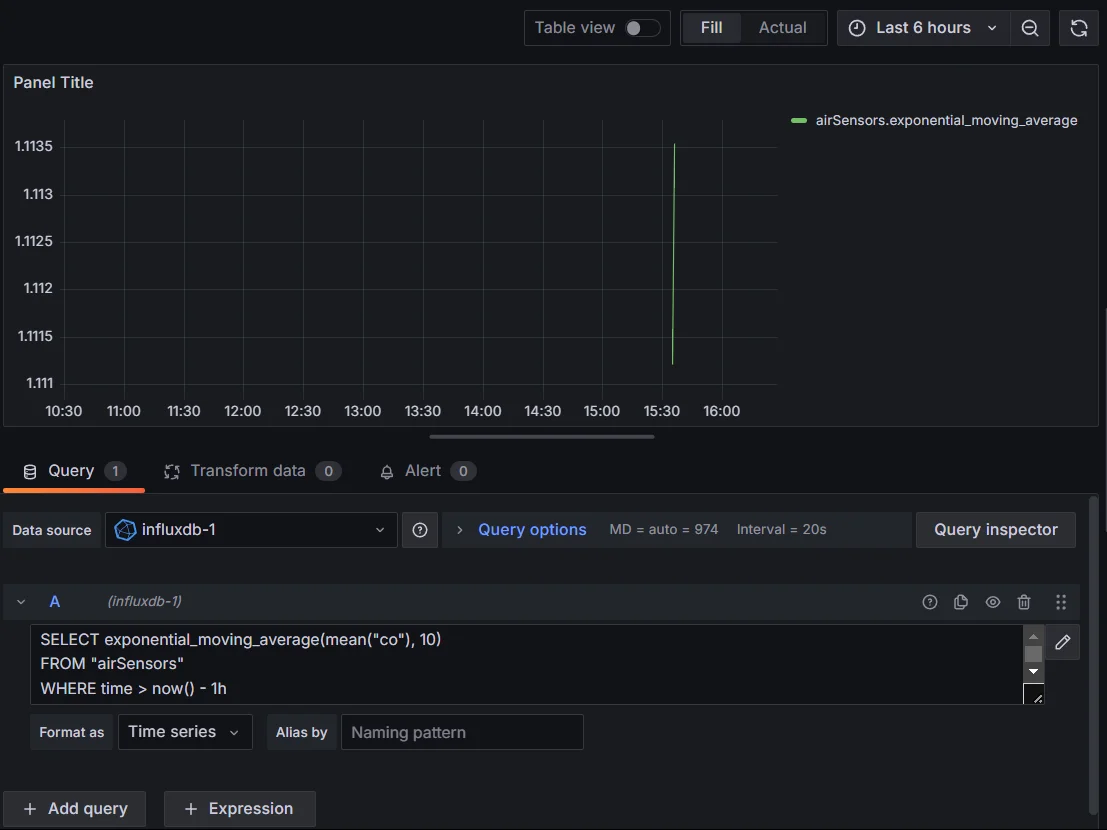
Exponential Moving Average (EMA) in InfluxDB
SELECT exponential_moving_average(mean("co"), 10)
FROM "airSensors"
WHERE time > now() - 1h
GROUP BY time(1m)
Query Explanation:
exponential_moving_average(mean("co"), 10): This calculates the Exponential Moving Average (EMA) for the "co" (carbon monoxide) field, with a smoothing factor applied over the last 10 data points.FROM "airSensors": Refers to the measurement (table) where the data is stored.WHERE time > now() - 1h: Filters the data to the last hour.GROUP BY time(1m): Groups the data into 1-minute intervals, which is necessary for the EMA calculation.
This query will provide a smoother trend that gives more weight to recent data points, making it more sensitive to recent changes.
Weighted Moving Average (WMA)
For WMA, you need to manually calculate the weighted sum by applying custom logic in your queries or in Grafana. InfluxDB does not have a built-in WMA function.
Moving Averages with MySQL
In MySQL, moving averages can be calculated using SQL queries. There are no direct functions like in time-series databases, so you’ll need to construct your query manually.
Simple Moving Average (SMA) in MySQL
In MySQL, functions like moving_average() and exponential_moving_average() are not in-built. You need to write complex SQL Queries to calculate them.
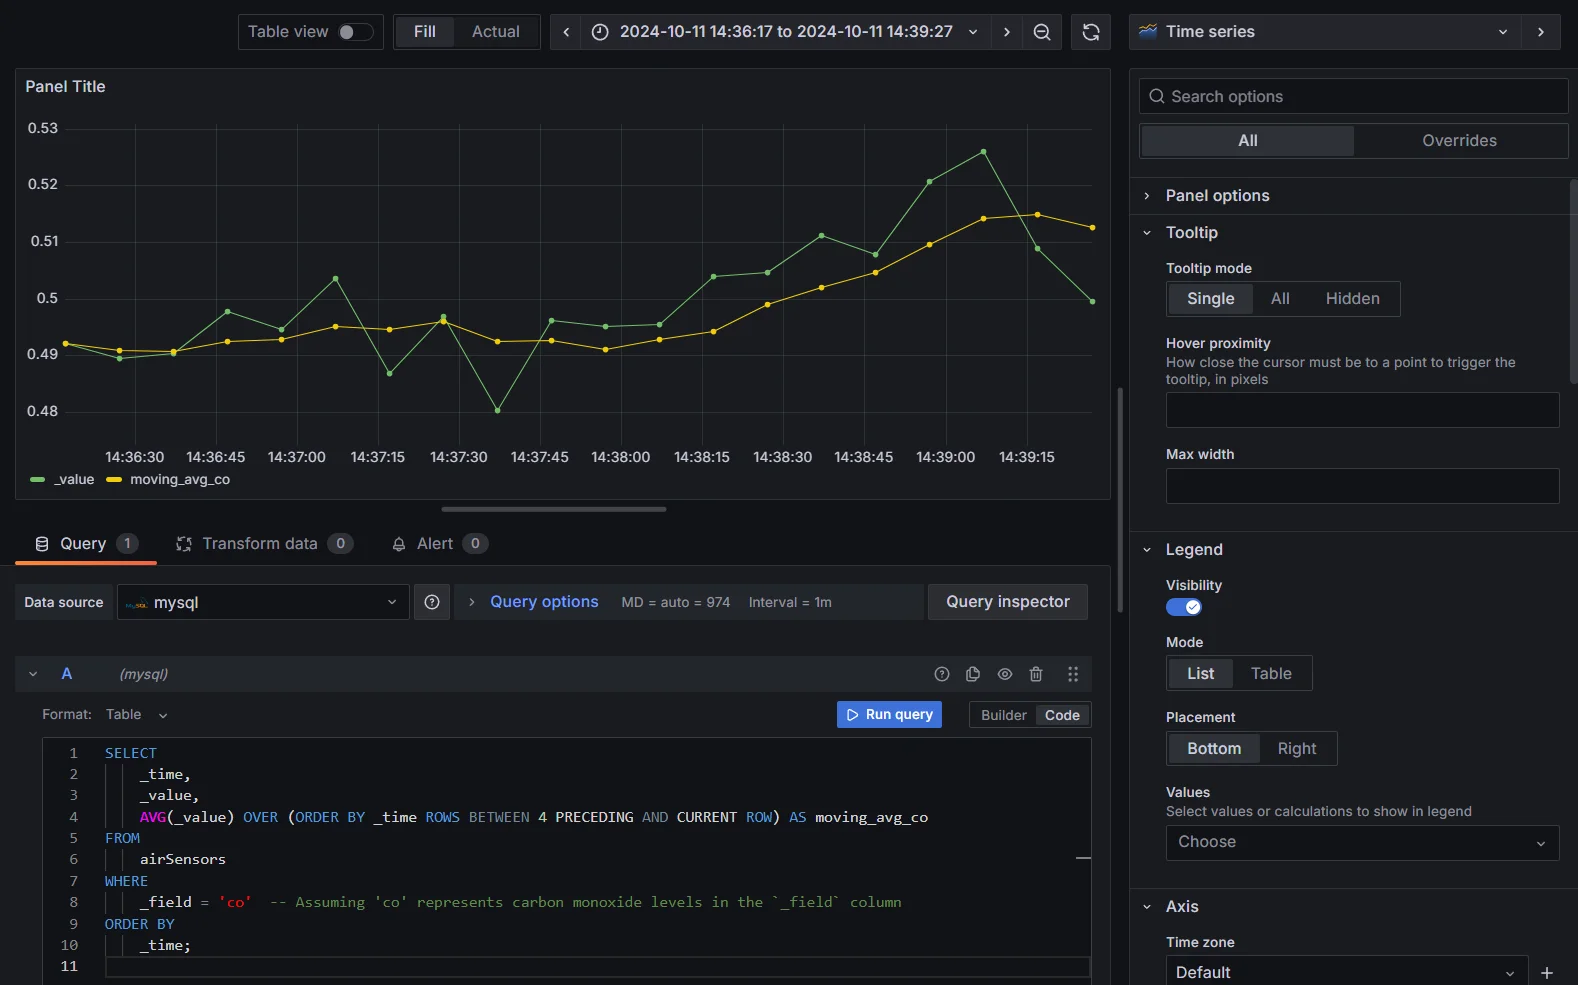
Example: To calculate a 5-point moving average of the mean CO levels from the airSensors table in SQL, assuming the table has columns such as _value (representing CO levels), _time (timestamp), and sensor_id for identifying sensors, you can use a window function to compute the moving average over a rolling window of 5 points.
SELECT
    _time,
    _value,
    AVG(_value) OVER (ORDER BY _time ROWS BETWEEN 4 PRECEDING AND CURRENT ROW) AS moving_avg_co
FROM
    airSensors
WHERE
    _field = 'co'  -- Assuming 'co' represents carbon monoxide levels in the `_field` column
ORDER BY
    _time;
Query Explanation:
- SELECT Clause:
_time: Displays timestamps of measurements._value: Shows carbon monoxide levels.AVG(_value) OVER (...) AS moving_avg_co: Calculates a 5-point moving average of_value.
- Window Function -
AVG(_value) OVER (ORDER BY _time ROWS BETWEEN 4 PRECEDING AND CURRENT ROW): Computes the average of the current value and the four preceding values. FROM airSensors: The data source is theairSensorstable.WHERE _field = 'co': Filters results to include only carbon monoxide readings.ORDER BY _time: Results are sorted chronologically.
Exponential Moving Average (EMA) in MySQL
To calculate EMA in MySQL, you need a recursive query. Here’s an example:
Step 1: Set the Smoothing Factor
SET @alpha = 0.3;
Step 2: Create the Temporary Table
CREATE TEMPORARY TABLE temp_ema (
    _time DATETIME,
    _value FLOAT,
    ema FLOAT
)
Step 3: Insert Initial Data into the Temporary Table
INSERT INTO temp_ema (_time, _value, ema)
SELECT
    _time,
    _value,
    _value AS ema  -- Initialize EMA with the first value
FROM
    airSensors
WHERE
    _field = 'co'
ORDER BY
    _time
LIMIT 1;  -- Only insert the first row for initialization
Step 4: Calculate the EMA for Subsequent Values
Use a Cursor for Iteration
First, we need to define a procedure that handles EMA calculation using a cursor. This is a more efficient way to process row-by-row without reopening the temporary table.
DELIMITER //

CREATE PROCEDURE CalculateEMA()
BEGIN
    DECLARE done INT DEFAULT FALSE;
    DECLARE current_time DATETIME;
    DECLARE current_value FLOAT;
    DECLARE current_ema FLOAT DEFAULT NULL;

    DECLARE cur CURSOR FOR
        SELECT _time, _value FROM airSensors WHERE _field = 'co' ORDER BY _time;

    DECLARE CONTINUE HANDLER FOR NOT FOUND SET done = TRUE;

    OPEN cur;

    read_loop: LOOP
        FETCH cur INTO current_time, current_value;
        IF done THEN
            LEAVE read_loop;
        END IF;

        -- Calculate EMA
        SET current_ema = IF(current_ema IS NULL, current_value, (@alpha * current_value + (1 - @alpha) * current_ema));

        -- Insert into temporary table
        INSERT INTO temp_ema (_time, _value, ema) VALUES (current_time, current_value, current_ema);
    END LOOP;

    CLOSE cur;
END //

DELIMITER ;
Call the Procedure to Calculate EMA
CALL CalculateEMA()
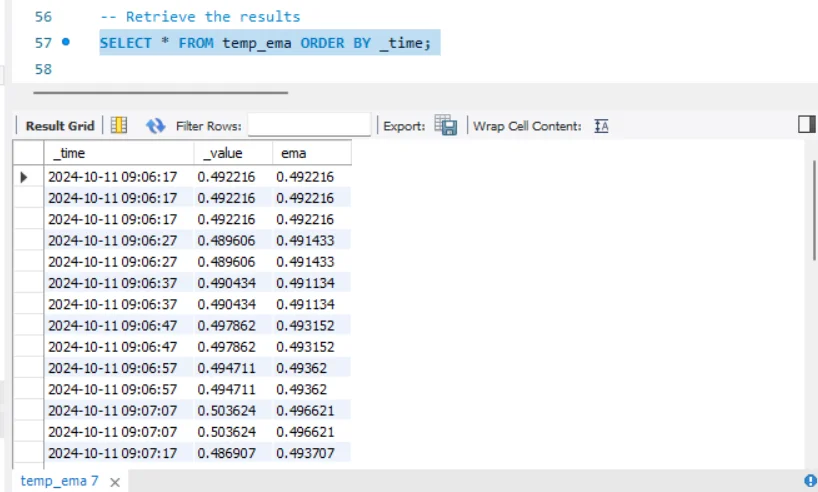
Step 5: Retrieve the Results
SELECT * FROM temp_ema ORDER BY _time;
Limitations
- Calculating moving averages in MySQL is more complex and requires more manual handling compared to time-series databases like InfluxDB.
- You may need to preprocess the data before visualizing it in Grafana.
Best Practices for Different Data Sources
- Prometheus: Use
avg_over_time()for basic moving averages. For complex requirements, combine Prometheus with Grafana transformations or InfluxDB. - InfluxDB: Use built-in functions like
moving_average()orexponential_moving_average()for various types of moving averages. InfluxDB is well-suited for advanced time-series analysis. - MySQL: Use SQL window functions or recursive queries for calculating moving averages. While MySQL is not ideal for time-series analysis, it works for smaller datasets or applications already using MySQL as the primary database.
Customizing Moving Average Visualizations
To make your moving average visualizations more effective:
Select appropriate chart types:
Line charts work well for most moving averages, while area charts can highlight the difference between raw data and smoothed trends.
Adjust color schemes and line styles:
- Use contrasting colors for raw data and moving averages
- Make moving average lines thicker or dashed for easy differentiation
Add annotations and alerts:
- Set up alerts when moving averages cross certain thresholds
- Use annotations to mark significant events that may impact trends
Combine moving averages with other metrics:
- Display multiple moving averages with different time windows on the same graph
- Show volume or other related metrics below price charts for comprehensive analysis
Enhancing Observability with SigNoz and Moving Averages
SigNoz allows you to implement moving averages directly in its dashboards using built-in query functions. If you're already familiar with Grafana's interface, you'll find the process similar, but with additional observability features like distributed tracing.
Why Use SigNoz Over Grafana?
While Grafana is highly flexible, SigNoz offers deeper insights into system performance by combining metrics with traces. For large-scale systems or applications requiring high levels of observability, SigNoz provides additional functionality that complements moving averages, such as real-time tracking of slow requests.
SigNoz is an open-source observability platform that provides enhanced metrics, distributed tracing, and logging capabilities. It offers robust support for moving averages and other statistical functions, making it a powerful alternative to Grafana.
SigNoz Cloud is the easiest way to run SigNoz. Sign up for a free account and get 30 days of unlimited access to all features.
You can also install and self-host SigNoz yourself since it is open-source. With 24,000+ GitHub stars, open-source SigNoz is loved by developers. Find the instructions to self-host SigNoz.
SigNoz provides built-in support for moving averages in its dashboards, allowing you to:
- Apply moving averages to various metrics with a user-friendly interface
- Combine moving averages with other observability data for holistic analysis
- Leverage SigNoz's distributed tracing to correlate moving average trends with specific system events or user actions
Advanced Techniques for Moving Average Analysis
To take your moving average analysis to the next level:
Implement dynamic time windows:
Use variables in Grafana to allow users to adjust the moving average window size on the fly:
moving_average(metric, $window_size)Note: The above query works only with InfluxDB as the data source.
Combining Moving Averages with Statistical Functions:
Grafana allows you to combine moving averages with other statistical functions. For example;
You can calculate the moving average and analyze its variability by adding standard deviation. This can help you understand the volatility around the average values:
SELECT moving_average(mean("co"), 5), stddev("co")
FROM "airSensors"
GROUP BY time(1m)
This query will return both the moving average of the
cosensor data and the standard deviation over time. You can visualize both metrics on the same graph for comparison.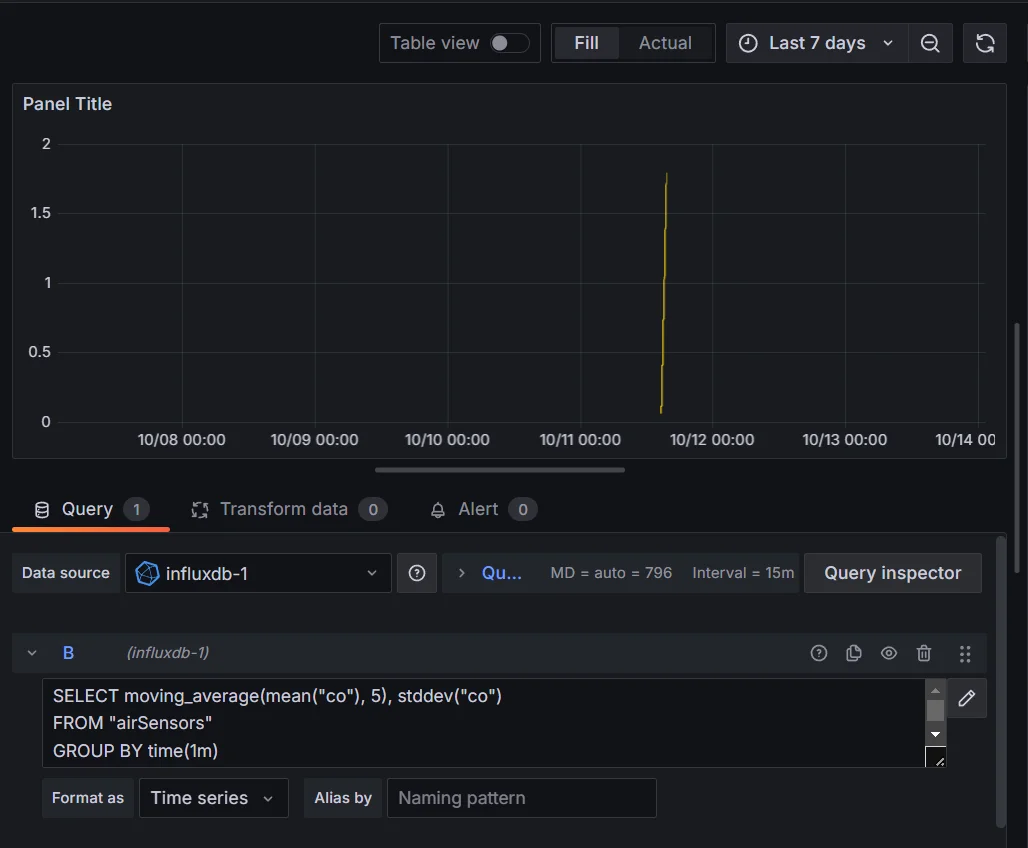
Combining Moving Averages with Statistical Functions Create custom panels for specialized visualizations: Develop plugins that offer unique ways to display moving averages, such as ribbon charts or multi-timeframe overlays.
Key Takeaways
- Moving averages in Grafana smooth data and identify trends across various data sources and industries.
- Grafana provides multiple implementation methods, including built-in functions and transformations.
- Customization options allow for tailored moving average visualizations to suit specific analysis needs.
- Advanced techniques and tools like SigNoz can enhance moving average analysis for comprehensive observability.
FAQs
How do I choose the right time window for my moving average in Grafana?
Consider your data's frequency and the trends you want to highlight. Shorter windows (e.g., 7-day) show more detail but can be noisy, while longer windows (e.g., 30-day) smooth out short-term fluctuations but may lag behind rapid changes.
Can I apply moving averages to multiple metrics simultaneously in Grafana?
Yes, you can apply moving averages to multiple metrics in the same panel. Use separate queries or transformations for each metric, and ensure clear labeling to distinguish between different averages.
What's the difference between simple and exponential moving averages in Grafana?
Simple moving averages (SMA) give equal weight to all data points in the window. Exponential moving averages (EMA) assign more weight to recent data, making them more responsive to new trends but potentially more volatile.
How can I export my Grafana moving average calculations for further analysis?
Use Grafana's CSV export feature to download panel data, including moving averages. For more complex needs, consider using Grafana's API to programmatically extract data or integrate with external analysis tools.

