Prometheus Monitoring 101 - A Beginner's Guide
Prometheus, an open-source monitoring and alerting toolkit, has emerged as a popular choice for DevOps teams and site reliability engineers. This guide will walk you through the fundamentals of Prometheus, helping you understand its core concepts, set up your first instance, and leverage its powerful features for effective system monitoring.
What is Prometheus Monitoring?
Prometheus is an open-source monitoring and alerting toolkit built for reliability and scalability. It’s widely used to track performance metrics in systems and applications, offering a comprehensive solution for time-series data collection and analysis.
Developed by SoundCloud in 2012, Prometheus was created to address the need for robust monitoring in dynamic, cloud-native environments. It became open-source in 2015 and is now a leading monitoring tool, maintained by the Cloud Native Computing Foundation (CNCF).
Key Features of Prometheus
Some of the key features of Prometheus include:
- Multi-Dimensional Data Model: Prometheus stores time-series data using a multi-dimensional model. Each metric is uniquely identified by its name and labels (key-value pairs), making it easy to filter and analyze data across various dimensions.
- Flexible Query Language (PromQL): Prometheus uses PromQL (Prometheus Query Language), a powerful query language for selecting, aggregating, and manipulating time-series data. PromQL enables complex queries for detailed insights and performance analysis.
- Autonomous Server Nodes: Prometheus operates with autonomous server nodes, meaning each node collects and stores its own data independently. This decentralized setup enhances scalability and ensures fault tolerance, removing the need for a centralized database.
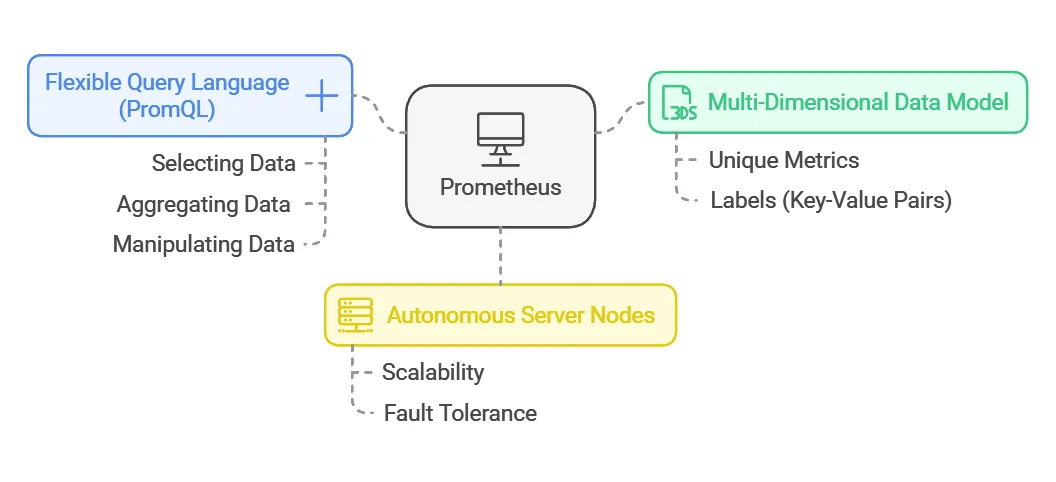
Unlike traditional monitoring systems like Nagios or Zabbix, Prometheus is optimized for dynamic environments, particularly in cloud-native architectures. Prometheus uses a pull-based model for data collection, in contrast to the push-based methods used by many other systems. This gives Prometheus flexibility in monitoring services that are constantly changing, making it a powerful tool for modern infrastructure.
Where is Prometheus Used?
- Server & Cloud Monitoring: Track resource usage like CPU, memory, and network activity.
- Application Monitoring: Monitor APIs, database performance, and response times.
- Kubernetes & Microservices: Automatically detect and track containerized applications.
- Business Insights: Measure website traffic, transactions, and system availability.
Where is Prometheus Not Used?
Prometheus is great for time-series monitoring but not ideal for:
- Log Management: Designed for numerical metrics, not raw logs. Use SigNoz, ELK Stack or Loki instead.
- Long-Term Storage: Data retention is limited; Thanos or Cortex is needed for historical analysis.
- Tracing Requests: Lacks distributed tracing; Jaeger or SigNoz with OpenTelemetry are better options.
- Real-Time Streaming: Works on intervals, not real-time events. Use Kafka or Flink for that.
Prometheus is best paired with other tools for a complete observability stack.
How Does Prometheus Work?
Prometheus operates with a straightforward yet powerful architecture designed for monitoring dynamic and large-scale systems. Here’s a breakdown of how it works:
Pull-Based Model:
Prometheus uses a pull-based approach, where it actively scrapes metrics from target services (like applications and servers) over HTTP at regular intervals.
Data Scraping Process and Intervals:
Metrics are scraped from configured endpoints, with intervals (default 15 seconds) that can be adjusted based on needs.
For Prometheus to pull metrics from a target, the target must expose a specific HTTP endpoint, typically at the /metrics path. The HTTP endpoints follow the format; hostaddress/metrics. This endpoint provides the current state of the target in a plain text format that Prometheus can understand.
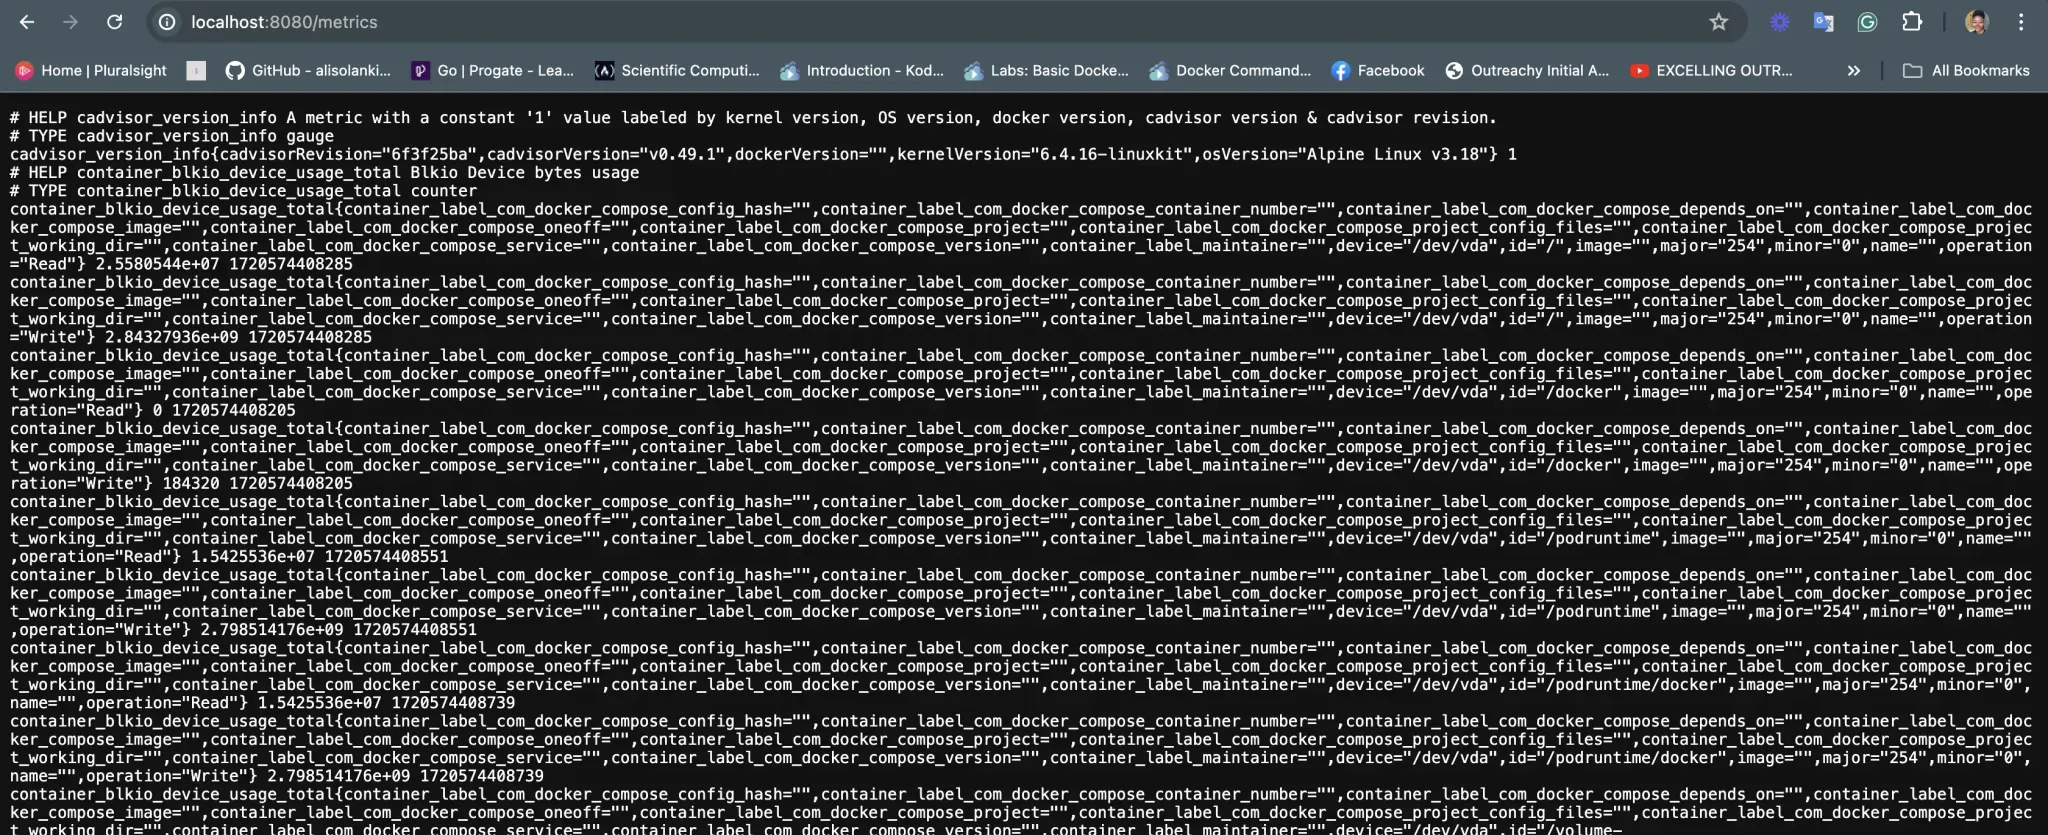
Collected data is stored in a Time Series Database (TSDB), where each time series is identified by a metric name and labels. Data is efficiently compressed for fast storage and retrieval.
Prometheus uses PromQL, a powerful query language, for querying, filtering, and analyzing time-series data to gain insights, create alerts, and generate reports.
Core Components of Prometheus
Prometheus comprises several key components that work together to create a comprehensive monitoring solution.
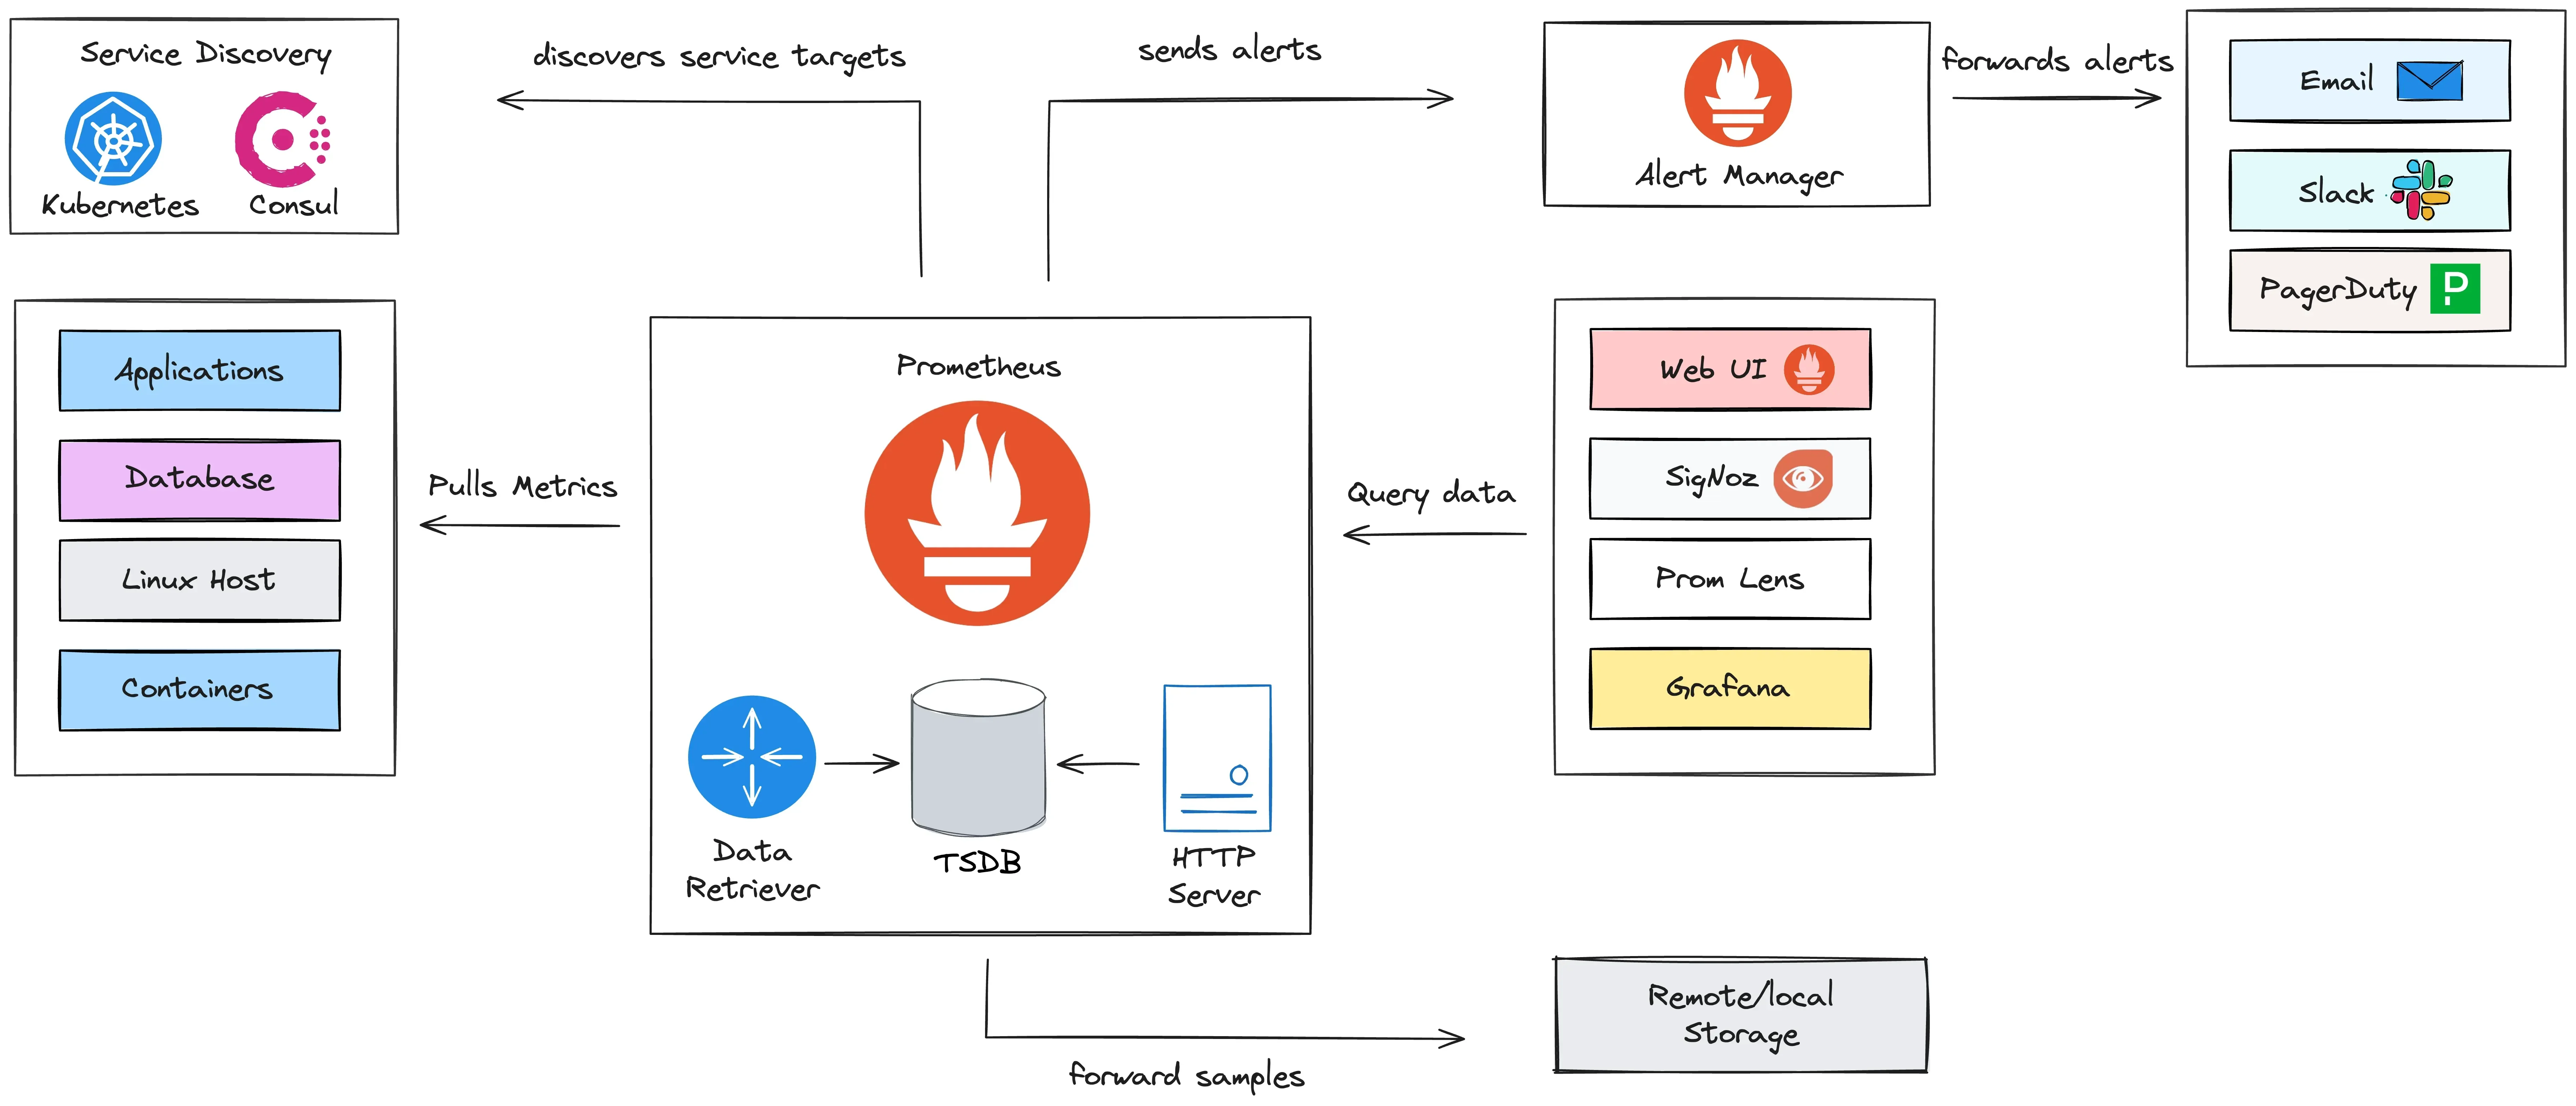
Prometheus Server
Purpose: This is the core of the Prometheus ecosystem, responsible for scraping, storing, and serving metrics.
Components:
- Data Retriever: Pulls metrics from monitored targets at defined intervals using a pull-based model.
- Time Series Database (TSDB): Stores metrics as time series data, optimized for high performance and efficient storage.
- HTTP Server: Serves data to users and external tools via the Prometheus Query Language (PromQL).
Service Discovery
Purpose: Dynamically discover targets to monitor without manual intervention. This eliminates the need for static configurations, making Prometheus adaptable to scaling and dynamic infrastructure changes.
Tools Supported:
- Kubernetes: For monitoring containers, pods, and clusters.
- Consul: For service discovery in dynamic environments.
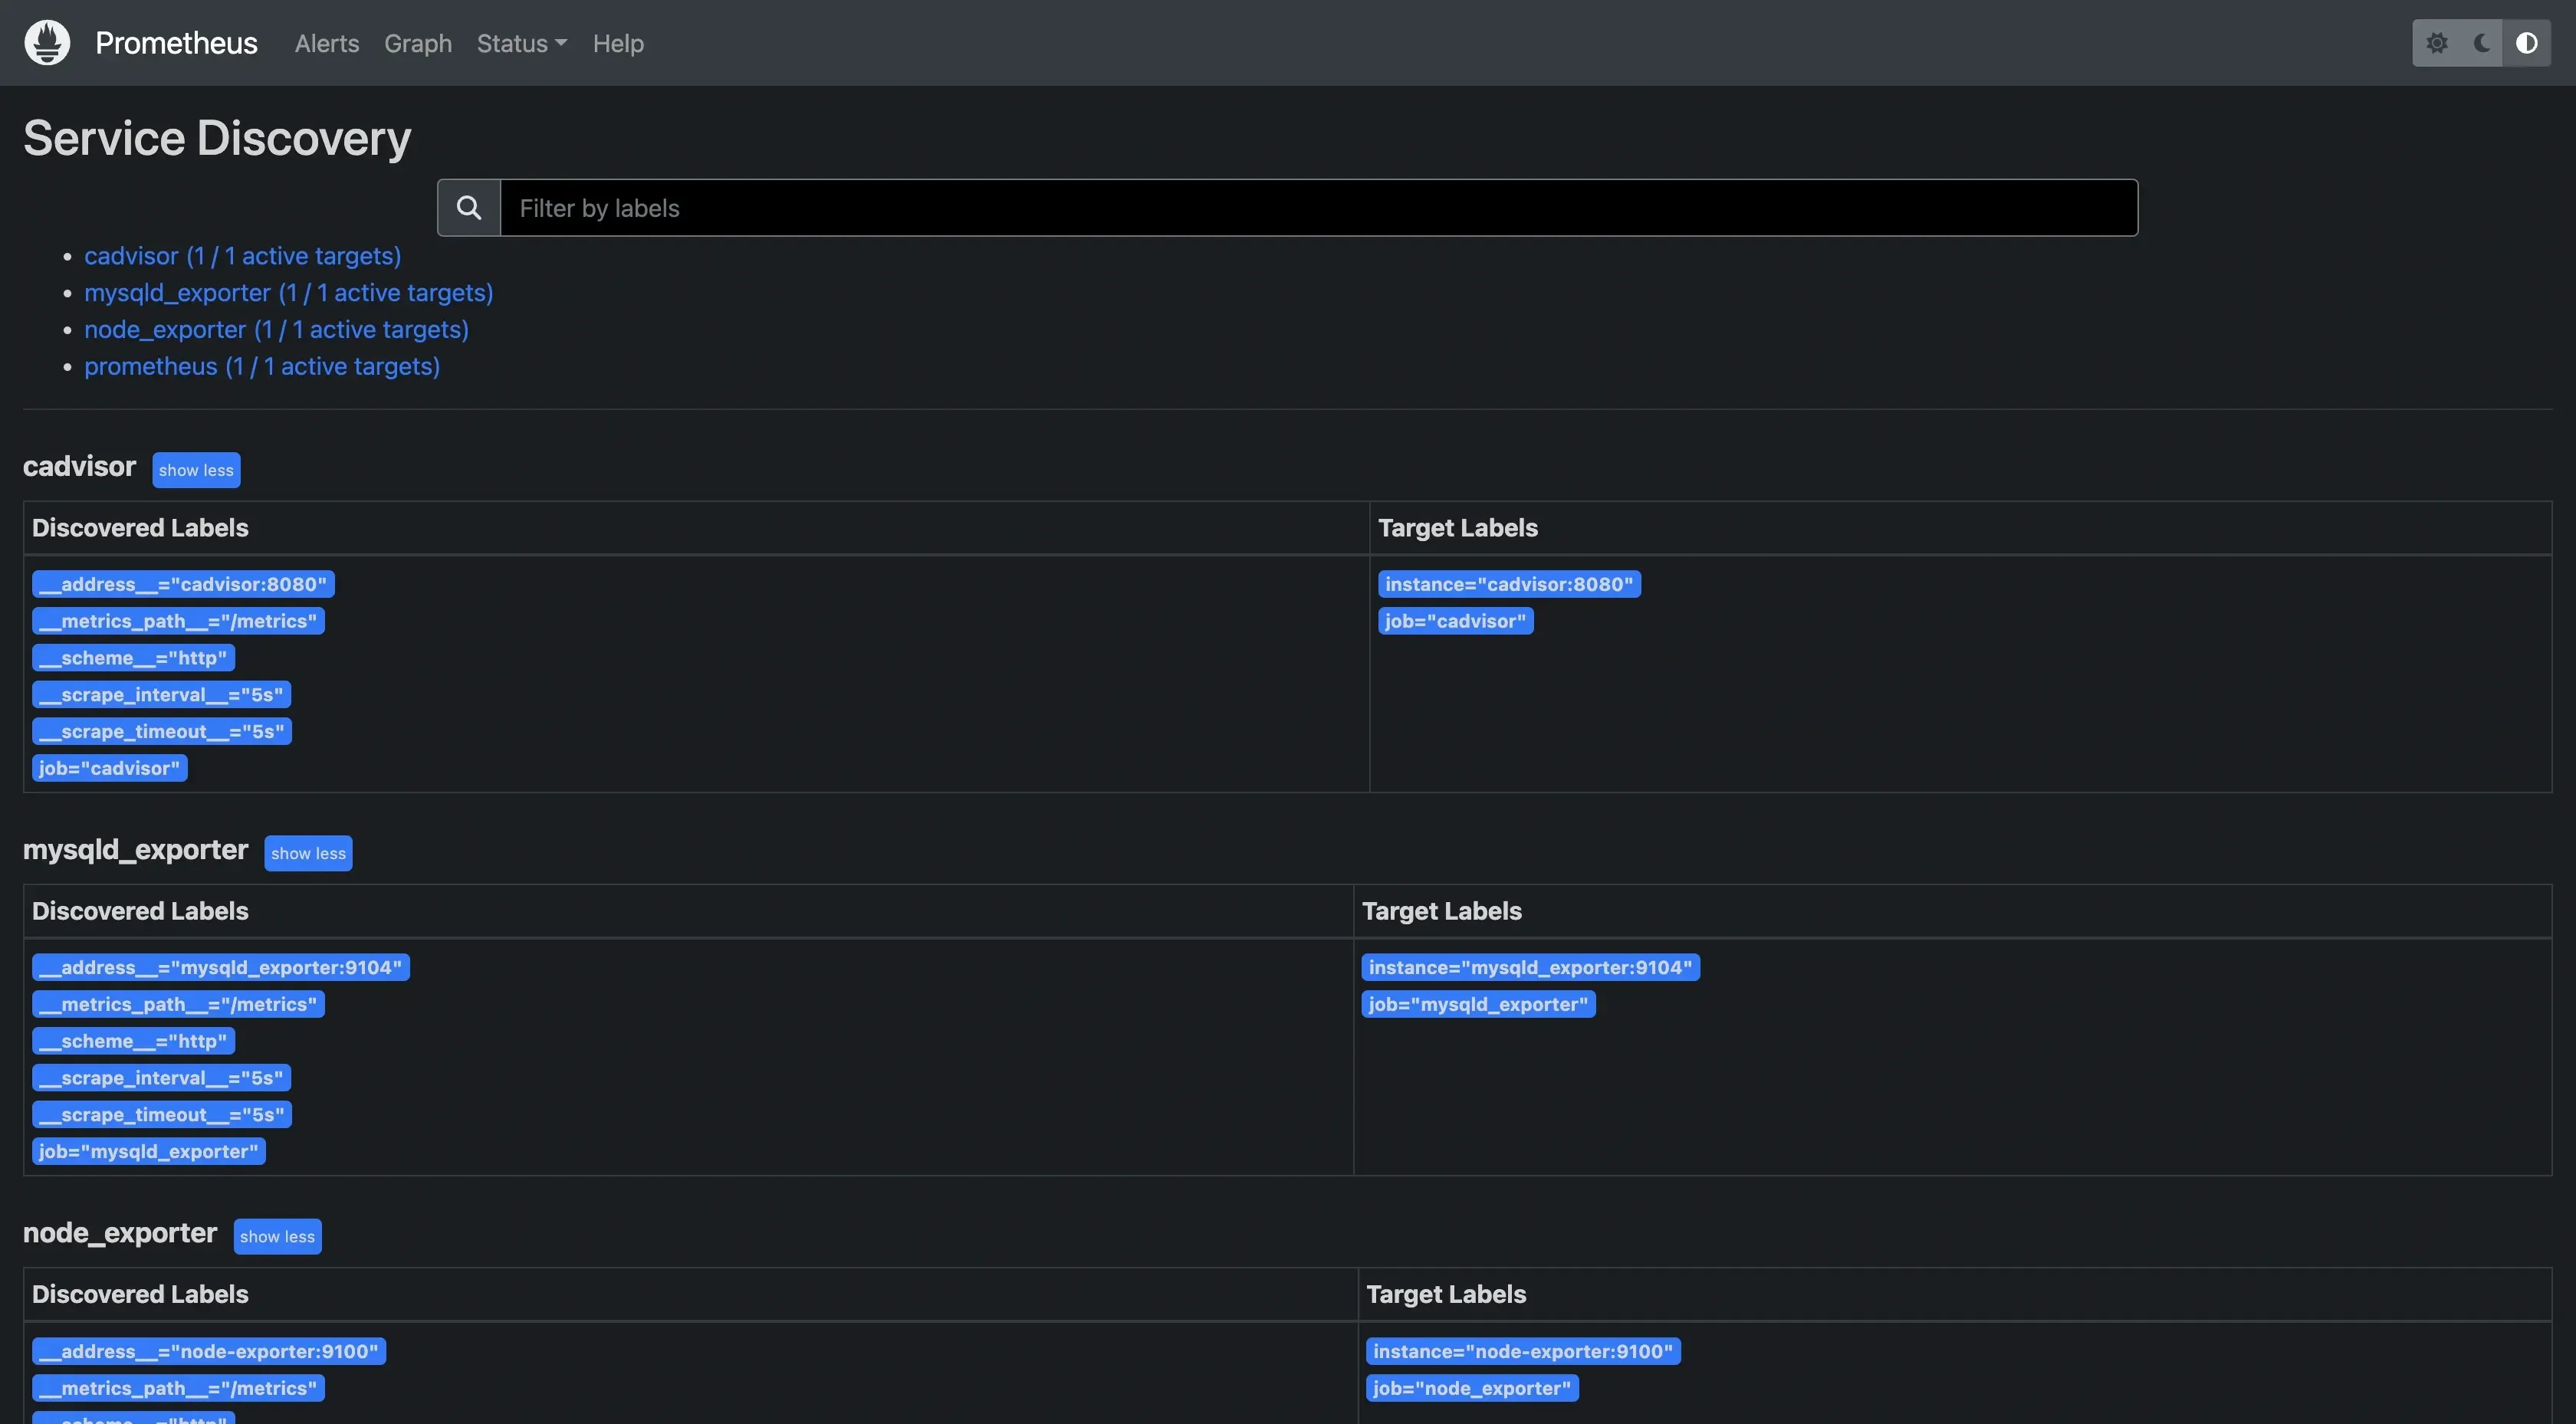
Prometheus service discovery Exporters
Purpose: Exporters act as intermediaries that enable Prometheus to monitor systems, services, or applications that do not natively expose metrics in a Prometheus-compatible format. They collect data from these sources, transform it into a Prometheus-readable format, and expose the metrics to Prometheus.
Each exporter exposes an HTTP endpoint that Prometheus scrapes for metrics.
Alertmanager
Purpose: Handles alerts generated by Prometheus, manages their lifecycle, and routes them to the appropriate channels.
Features:
- Deduplication, grouping, and routing of alerts.
- Integration with notification systems like:
- Email: Sends email notifications for alerts.
- Slack: Sends alerts to Slack channels.
- PagerDuty: Handles incident response workflows.
Alerts are configured in Prometheus rules and pushed to Alertmanager when triggered.
Visualization Tools
Purpose: Enables users to analyze metrics and visualize trends.
Options:
- Prometheus Web UI: Built-in interface for basic exploration and querying.
- Grafana: Advanced dashboards with rich visualizations.
- SigNoz: Combines observability and monitoring, focusing on end-to-end tracking.
- PromLens: Simplifies PromQL query building and exploration.
Grafana is the most popular tool for dashboarding, but SigNoz provides deeper observability integrations.
Remote Storage (Optional)
Purpose: Extends Prometheus for long-term storage or external analytics.
Features:
- Forwarding scraped metrics to external systems (e.g., AWS S3, Thanos, Cortex).
- Enables scalability for long-term historical data.
This feature is useful for environments where retaining metrics for extended periods is critical.
Pushgateway (Optional)
Purpose: Collects metrics from short-lived jobs (e.g., batch jobs) that cannot be scraped directly by Prometheus.
Usage: Jobs push their metrics to Pushgateway, which exposes them for Prometheus to scrape. It is also used in environments with transient workloads, such as CI/CD pipelines.
Query Language (PromQL)
Purpose: Prometheus's query language, is used to retrieve and analyze metrics data.
PromQL allows for flexible querying with features like filtering, aggregation, and mathematical operations to extract actionable insights.
Example of a PromQL query:

PromQL query This query checks the status of targets (Prometheus, node_exporter, cadvisor, or mysqld_exporter) and returns whether they are up (1) or down (0).
Scrape Targets
Purpose: Endpoints that expose metrics for Prometheus to scrape.
Types of Scrape Targets:
- Applications: Custom or pre-built applications that expose metrics directly through an HTTP endpoint (e.g.,
/metrics). - Infrastructure Components: Such as Linux hosts, Docker containers, Kubernetes pods, and other system-level entities.
- Third-Party Exporters: Services that bridge the gap between Prometheus and non-native systems by exposing metrics on behalf of those systems.
Targets are defined in the Prometheus configuration file or dynamically discovered via service discovery.
- Applications: Custom or pre-built applications that expose metrics directly through an HTTP endpoint (e.g.,
Setting Up Prometheus: A Quick Start Guide
Let's walk through the process of setting up Prometheus on a Linux system:
Download the latest Prometheus release:
wget <https://github.com/prometheus/prometheus/releases/download/v2.30.3/prometheus-2.30.3.linux-amd64.tar.gz>Extract the archive:
tar xvfz prometheus-*.tar.gz
cd prometheus-*
Create a basic configuration file named
prometheus.yml:global: scrape_interval: 15s scrape_configs: - job_name: 'prometheus' static_configs: - targets: ['localhost:9090']Start Prometheus:
./prometheus --config.file=prometheus.yml
Prometheus is now running and accessible at http://localhost:9090.

Understanding Prometheus Metrics and Data Model
Prometheus organizes its data using a flexible and powerful model to track and analyze time-series metrics. Here's a breakdown of the key concepts:
Types of Metrics
- Counter:
- A counter is a metric that only increases over time, representing a cumulative value. Common use cases include tracking the number of requests or errors.
- Example:
http_requests_total(number of HTTP requests processed).
- Gauge:
- A gauge represents a value that can go up or down, such as temperature or memory usage.
- Example:
memory_usage_bytes(memory usage in bytes).
- Histogram:
- A histogram samples observations (usually durations or sizes) and counts them in configurable buckets. It also provides summary statistics like the sum and count of observations.
- Example:
http_request_duration_seconds(histogram of request durations in seconds).
- Summary:
- A summary is similar to a histogram but also provides quantiles (e.g., 95th percentile) for a set of observations. It is typically used for tracking latencies or response times.
- Example:
http_request_duration_seconds_sum(total request duration) andhttp_request_duration_seconds_count(count of requests).
Labels and Dimensions in Prometheus
Labels are key-value pairs associated with a metric that help to identify and filter the data. They add dimensions to your metrics, enabling fine-grained queries.
Example:
http_requests_total{method="GET", status="200"}
Labels help create a multi-dimensional data model that allows efficient aggregation and filtering.
Naming Conventions for Metrics
Adopting consistent naming conventions is crucial for readability and maintainability. Here’s how to structure metrics and labels effectively:
Metric Name: It should be clear, concise, and represent what the metric measures. Conventionally, metric names are in lowercase, and underscores are used to separate words.
Example:
http_requests_total(total number of HTTP requests).Label Names: Label names should describe the dimensions they represent. Use short but meaningful names to identify specific characteristics and avoid using high-cardinality labels (e.g., user IDs or timestamps) to maintain efficiency.
Example:
method(GET, POST) orstatus(200, 404).
Best Practices for Creating and Organizing Metrics
While creating and organizing metrics there are some best practices to be followed.
- Use Descriptive Names: Choose metric names that clearly describe what they measure and avoid overly generic names.
- Leverage Labels for Granularity: Use labels to capture different dimensions (e.g., method, status code) but avoid using high cardinality labels that could increase storage and query complexity.
- Be Consistent with Naming: Stick to a consistent naming pattern for your metrics, labels, and units (e.g.,
secondsfor durations,bytesfor sizes). - Avoid Too Many Metrics: Only create metrics that provide value for monitoring and troubleshooting. Too many metrics can make the system harder to manage.
- Use Histograms and Summaries Wisely: Choose between histograms and summaries based on the use case. Histograms are typically better for large-scale aggregations, while summaries are more useful for precise quantile calculations.
Querying Prometheus Data with PromQL
PromQL (Prometheus Query Language) is a powerful query language that allows you to retrieve, filter, and manipulate time-series data in Prometheus. Here’s a guide to get you started with basic syntax, common queries, and tips for efficiency:
Basic PromQL Syntax and Operators
- Metric Name: The name of the metric you want to query (e.g.,
http_requests_total). - Labels: You can filter metrics by label values using curly braces
{}(e.g.,http_requests_total{status="200"}). - Operators: PromQL supports various operators in filtering and comparing metrics.
- Comparison operators:
=,!=,>,<,>=,<=. - Arithmetic operators:
+,,,/,%for operations on time-series data. - Logical operators:
and,or,unlessfor combining or excluding series. - Aggregation operators:
sum,avg,min,max,count, etc.
- Comparison operators:
Example: To query all HTTP requests with a status code of 200:
http_requests_total{status="200"}
Common Query Patterns and Examples
Rate of Change: Calculate the rate of change for a counter metric (e.g., requests per second).
rate(http_requests_total[5m])This returns the per-second rate of HTTP requests over the last 5 minutes.
Aggregation: Aggregate data by a label, such as the total requests per HTTP method.
sum(http_requests_total) by (method)This sums the
http_requests_totalmetric and groups it by themethodlabel (e.g., GET, POST).Filtering by Time Range: Query metrics over a specific time range (e.g., the last 1 hour).
http_requests_total{status="200"}[1h]This returns the
http_requests_totalmetric for status "200" over the last hour.
Using Functions for Aggregation and Analysis
PromQL includes a variety of functions that allow for complex aggregation and analysis of metrics:
avg(): Calculate the average value of a metric.avg(http_request_duration_seconds)max(): Find the maximum value of a metric.max(http_request_duration_seconds)count(): Count the number of time-series for a given metric.count(http_requests_total)rate(): Calculate the rate of increase for counters (used for time-series data that only increases, like HTTP request counts).rate(http_requests_total[1m])
Tips for Writing Efficient Queries
- Limit the Range: Use time ranges effectively in queries. For example, use
rate()oravg()with short ranges like[5m]or[1h]to reduce computation time. - Use
rate()for Counters: For counter metrics (e.g., requests, errors), always userate()orirate()to avoid returning raw, increasing values. - Avoid High Cardinality Labels: High cardinality (many unique values) in labels (e.g., user IDs, instance IDs) can cause performance issues. Try to avoid using such labels in aggregation or as part of groupings.
- Filter Early: Filter out unnecessary time series early in your queries using specific label filters to minimize the data Prometheus needs to process.
- Use Aggregation Wisely: When using aggregation operators like
sum(),avg(), orcount(), make sure you’re aggregating across the appropriate labels to avoid returning overly granular data.
Visualizing Prometheus Data
Visualizing Prometheus data helps you gain actionable insights from raw metrics. Here’s how you can use Prometheus’s built-in tools and integrate with Grafana for advanced visualizations:
Prometheus’s Built-in Expression Browser
Prometheus comes with a simple expression browser for querying and visualizing metrics directly from the web UI:
- Access the Browser: Navigate to
http://localhost:9090and click on the "Graph" tab. - Run Queries: Enter PromQL expressions in the query box to fetch metrics.
- Example:
rate(prometheus_http_requests_total[5m])displays the per-second request rate over the past 5 minutes.
- Example:
- Visualize: The results can be displayed as a graph or a table by toggling the view.
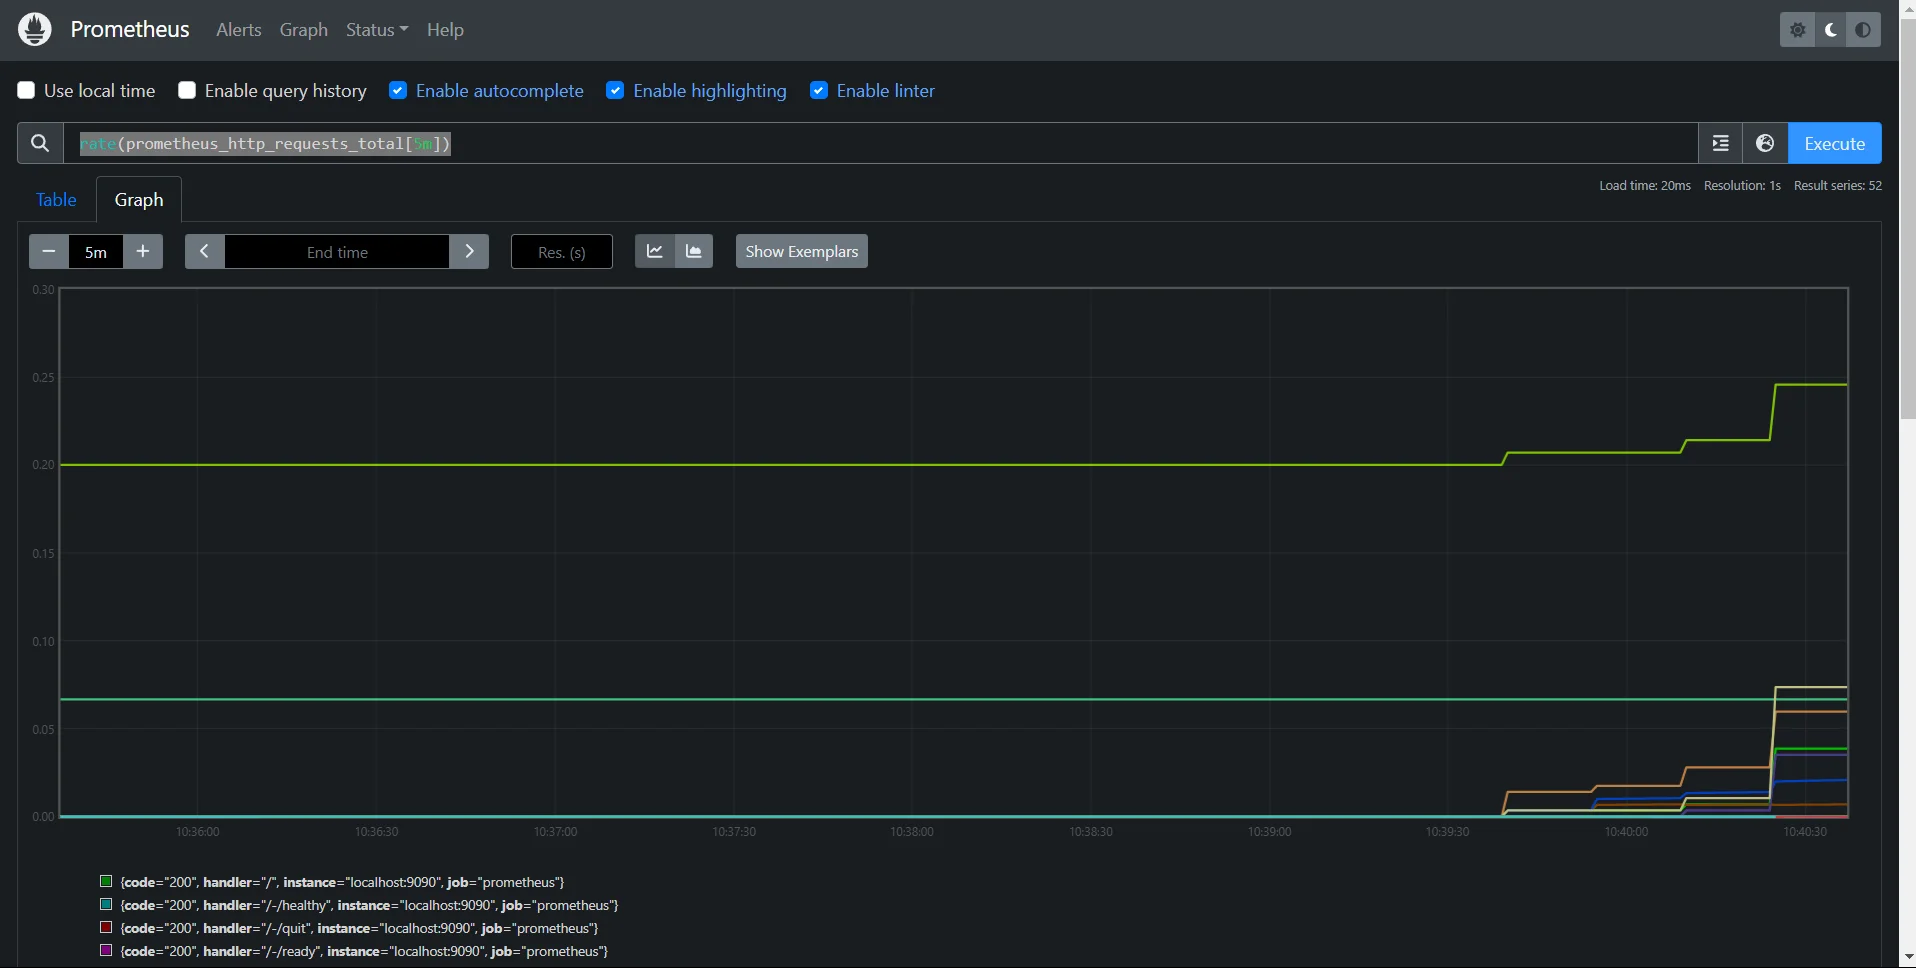
While useful for quick checks, the expression browser lacks advanced features like dashboards, making tools like Grafana essential.
Introduction to Grafana for Advanced Dashboarding
Grafana is a widely used open-source visualization tool that pairs perfectly with Prometheus for creating rich, interactive dashboards.
- Features:
- Customizable panels for metrics, logs, and alerts.
- Pre-built templates for popular metrics.
- Integration with multiple data sources, not just Prometheus.
- Installation: You can install Grafana from here.
- Setup: To connect Grafana to Prometheus:
- Open Grafana (
http://localhost:3000) and log in (default username/password:admin/admin). - Add Prometheus as a data source:
- Navigate to Configuration > Data Sources.
- Click Add Data Source, select Prometheus, and configure the URL (e.g.,
http://localhost:9090).
- Open Grafana (
Creating Your First Prometheus Dashboard in Grafana
- Start a New Dashboard:
- In Grafana, go to Create > Dashboard and click Add New Panel.
- Add a Query:
Enter a PromQL query, such as:
rate(prometheus_http_requests_total[5m])Preview the results in the graph below.
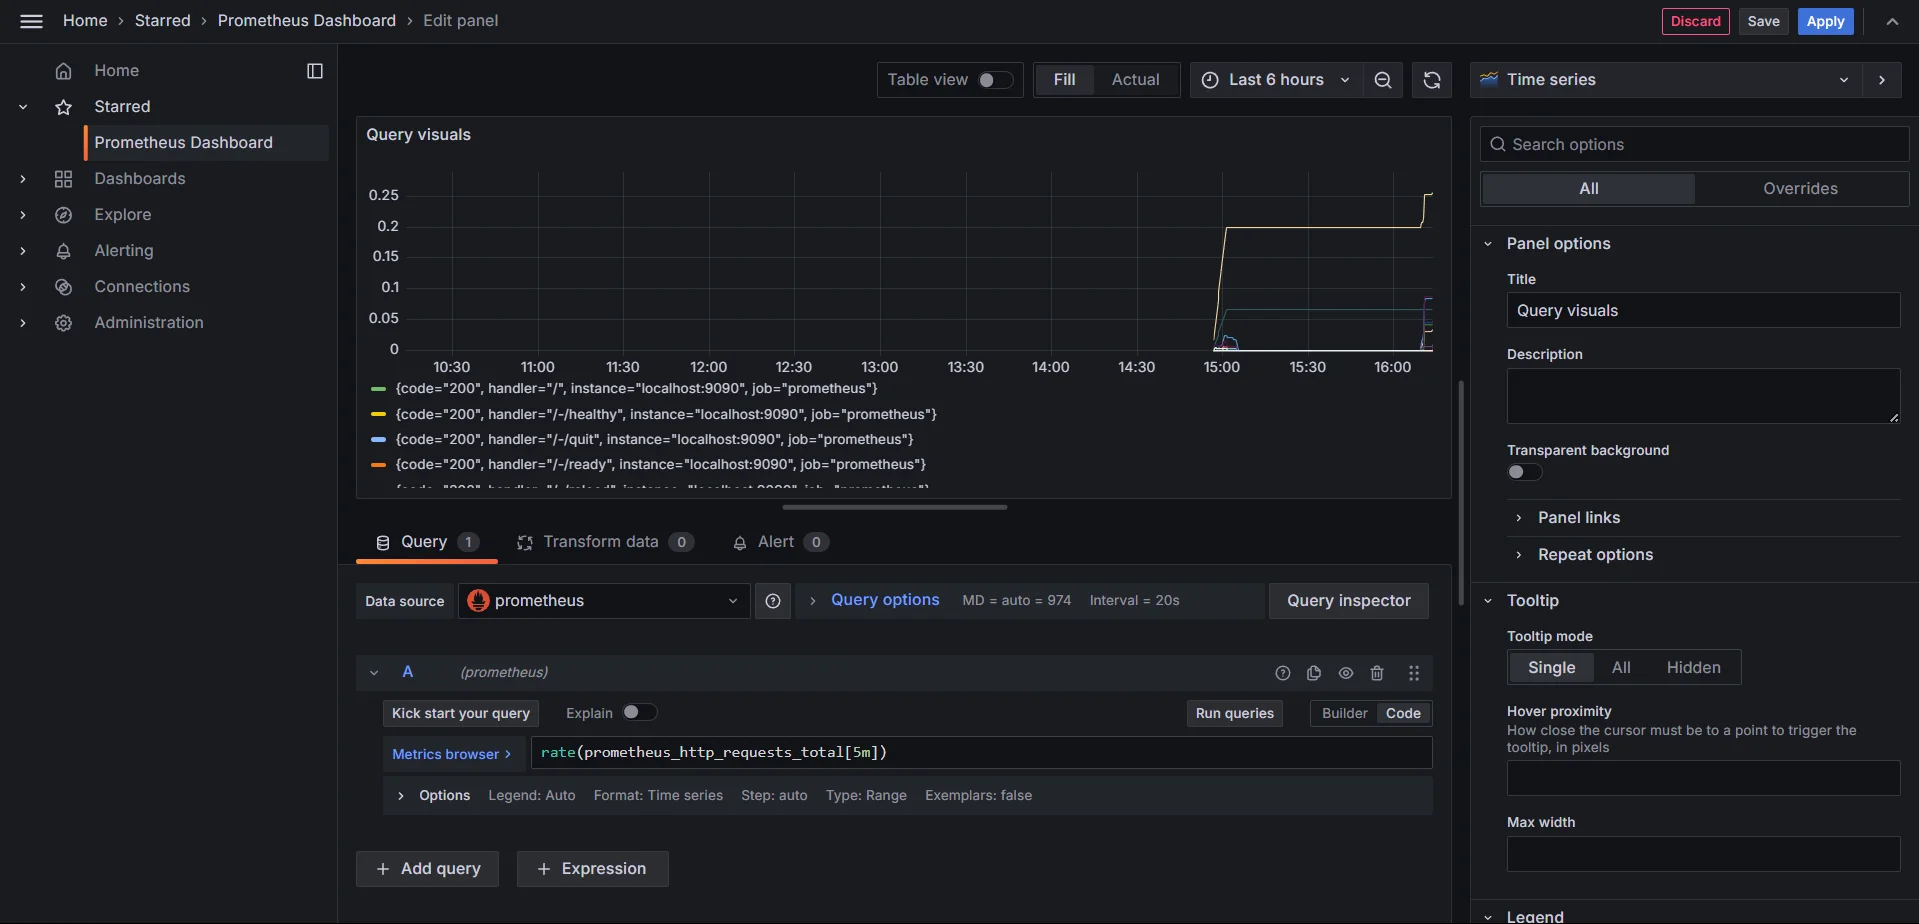
Visualizing Metrics in Grafana
- Customize Visualization:
- Select the panel type (e.g., time series, gauge, table).
- Add titles, legends, and thresholds for clarity.
- Save Your Dashboard:
- Click Save Dashboard, give it a name, and optionally set sharing permissions.
Best Practices for Effective Data Visualization
- Keep Dashboards Focused: Group related metrics into panels to avoid clutter.
- Example: Group CPU, memory, and disk usage metrics in a "System Health" dashboard.
- Use Aggregations Wisely: Summarize data to focus on trends rather than individual points.
- Example: Use
sum(rate(...))to visualize the overall request rate.
- Example: Use
- Set Thresholds: Define thresholds to highlight critical values (e.g., red for high error rates).
- Leverage Annotations: Add event markers (e.g., deployments or outages) to correlate data with incidents.
- Optimize Panel Queries: Avoid overly complex queries that could slow down your dashboard. Use shorter time ranges or caching when possible.
Alerting with Prometheus
Prometheus alerting lets you proactively identify system issues by setting up thresholds and notifying you when metrics cross those thresholds. Here's a breakdown of how to get started and optimize alerting.
Configuring Alerting Rules in Prometheus
Prometheus uses alerting rules defined in the prometheus.yml configuration file to trigger alerts based on conditions. Here's how you can set them up:
Define Alerting Rules: Add an
alertingsection in theprometheus.ymlfile or include a separate rules file:rule_files: - "alerts.yml"Example Alerting Rule: In
alerts.yml, define an alert for high CPU usage:groups: - name: cpu_alerts rules: - alert: HighCPUUsage expr: avg(rate(node_cpu_seconds_total{mode!="idle"}[5m])) > 0.8 for: 2m labels: severity: critical annotations: summary: "High CPU usage detected" description: "The average CPU usage is above 80% for the last 2 minutes."expr: PromQL expression to evaluate.for: How long must the condition persist before firing an alert?labels: Metadata for categorizing alerts (e.g., severity).annotations: Add context for the alert, like a summary and description.
Apply Configuration: Restart the Prometheus server to apply the changes.
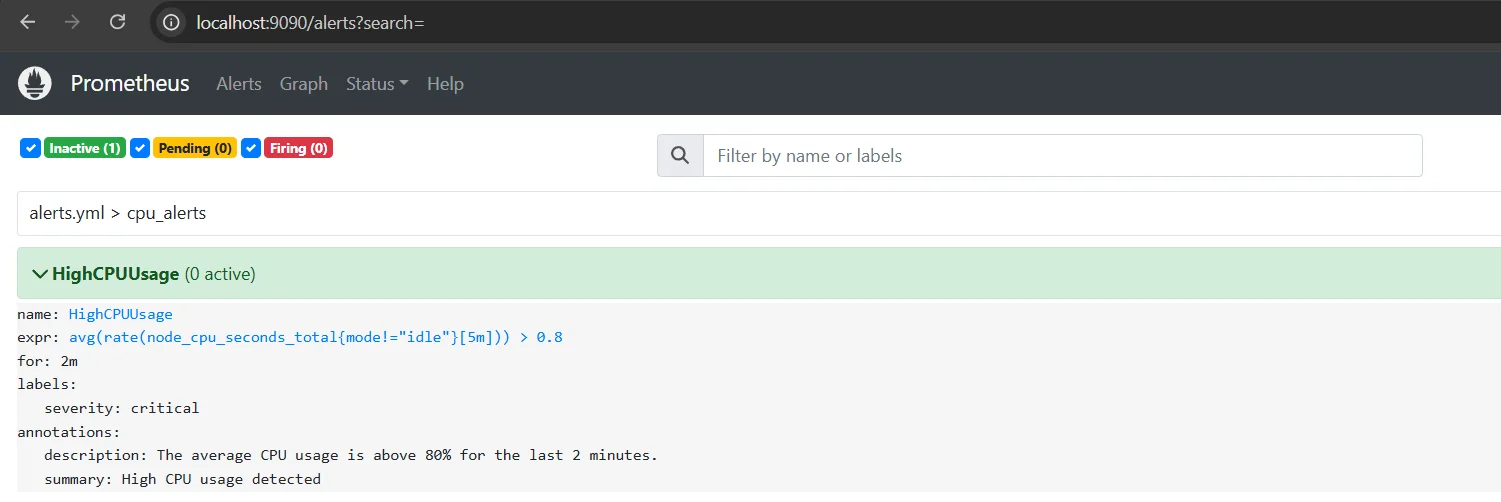
Understanding Alert States and Labels
Alert States:
- Pending: The condition has been met but not for the required duration.
- Firing: The alert is active and will trigger notifications.
- Resolved: The condition is no longer met.
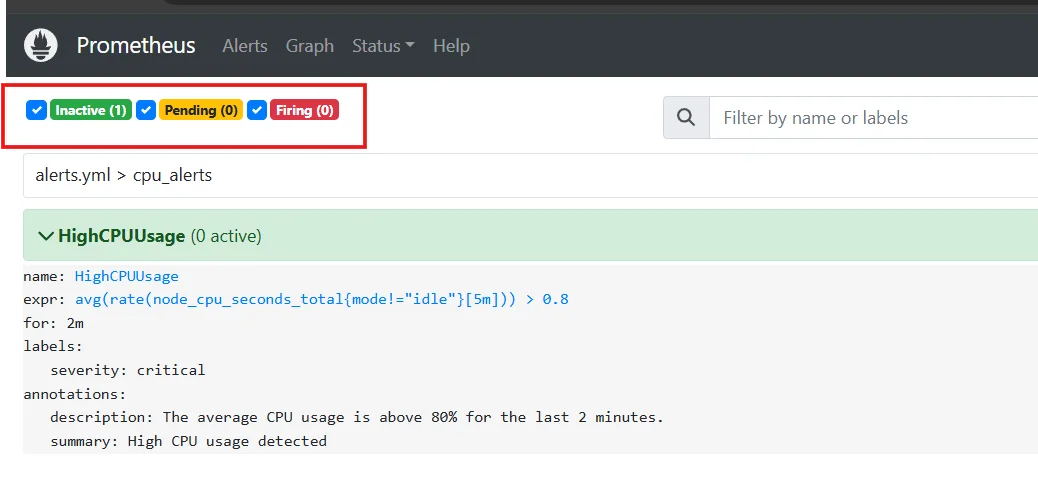
Alert States Labels:
- Labels help identify and group alerts.
- Example:
severity: criticalcan be used to route high-priority alerts to specific channels.
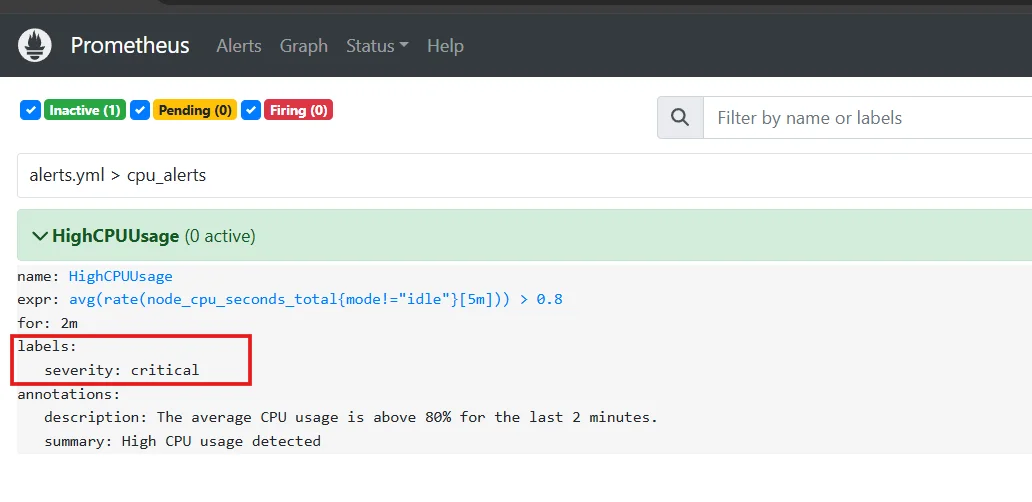
Alert Labels
Alertmanager is used to handle notifications triggered by Prometheus alerts. It supports routing, deduplication, and silencing. You can configure Alertmanager using this guide.
Best Practices for Creating Meaningful and Actionable Alerts
- Define Clear Alert Thresholds:
- Use thresholds that represent real issues, avoiding false positives.
- Example: Set disk usage alerts at 90%, not 70%.
- Categorize Alerts by Severity:
- Use labels like
severity: criticalorseverity: warningto prioritize responses.
- Use labels like
- Add Context to Alerts:
- Include meaningful summaries and descriptions in
annotations. - Example: Specify affected systems or recommended actions.
- Include meaningful summaries and descriptions in
- Avoid Overlapping Alerts:
- Ensure alerts are distinct and don’t create noise for the same issue.
- Test Alerts Regularly:
- Use tools like the Prometheus web UI or PromQL queries to simulate alert conditions.
- Integrate with Incident Management Tools:
- Route alerts to tools like PagerDuty, Opsgenie, or Slack for streamlined handling.
Scaling Prometheus for Production Environments
Scaling Prometheus effectively ensures it can handle the demands of large-scale, high-traffic systems. Here are key strategies:
1. Federation for Large-Scale Deployments
- Use Prometheus Federation to split metrics collection across multiple Prometheus servers.
- Parent servers aggregate high-level metrics from child servers, reducing the load on any single instance.
- Ideal for multi-cluster or region-specific setups.
2. Long-Term Storage Solutions
- Prometheus’s built-in storage is not designed for long-term retention. Use remote write integrations with tools like:
- Thanos: Adds long-term storage and global querying.
- Cortex or VictoriaMetrics: Scalable solutions for high availability and extended data retention.
3. High Availability Setups
- Run multiple Prometheus instances with identical configurations to ensure fault tolerance.
- Use a load balancer or alert deduplication via Alertmanager to handle overlaps.
4. Performance Tuning and Optimization
- Limit the scrape interval for non-critical metrics to reduce overhead.
- Use efficient PromQL queries and avoid heavy computations on large datasets.
- Leverage sharding by dividing targets among multiple Prometheus instances.
Prometheus Exporters
Prometheus exporters enable you to gather metrics from various systems, applications, and environments, making monitoring more versatile and comprehensive.
Overview of Common Exporters
node_exporter: Collects system metrics like CPU, memory, and disk usage.blackbox_exporter: Tracks the availability and performance of network endpoints using HTTP, TCP, DNS, and ICMP.- Database Exporters: Examples include
postgres_exporterfor PostgreSQL andmysqld_exporterfor MySQL. - Custom Exporters: For applications or services without native Prometheus support.
Exporters are typically lightweight applications that expose metrics to Prometheus. Check out the documentation for Installation and configuration of respective exporters.
Custom Exporters
If no existing exporter meets your requirements, you can create custom exporters tailored to your applications. Custom exporters expose metrics in Prometheus's text-based format, which allows Prometheus to scrape and store them effectively.
Best Practices for Using Exporters Effectively
- Choose Verified Exporters: Use community-supported or official exporters for critical systems.
- Reduce Noise: Disable unnecessary metrics to focus on relevant data and minimize storage usage.
- Ensure Reliability: Monitor exporters themselves to avoid missing key metrics during downtime.
- Keep Exporters Updated: Use the latest versions to benefit from performance improvements and fixes.
SigNoz: A Modern Complementary Tool for Prometheus
SigNoz is a powerful, full-stack observability platform designed to monitor, trace, and debug modern applications seamlessly. While Prometheus excels at metrics monitoring, SigNoz extends observability by integrating metrics, logs, and distributed tracing into a unified interface, offering a comprehensive solution for modern application monitoring. Here’s how SigNoz complements Prometheus and why it could be the right choice for your full-stack observability needs:
| Feature | Prometheus | SigNoz |
|---|---|---|
| Metrics Monitoring | Yes | Yes |
| Distributed Tracing | No (requires Jaeger/others) | Yes (built-in) |
| Long-Term Storage | Requires external tools | Built-in with scalable storage |
| Visualization | Requires Grafana | Integrated dashboards |
| Ease of Setup | Manual configuration | Simple out-of-the-box setup |
While Prometheus is an excellent tool for collecting and querying metrics, SigNoz provides a more comprehensive observability solution by including distributed tracing and log management alongside metrics. SigNoz is built on open standards like OpenTelemetry, ensuring compatibility and flexibility, while simplifying the setup and management of complex observability tasks.
SigNoz Cloud is the easiest way to run SigNoz. Sign up for a free account and get 30 days of unlimited access to all features.
You can also install and self-host SigNoz yourself since it is open-source. With 24,000+ GitHub stars, open-source SigNoz is loved by developers. Find the instructions to self-host SigNoz.
Sending Prometheus Metrics to SigNoz Cloud
To monitor Prometheus in SigNoz Cloud, you need to install the OpenTelemetry Collector and configure it to scrape Prometheus metrics.
Pre-requisites:
- Create an account on SigNoz Cloud
- OpenTelemetry Collector: Refer to the guide on installing the OpenTelemetry Collector.
- Prometheus server running and scraping metrics.
Follow these steps:
Set Up the Prometheus Receiver
Once the OpenTelemetry Collector is installed, configure it to scrape Prometheus metrics. Edit your
otel-collector-config.yamlfile and add a Prometheus receiver configuration:- New Job:
receivers: prometheus: config: scrape_configs: - job_name: 'prometheus' static_configs: - targets: ['localhost:8080'] *#update your port here*- Existing Job:
- job_name: "otel-collector"
  scrape_interval: 30s
  static_configs:
    - targets: ["otel-collector:8889", "localhost:31000"] #update the prometheus port
Connect to SigNoz Cloud
Update the exporter section of the configuration to send metrics to your SigNoz Cloud endpoint. Replace
<cloud-instance-url>and<SIGNOZ_INGESTION_KEY>with your SigNoz Cloud details:exporters: otlp: endpoint: <cloud-instance-url> tls: insecure: false headers: "signoz-ingestion-key": <SIGNOZ_INGESTION_KEY> service: pipelines: metrics: receivers: [prometheus] processors: [batch, resourcedetection] exporters: [otlp]Apply Changes
Restart the OpenTelemetry Collector to apply the new configuration
Verify Configuration in SigNoz Cloud
Log in to your SigNoz Cloud dashboard and check for Prometheus metrics to ensure the metrics are being scraped and sent successfully.
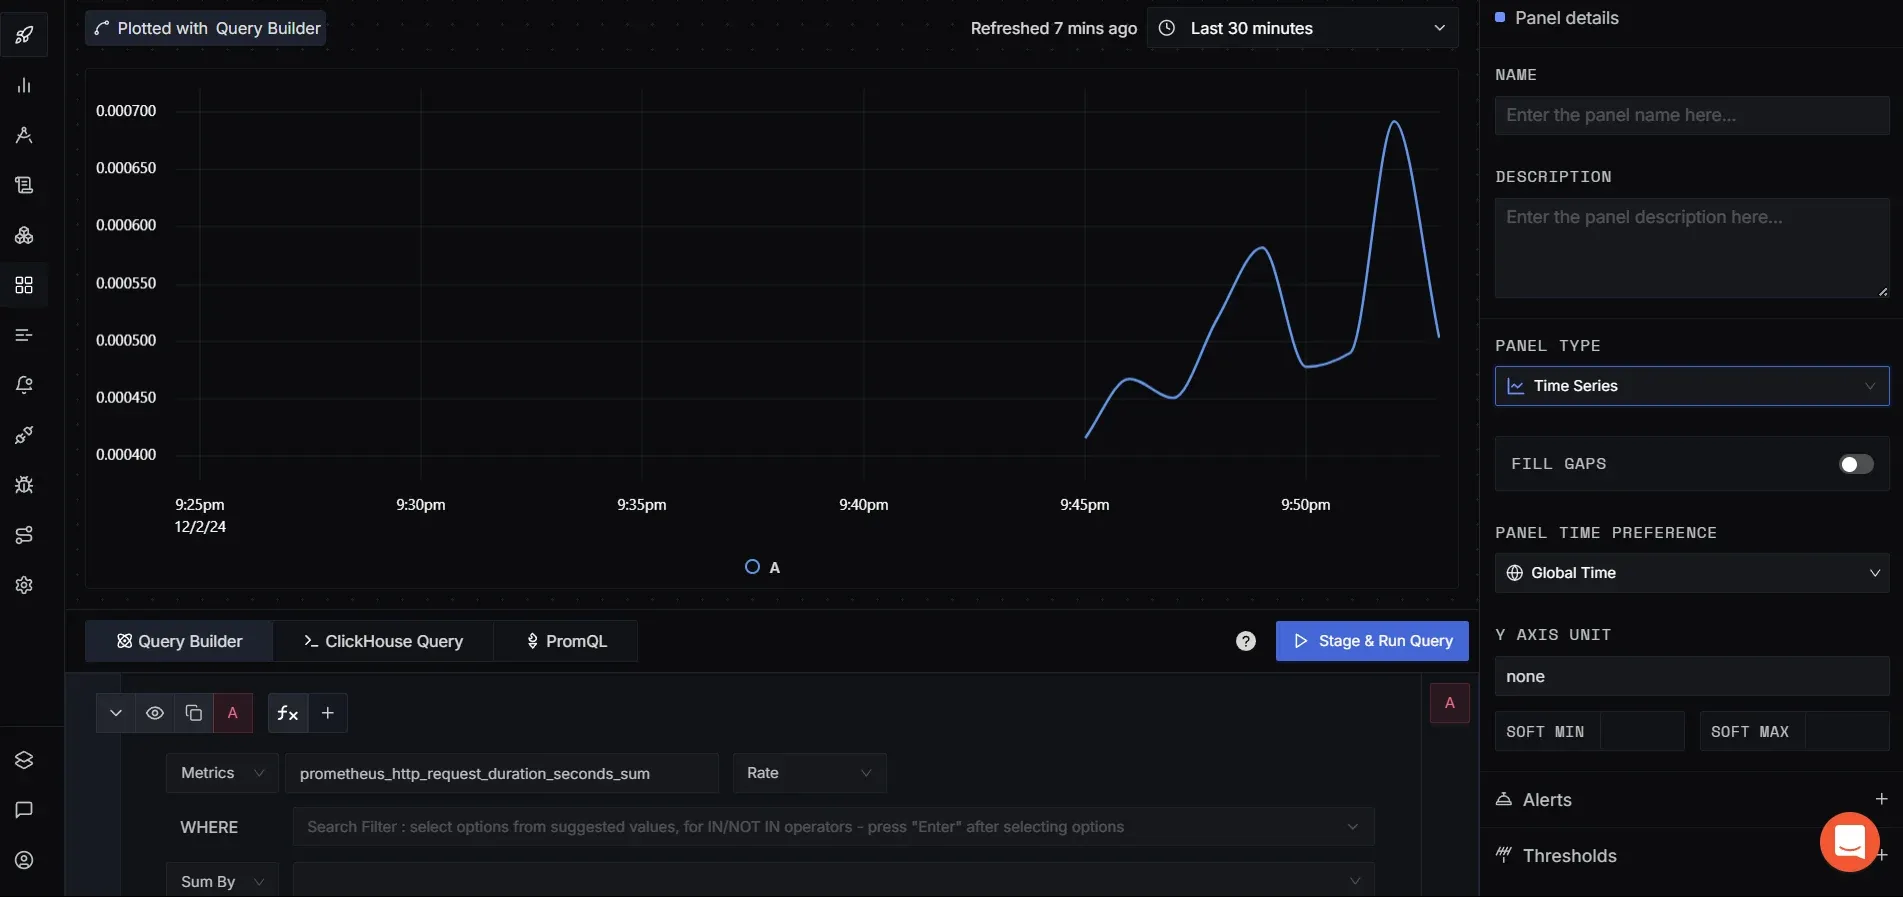
Verify Configuration in SigNoz Cloud
By combining Prometheus with SigNoz, you can elevate your monitoring and observability strategy, ensuring better performance, security, and reliability for your systems.
Key Takeaways
- Prometheus is a robust, open-source monitoring solution with a pull-based architecture.
- Its strengths include scalability, flexibility, and a powerful query language (PromQL).
- Setting up Prometheus involves installing the server, configuring targets, and defining metrics.
- Effective use requires understanding its data model, query language, and ecosystem.
- Consider SigNoz for a modern, full-stack observability alternative.
FAQs
What are the main differences between Prometheus and other monitoring tools?
Prometheus stands out with its pull-based model, multi-dimensional data model, and powerful query language. Unlike some solutions, it's open-source and designed for modern, dynamic environments.
How does Prometheus handle high-cardinality data?
Prometheus can struggle with high-cardinality data. Best practices include limiting label combinations and using recording rules to pre-aggregate data.
Can Prometheus be used for logging as well as metrics?
Prometheus is primarily designed for metrics. For logging, consider complementary tools like Loki or use a comprehensive solution like SigNoz that handles both metrics and logs.
What are the limitations of Prometheus, and how can they be addressed?
Prometheus has limitations in long-term storage and high-cardinality data handling. These can be addressed through remote storage solutions and careful metric design. Alternatively, consider a more comprehensive solution like SigNoz.
