How to Count Unique Label Values with Prometheus Queries
Prometheus is renowned for its robust time-series data collection and querying capabilities. However, when it comes to counting unique label values, you may encounter some challenges. This guide will walk you through the essentials of Prometheus labels, the intricacies of counting unique values, and advanced techniques for optimizing your queries. We’ll also explore how to visualize these insights in Grafana and leverage SigNoz for enhanced monitoring.
Understanding Prometheus Labels and their Importance
Prometheus labels are key-value pairs attached to metrics that provide additional context and allow for more detailed data analysis. They play a crucial role in identifying and categorizing metrics, enabling you to slice and dice your data in numerous ways.

Labels allow you to slice and dice your metrics with precision. For example, instead of having a single, monolithic count of HTTP requests, you can break it down by method, status code, endpoint, or any other dimension that matters to you. This granularity is key for:
- Targeted Monitoring: Track specific subsets of your system, like requests to a particular service or errors in a certain region.
- Flexible Querying: Craft precise queries that focus on the exact data you need, filtering and aggregating based on labels.
- Detailed Insights: Gain deeper insights into system behavior by analyzing metrics across multiple dimensions.
For example, a http_requests_total metric can have labels such as method, status_code, and endpoint. These labels allow you to analyze request patterns across different HTTP methods, response codes, and API endpoints.
Why Count Unique Label Values?
In a dynamic environment, labels can multiply quickly. You might have hundreds of microservices, thousands of unique users, or different error codes. Counting the unique values for a given label helps you:
- Detect Anomalies: Sudden spikes in unique values can indicate issues like service sprawl or unusual user activity.
- Optimize Resources: Identify underutilized services or users that haven't logged in recently.
- Gain Insights: Understand the distribution and diversity of elements like users or services.
The Challenge of Counting Unique Label Values
Counting unique label values can be tricky with Prometheus's basic queries. While Prometheus excels at tracking metrics over time, its standard functions aren’t designed to directly count distinct label values.
The problem lies in Prometheus’s design. It’s optimized for performance and scalability, which means handling high-cardinality data (data with a large number of unique label combinations) isn’t its strong suit.
To tackle this, PromQL offers specialized functions designed for counting unique values:
count(): Useful for simple counts but limited in scope when it comes to unique values.count_values(): The go-to function for counting the occurrences of each unique label value.
These functions provide you with the information to dig deeper into your metrics, providing the insights that basic queries can’t deliver.
Mastering the count() Function for Unique Label Values
While count() is a fundamental PromQL function, its role in counting unique label values is limited. Understanding its usage and combining it with other functions is key to getting the most out of your Prometheus metrics.
Understanding the count() Function
The count() function is designed to aggregate the number of metrics that match a given set of labels. Its basic syntax is:
count(metric_name{label_selector})
For example:
count(http_requests_total{status_code="200"})
This query counts the number of metrics where status_code is 200, but it doesn’t differentiate between unique values of status_code.
Step-by-Step Guide to Using count()
- Identify the Metric: Choose the metric you need, such as
http_requests_total. - Apply Label Selector: Use
{label_selector}to specify the labels of interest. For instance, to filter bystatus_code. - Execute
count(): Run the query to get a count of metrics. For unique values, you’ll need to use it in combination with other functions.
Examples of count() Queries
Service Discovery: To find out how many instances of each service are running:
count(service_up) by (service_name)This aggregates the number of service instances by
service_name.Capacity Planning: To count unique tenants or users:
count(user_activity_total) by (tenant_id)This shows the number of metrics per unique
tenant_id.Error Analysis: To count occurrences of each error type:
count(application_errors_total) by (error_type)This groups error counts by
error_type.
Best Practices for Optimizing count() Queries
- Specify Labels: Use label selectors to focus on relevant data and avoid performance issues.
- Group Meaningfully: Apply
byto group counts logically, making the data more interpretable. - Monitor Performance: Regularly review query performance to ensure efficient processing, especially with high-cardinality data.
Advanced Techniques with count() and by()
When you need to dive deeper into your metrics, combining count() with by() allows for sophisticated multi-dimensional analysis. This approach can reveal unique insights across multiple labels, providing a comprehensive view of your data. Let’s explore how to leverage these techniques effectively.
Combining count() with by()
Using count() in conjunction with by() lets you aggregate metrics across different dimensions. This is essential for complex queries where you want to analyze data across multiple labels.
Syntax Example:
count(metric_name) by (label1, label2)
Here, metric_name is the metric you’re querying, and label1 and label2 are the labels you want to group by. This will count the number of occurrences of the metric, segmented by the specified labels.
Examples of Complex Queries
Service and Region Analysis: To count the number of active services by both
service_nameandregion:count(service_up) by (service_name, region)This query helps in understanding how many instances of each service are running in each region.
User Activity by Role and Region: To count the number of unique users segmented by
user_roleandregion:count(user_activity_total) by (user_role, region)This provides insight into user activity levels across different roles and regions.
Error Types by Service and Environment: To count distinct error types across
service_nameandenvironment:count(application_errors_total) by (error_type, service_name, environment)This helps in pinpointing which error types are occurring in which services and environments.
Handling High Cardinality Efficiently
High-cardinality labels (labels with a large number of unique values) can lead to performance issues and high memory usage. Here are some tips to manage them effectively:
- Filter Early: Apply filters to reduce the scope of your queries before aggregating. For instance, narrow down by time or specific label values.
- Use Aggregation Sparingly: Grouping by too many labels can lead to excessively large result sets. Focus on the most critical labels for your analysis.
- Optimize Label Design: Ensure that labels are used meaningfully and consistently. Avoid creating labels with excessively variable values.
Potential Pitfalls and How to Avoid Them
- Performance Bottlenecks: Complex queries with multiple grouping using
by()clauses can strain Prometheus, especially with high-cardinality data. Optimize queries by limiting the number of labels used in theby()clause. - Data Explosion: Grouping by numerous labels might result in an explosion of time series. Be mindful of this to avoid overwhelming your Prometheus server.
- Misleading Aggregations: Ensure your
by()clauses make logical sense to avoid misleading aggregations. Double-check that the labels used align with your intended analysis.
Leveraging count_values() for Unique Label Analysis
The count_values() function offers an alternative approach to counting unique label values:
count_values("unique_count", metric_name)
This function creates a new time series for each unique value of the specified metric, with the value being the count of occurrences.
Comparison with count():
count_values()preserves the actual values being countedcount()is generally more efficient for simple unique counts
Step-by-step guide for using count_values():
- Choose the metric you want to analyze
- Apply any necessary filters
- Use
count_values()with a new label name as the first argument - Optionally, use aggregation functions on the result
Real-world example: Analyzing HTTP status code distribution
count_values("status_count", http_status_code)
This query creates a new time series for each unique HTTP status code, allowing you to see the distribution of response codes across your services.
Visualizing Unique Label Counts in Grafana
Grafana, a popular open-source visualization tool, integrates seamlessly with Prometheus to create powerful dashboards. To visualize unique label counts:
Add the Prometheus server as the data source to your Grafana server.
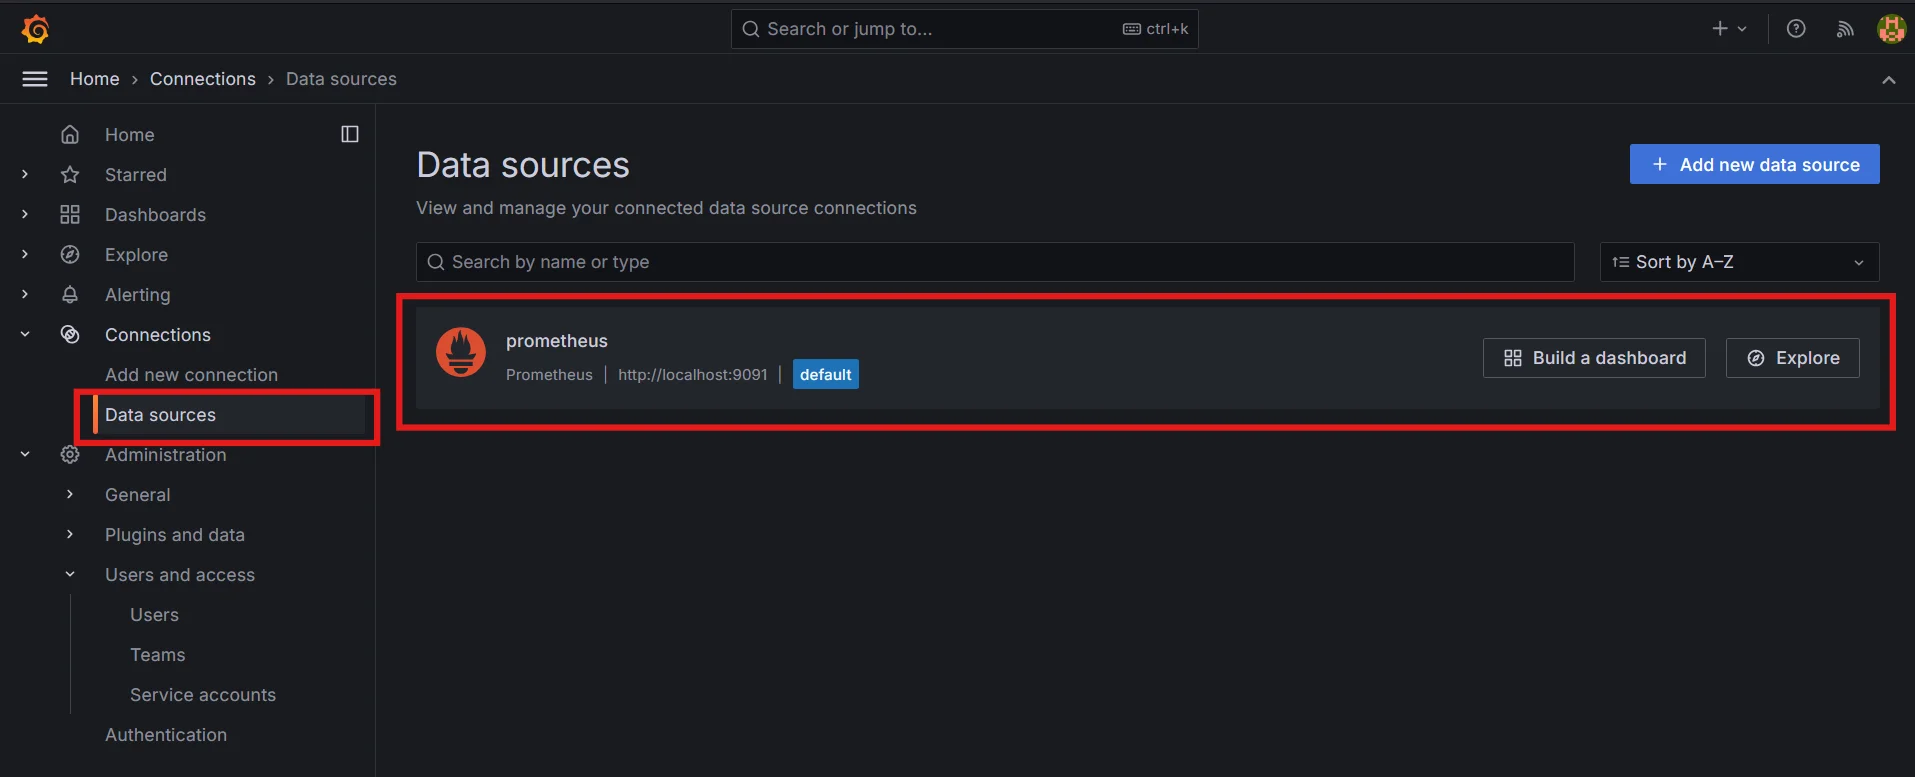
Adding Prometheus server as a data source in Grafana Create a new dashboard by adding a visualization.
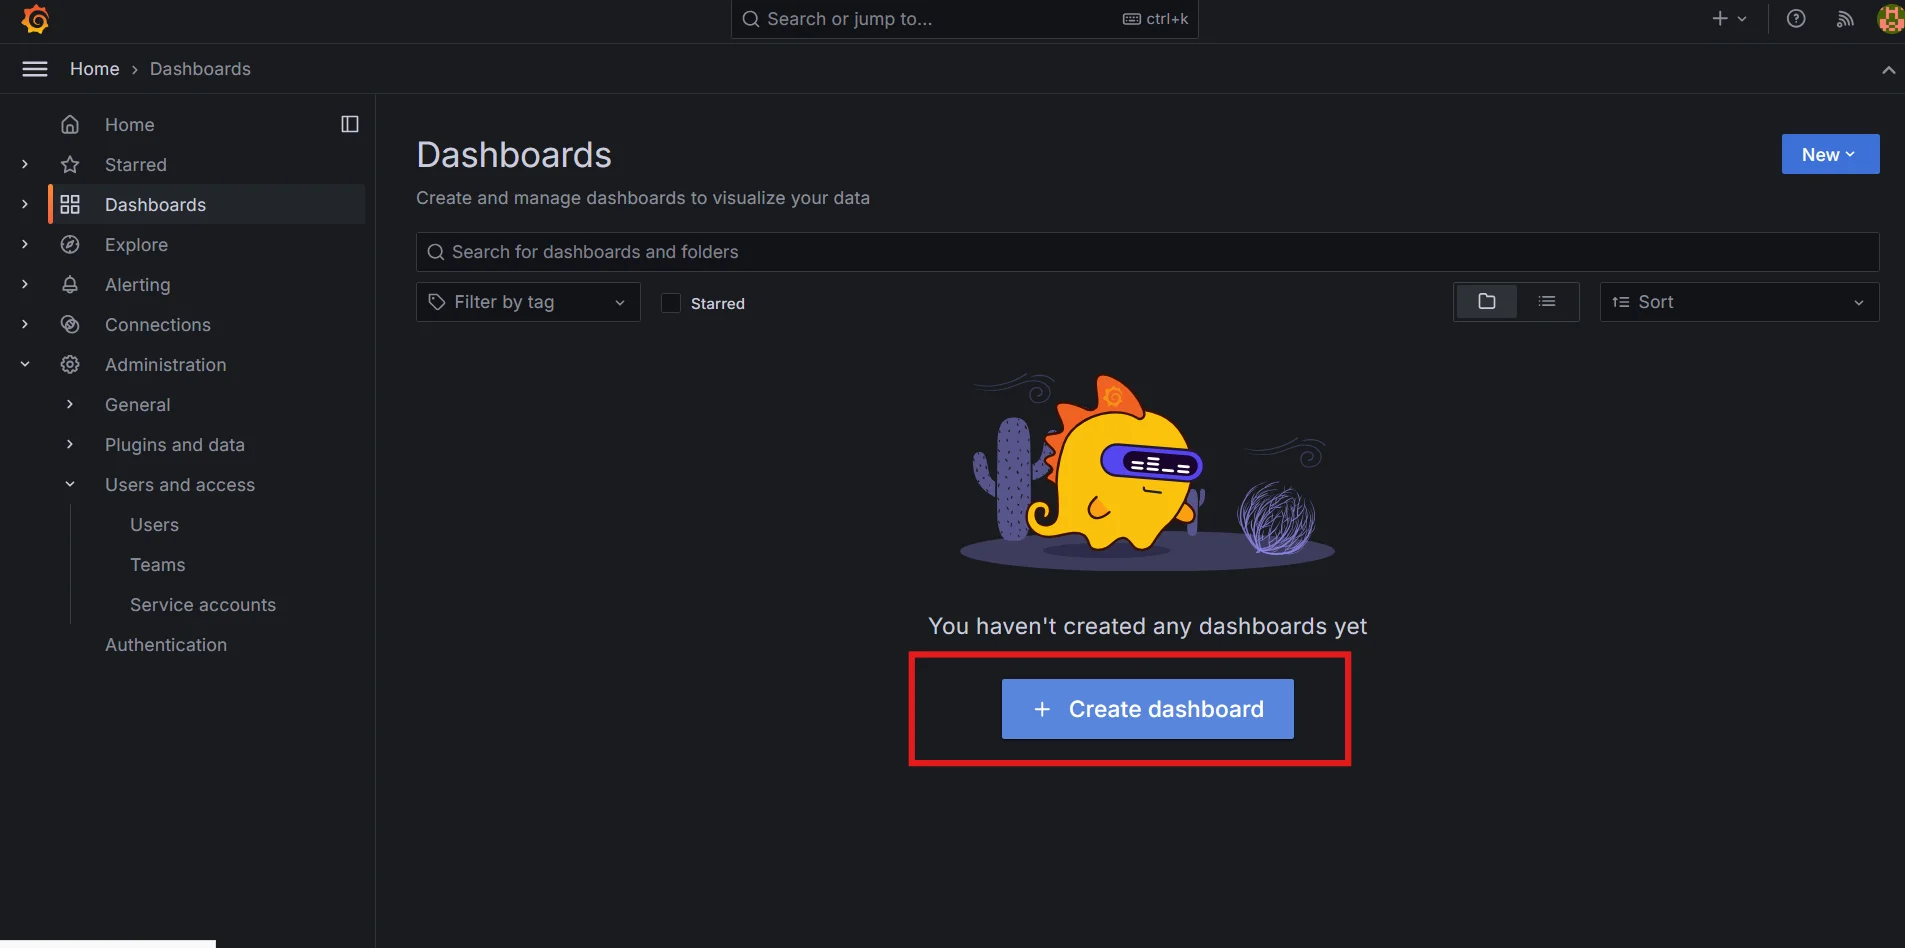
Creating Grafana Dashboard 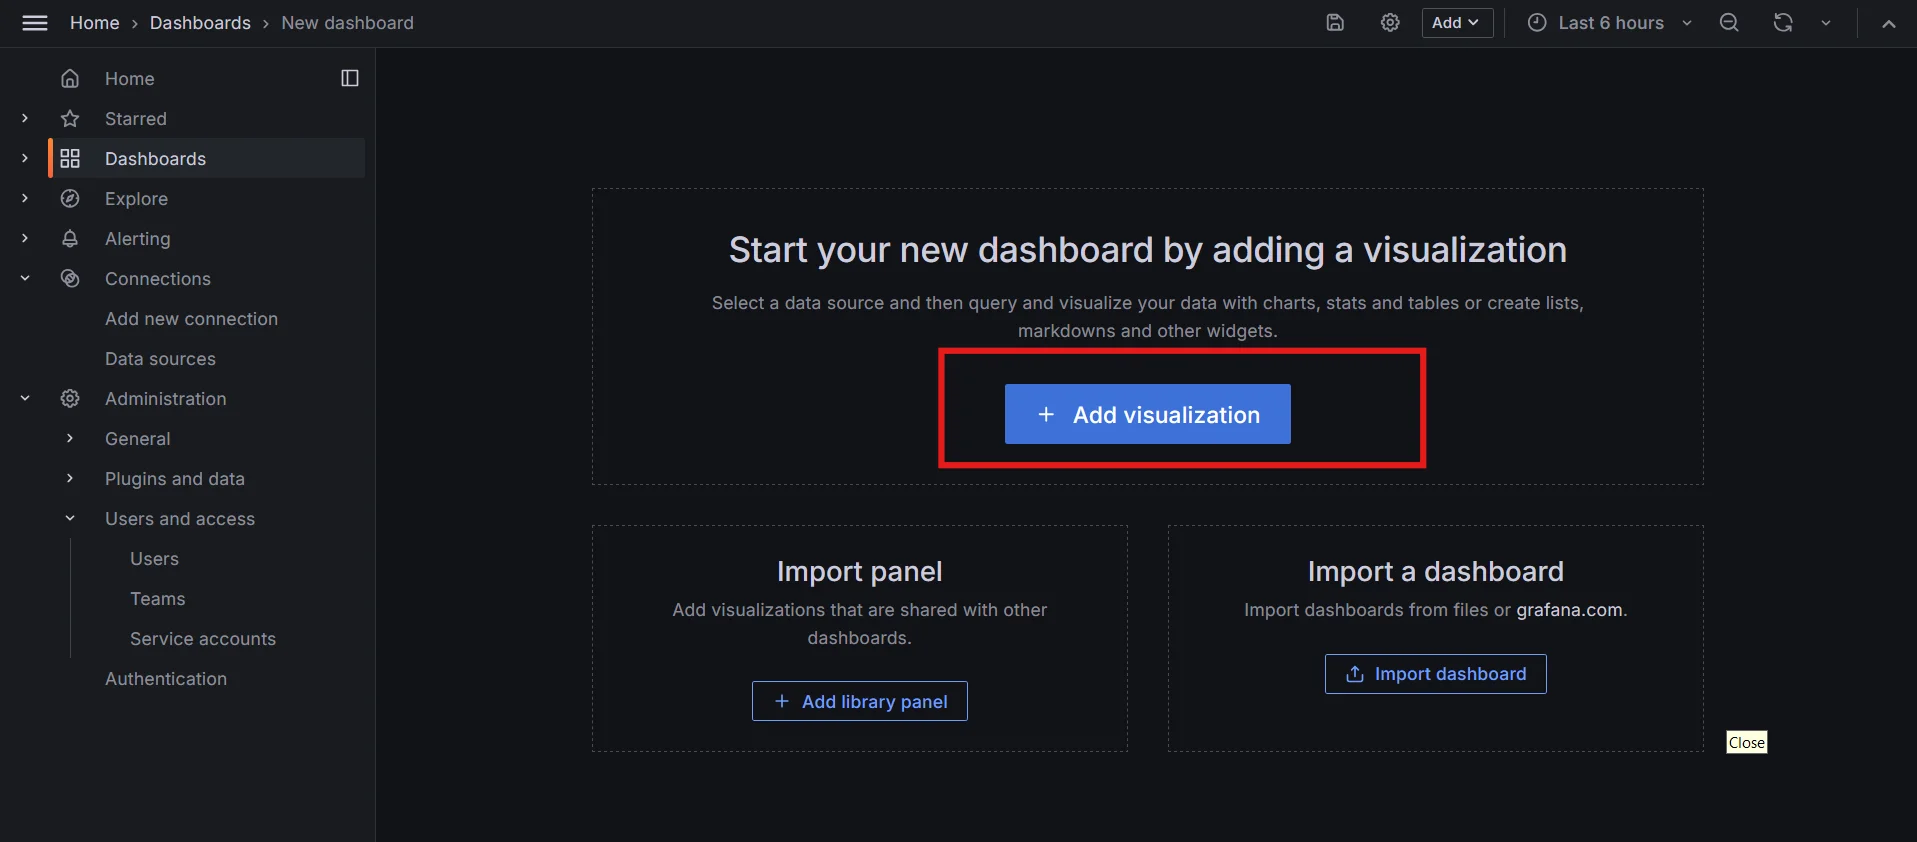
Add visualization to Grafana Dashboard Select the data source i.e. the Prometheus server.
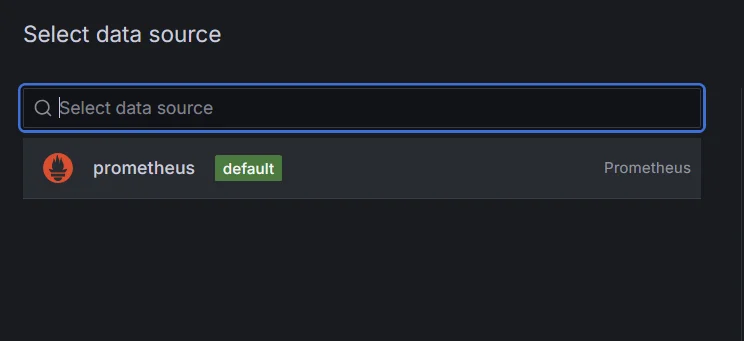
Selecting Prometheus server as data source for Grafana Dashboard Use the Prometheus query editor to enter your unique label count query (e.g.,
count(up) without(instance))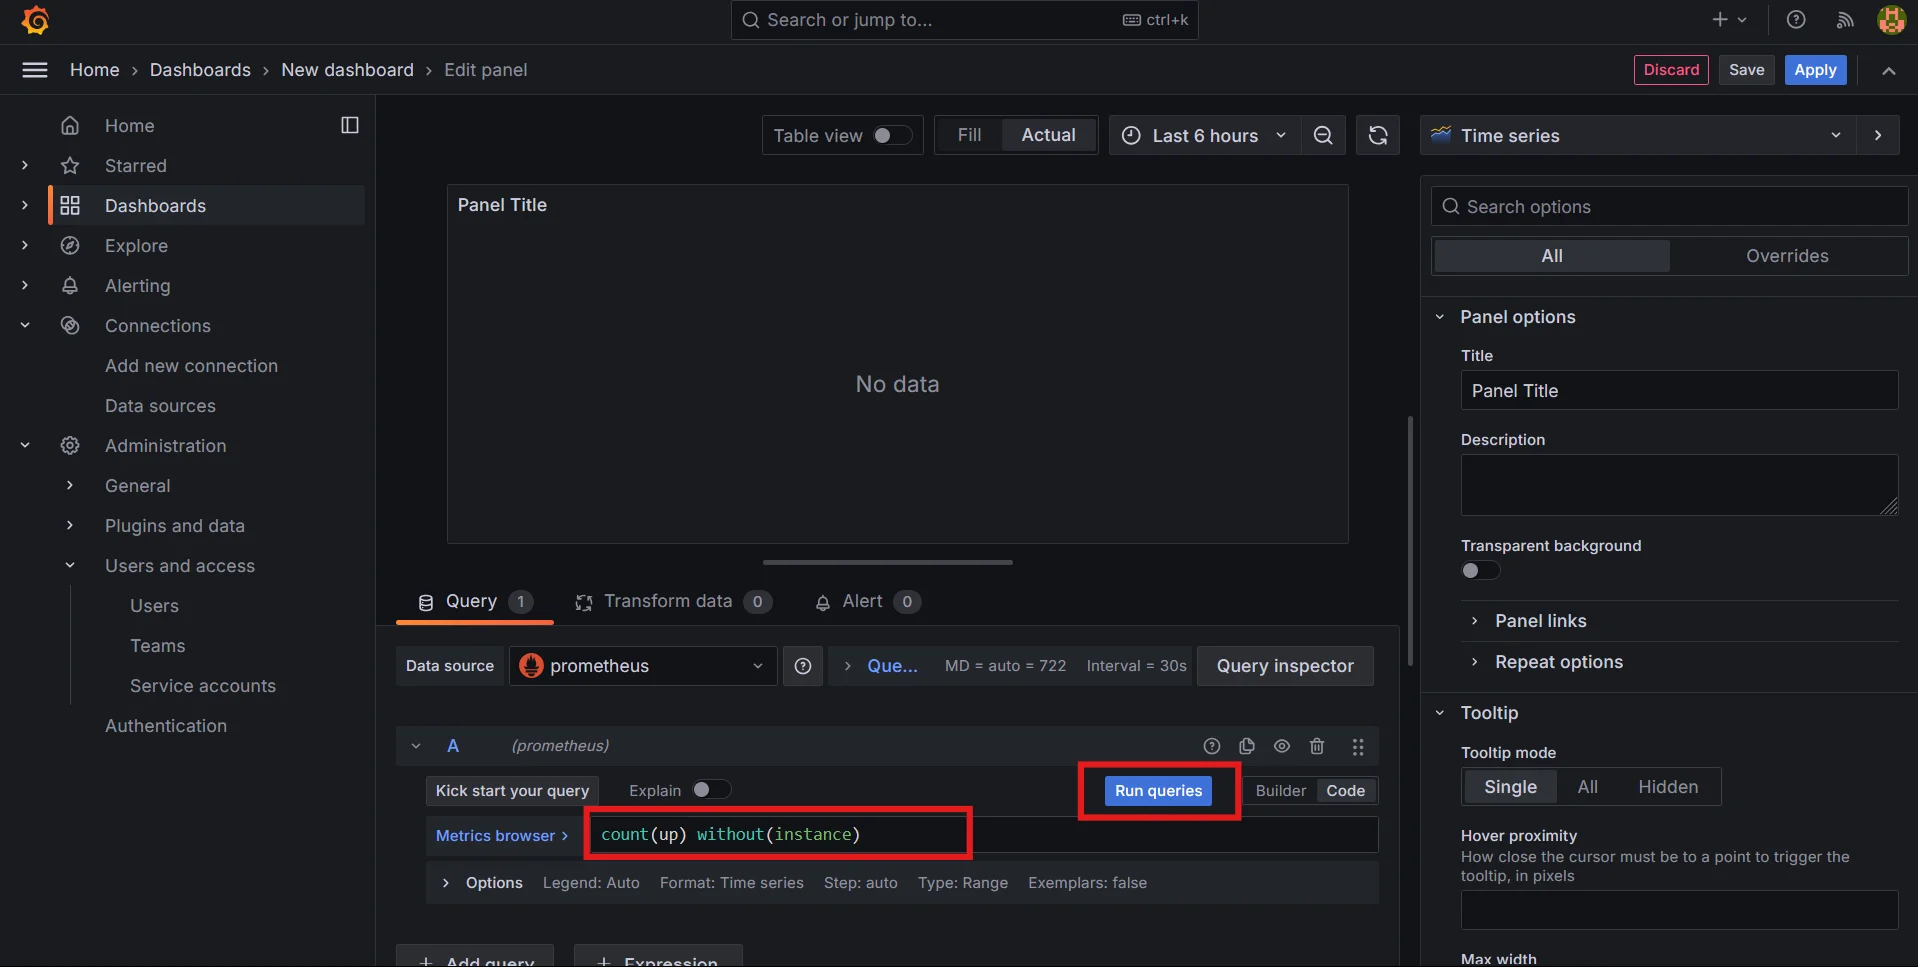
Running PromQL queries in Grafana to see unique label counts. Choose an appropriate visualization type (e.g., gauge, bar chart, or table)
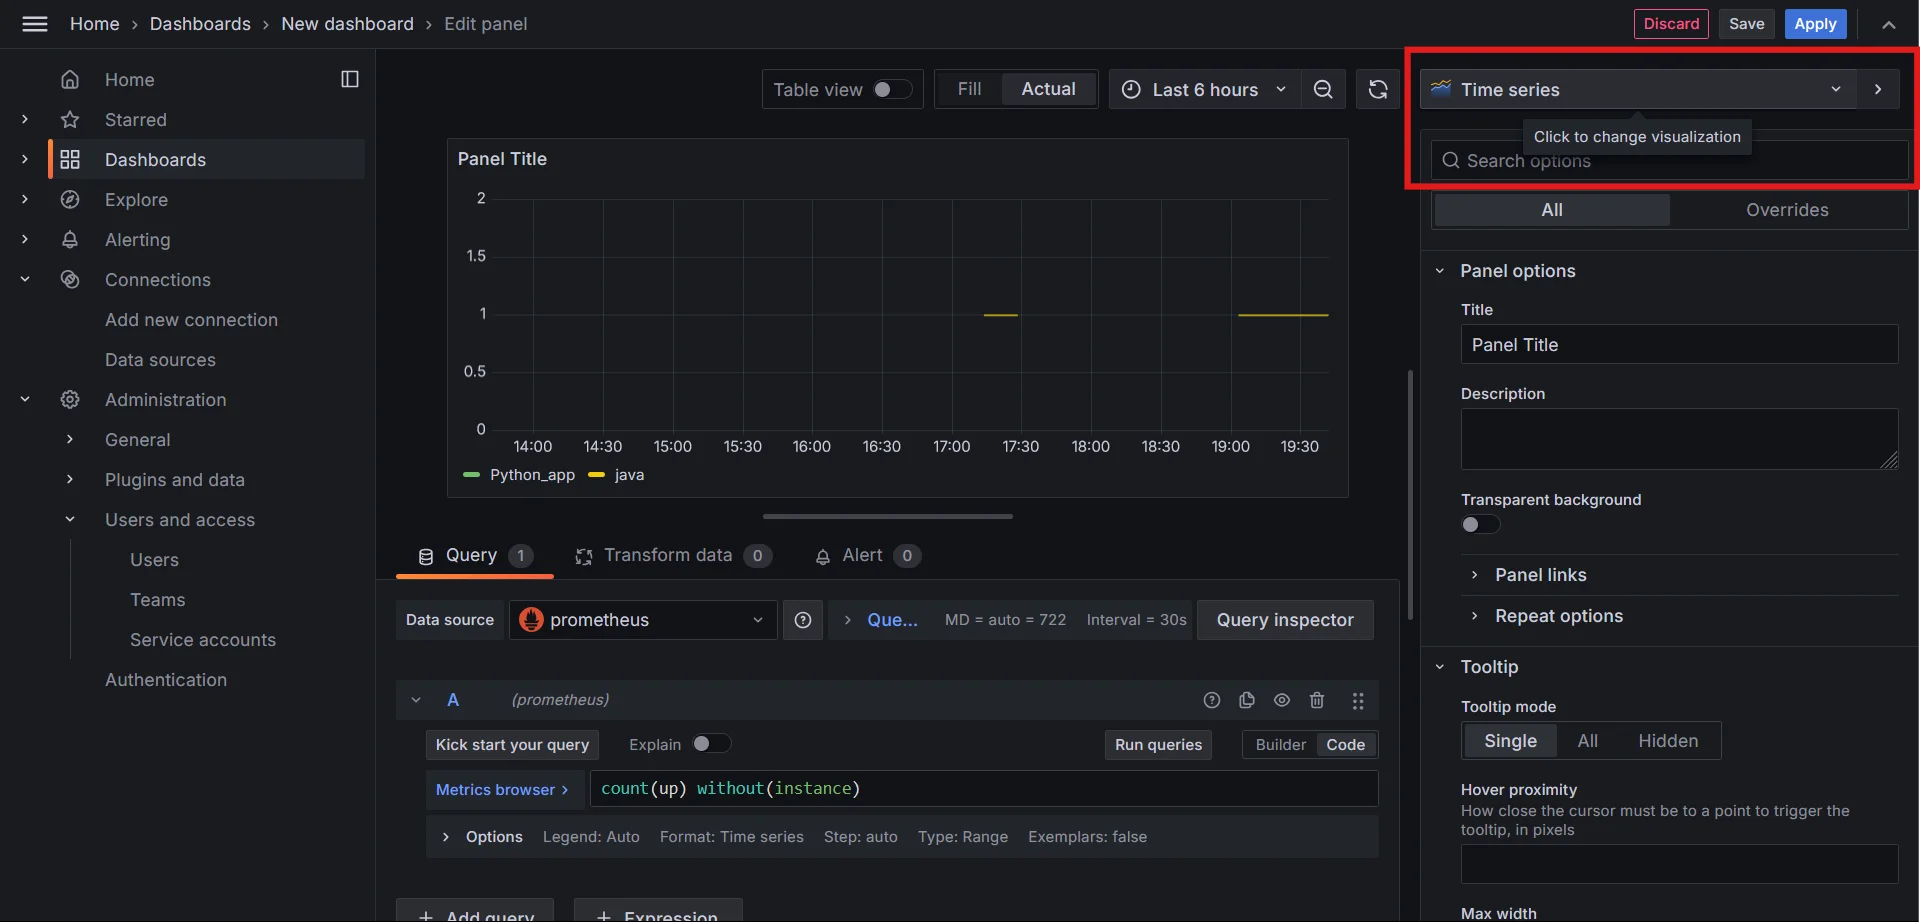
Choosing visualization type in the Grafana dashboard 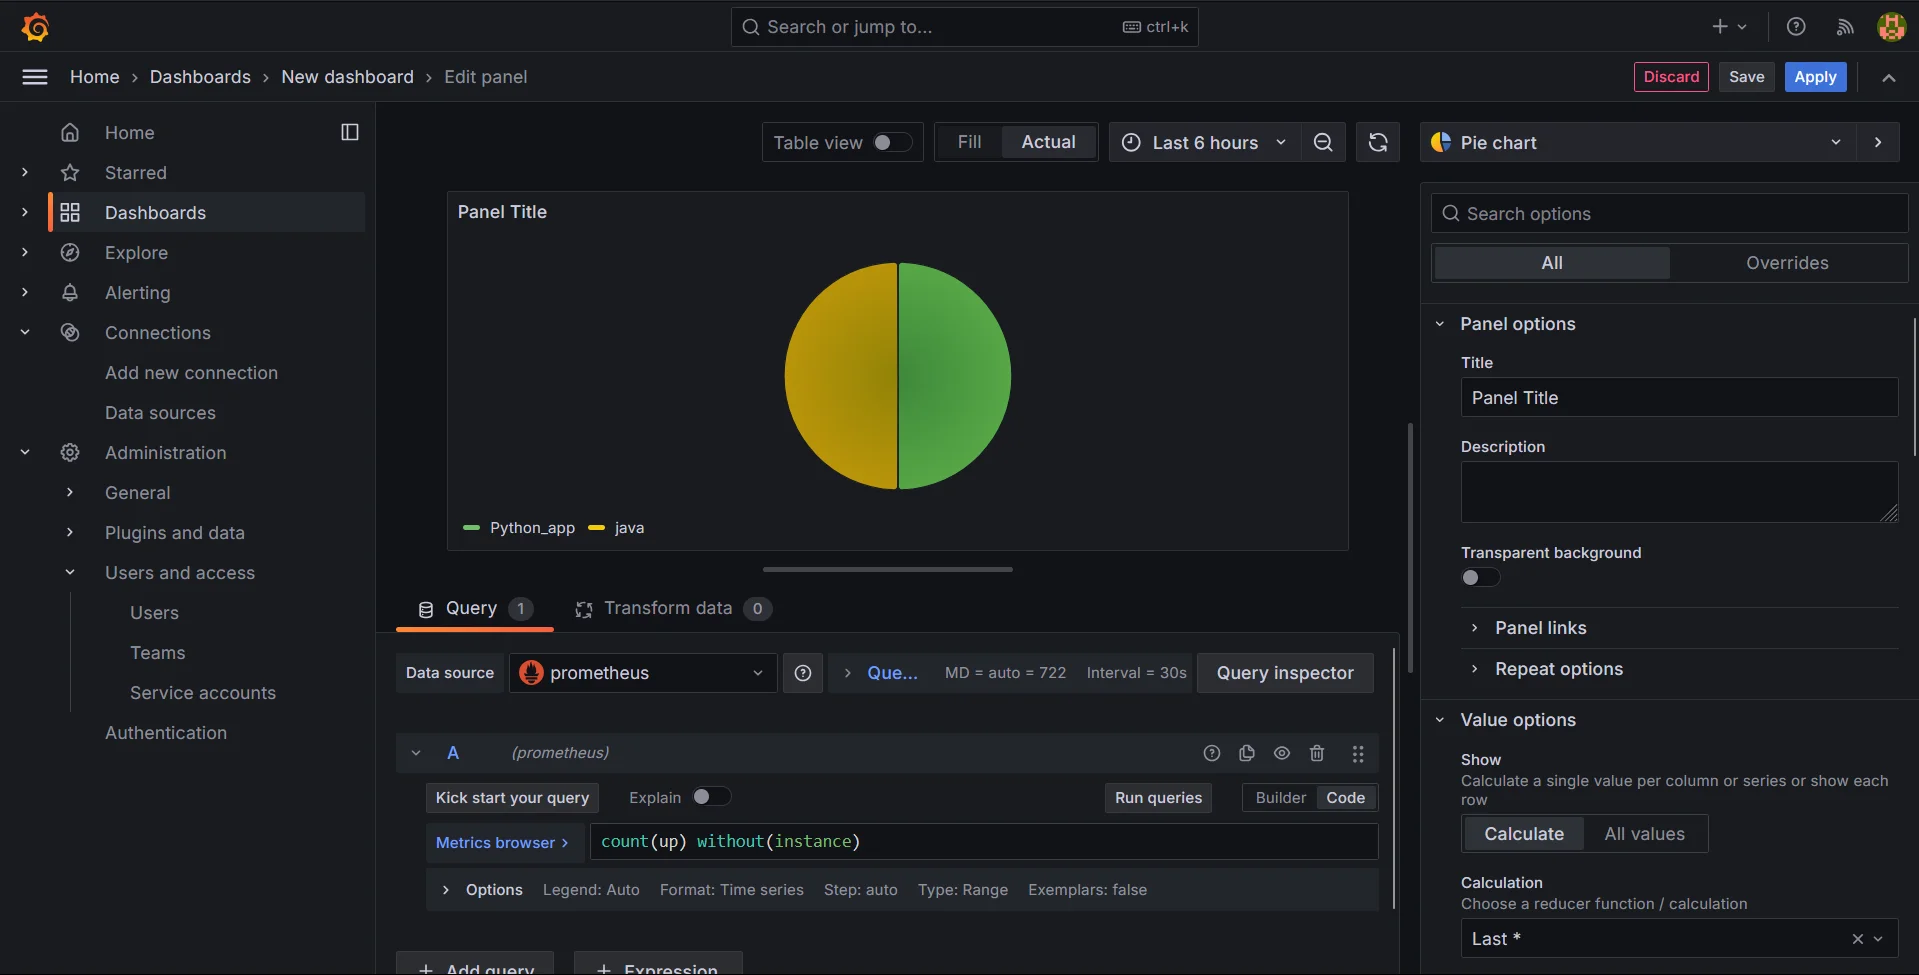
Switching to pie charts and running PromQL queries Set the panel title to "Active Instances"
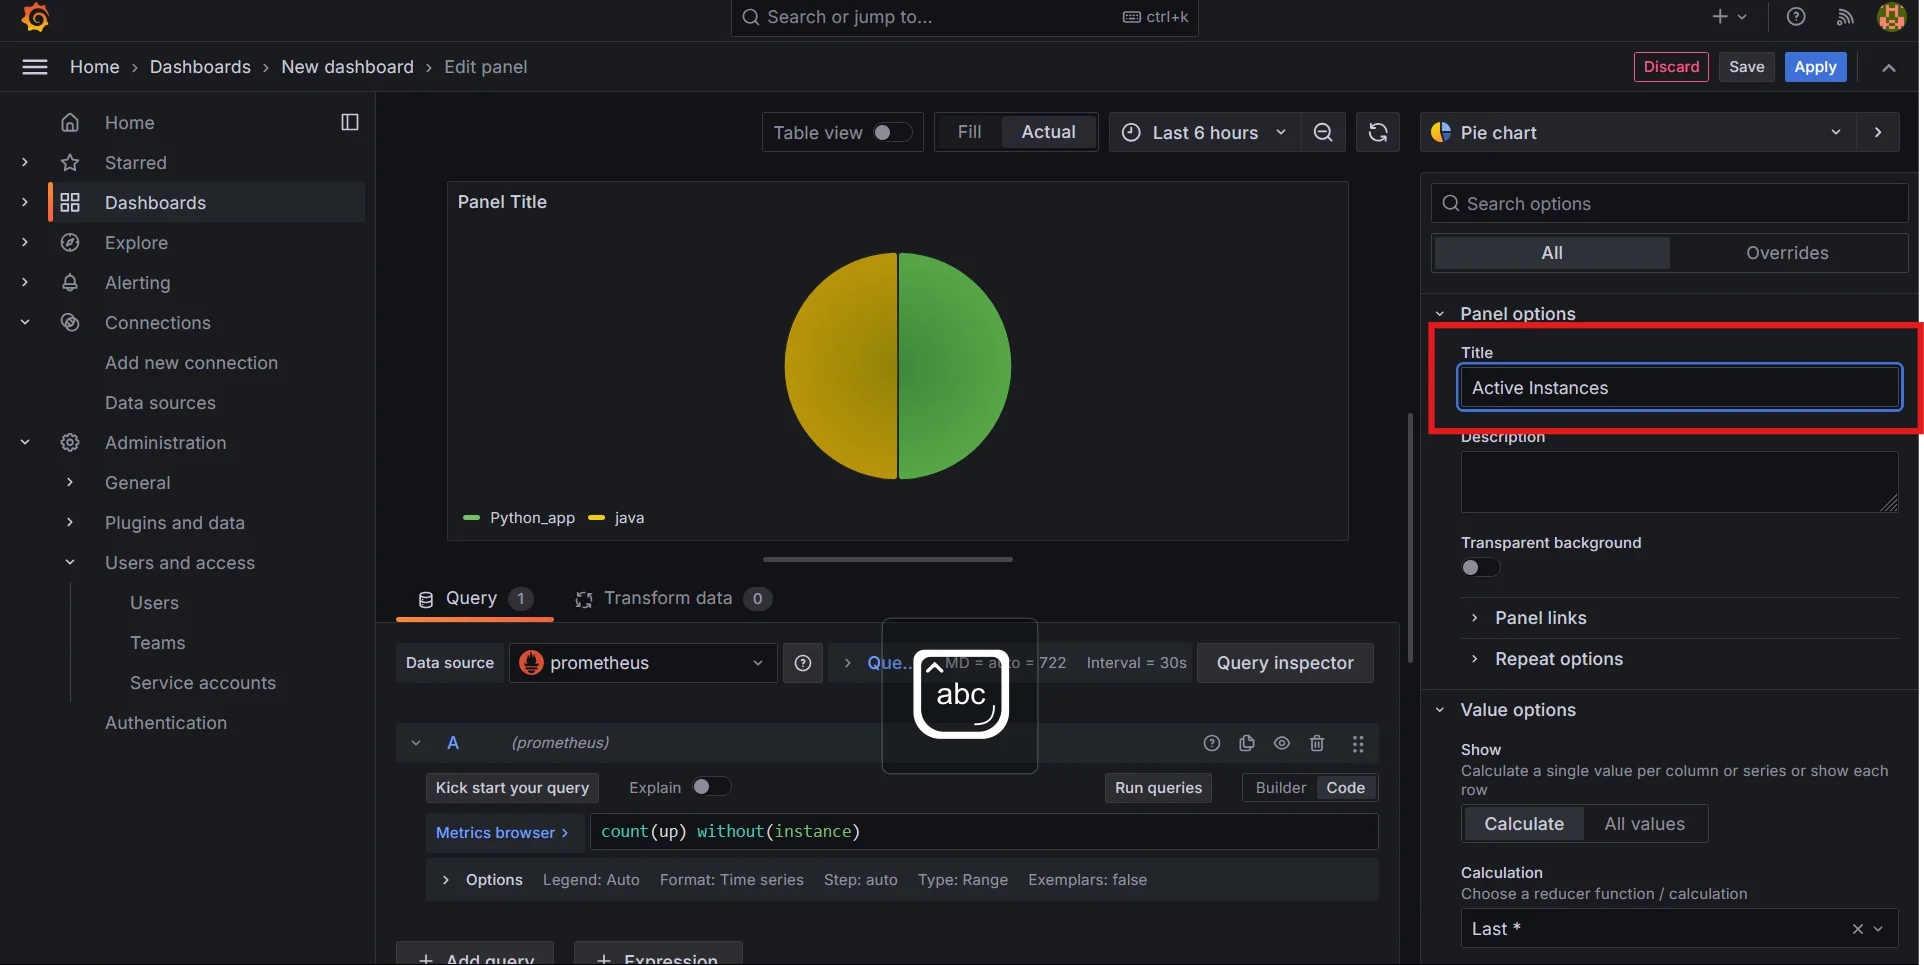
Giving a title to Dashboard Panel in Grafana Adjust thresholds and other display options as needed and apply the changes.
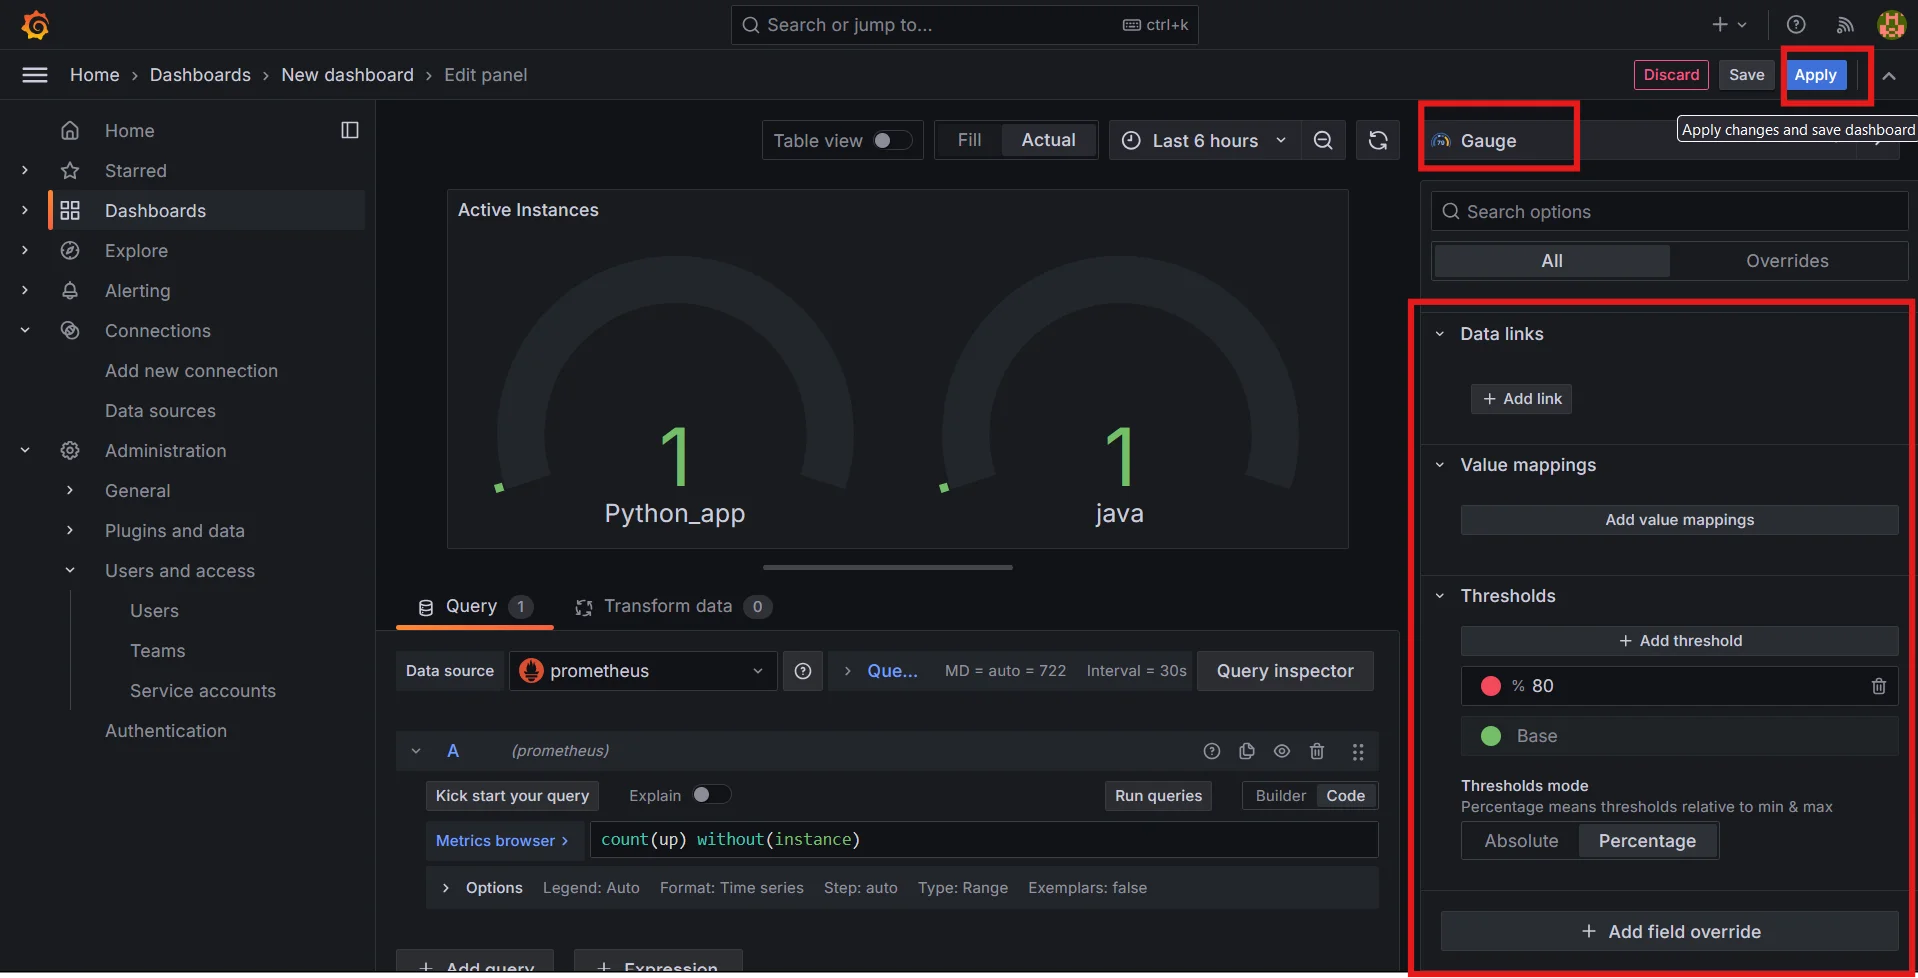
Grafana panel showing unique instance count.
Tips for effective visualizations:
- Use color-coding to highlight important thresholds
- Combine multiple unique count queries in a single dashboard for a comprehensive view
- Utilize Grafana variables to create dynamic, interactive dashboards
Limitations of PromQL
PromQL, while powerful for time-series data collection and querying, has certain limitations when it comes to advanced querying, especially with high-cardinality data and multi-dimensional analysis:
- Metrics with a large number of unique label combinations can lead to inefficiencies and increased resource usage.
- Functions like
count()andcount_values()may struggle with performance issues and become less efficient when analyzing high-cardinality metrics. - Queries requiring sophisticated grouping and aggregation across various labels can become complex and less intuitive in PromQL.
Enhancing Monitoring with SigNoz
While Prometheus is excellent for time-series data collection and querying, SigNoz extends its capabilities by offering advanced features for label-based analysis and visualization.
SigNoz is an open-source monitoring and observability platform designed to provide comprehensive insights into your applications and infrastructure. It offers a robust suite of features for tracking and analyzing metrics, traces, and logs, all from a unified interface. SigNoz aims to enhance observability, improve troubleshooting, and optimize performance across your systems.
Here’s how SigNoz complements Prometheus:
Efficient High-Cardinality Management: SigNoz is optimized to handle metrics with numerous unique label combinations, improving performance and reducing resource strain compared to standard PromQL setups.
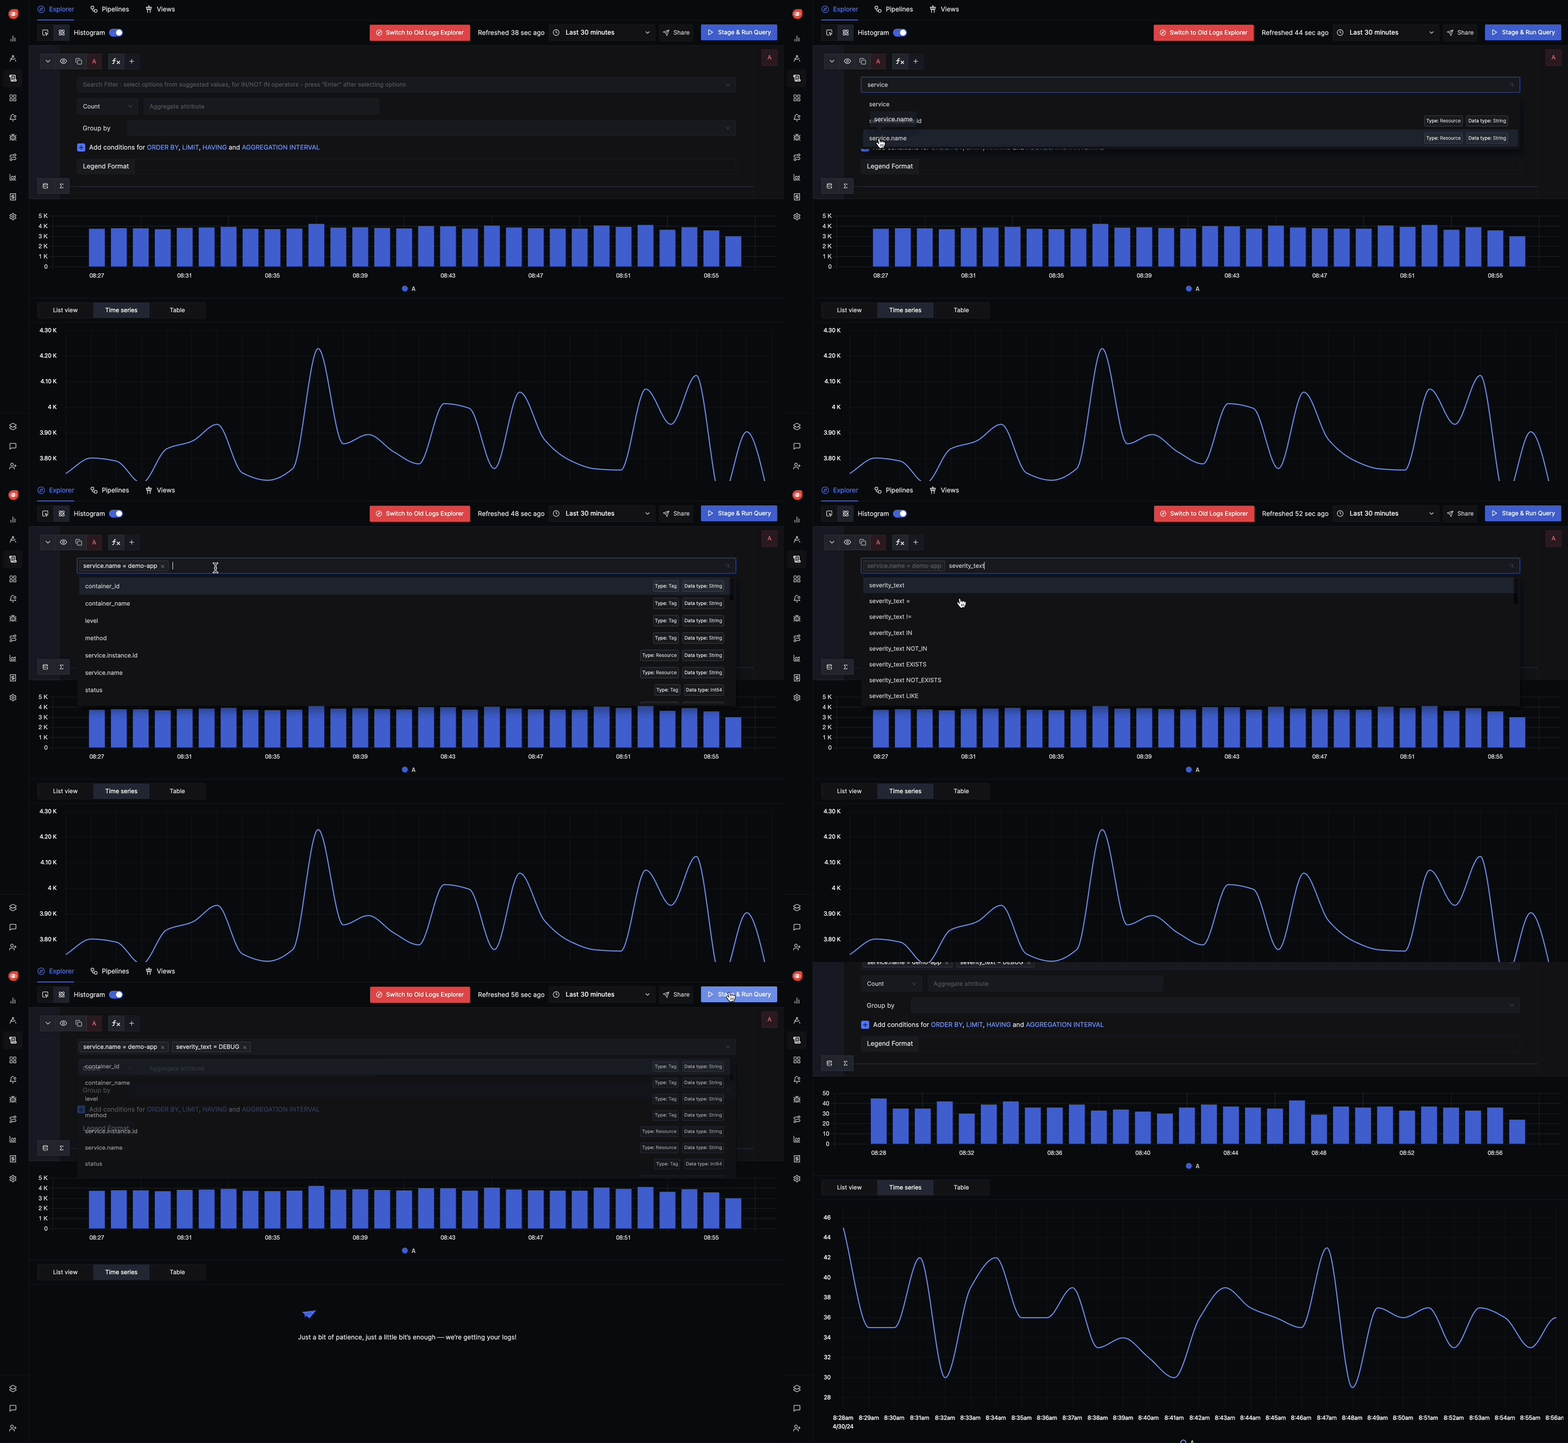
Efficient High-Cardinality Data Management using SigNoz Streamlined Querying: SigNoz offers a more user-friendly interface for constructing complex queries, making it easier to perform multi-dimensional analysis without the complexity often encountered in PromQL.
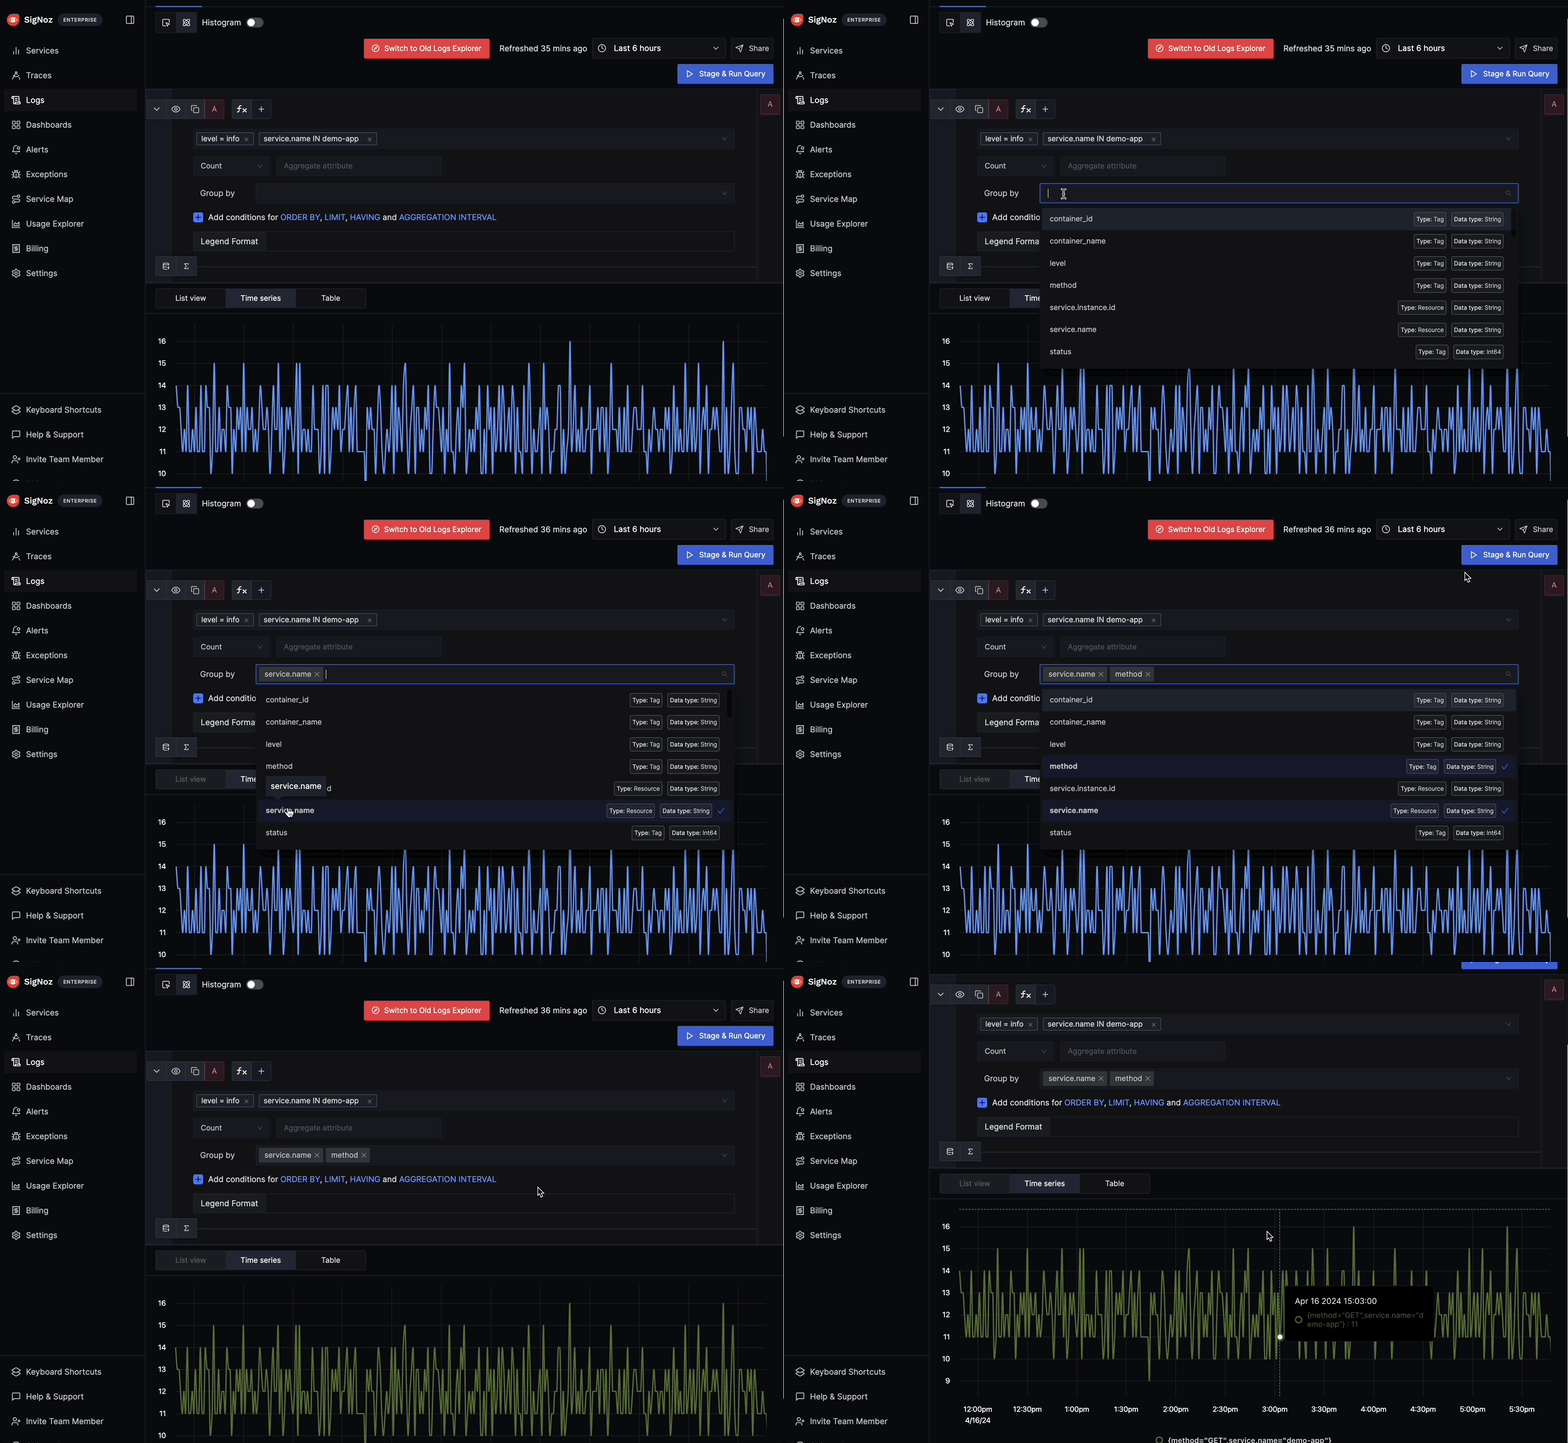
Streamline Querying using SigNoz Integrated Visualization: With built-in advanced visualization tools, SigNoz enables dynamic and insightful dashboards, making it simpler to analyze and understand metrics, especially when dealing with high-cardinality data.
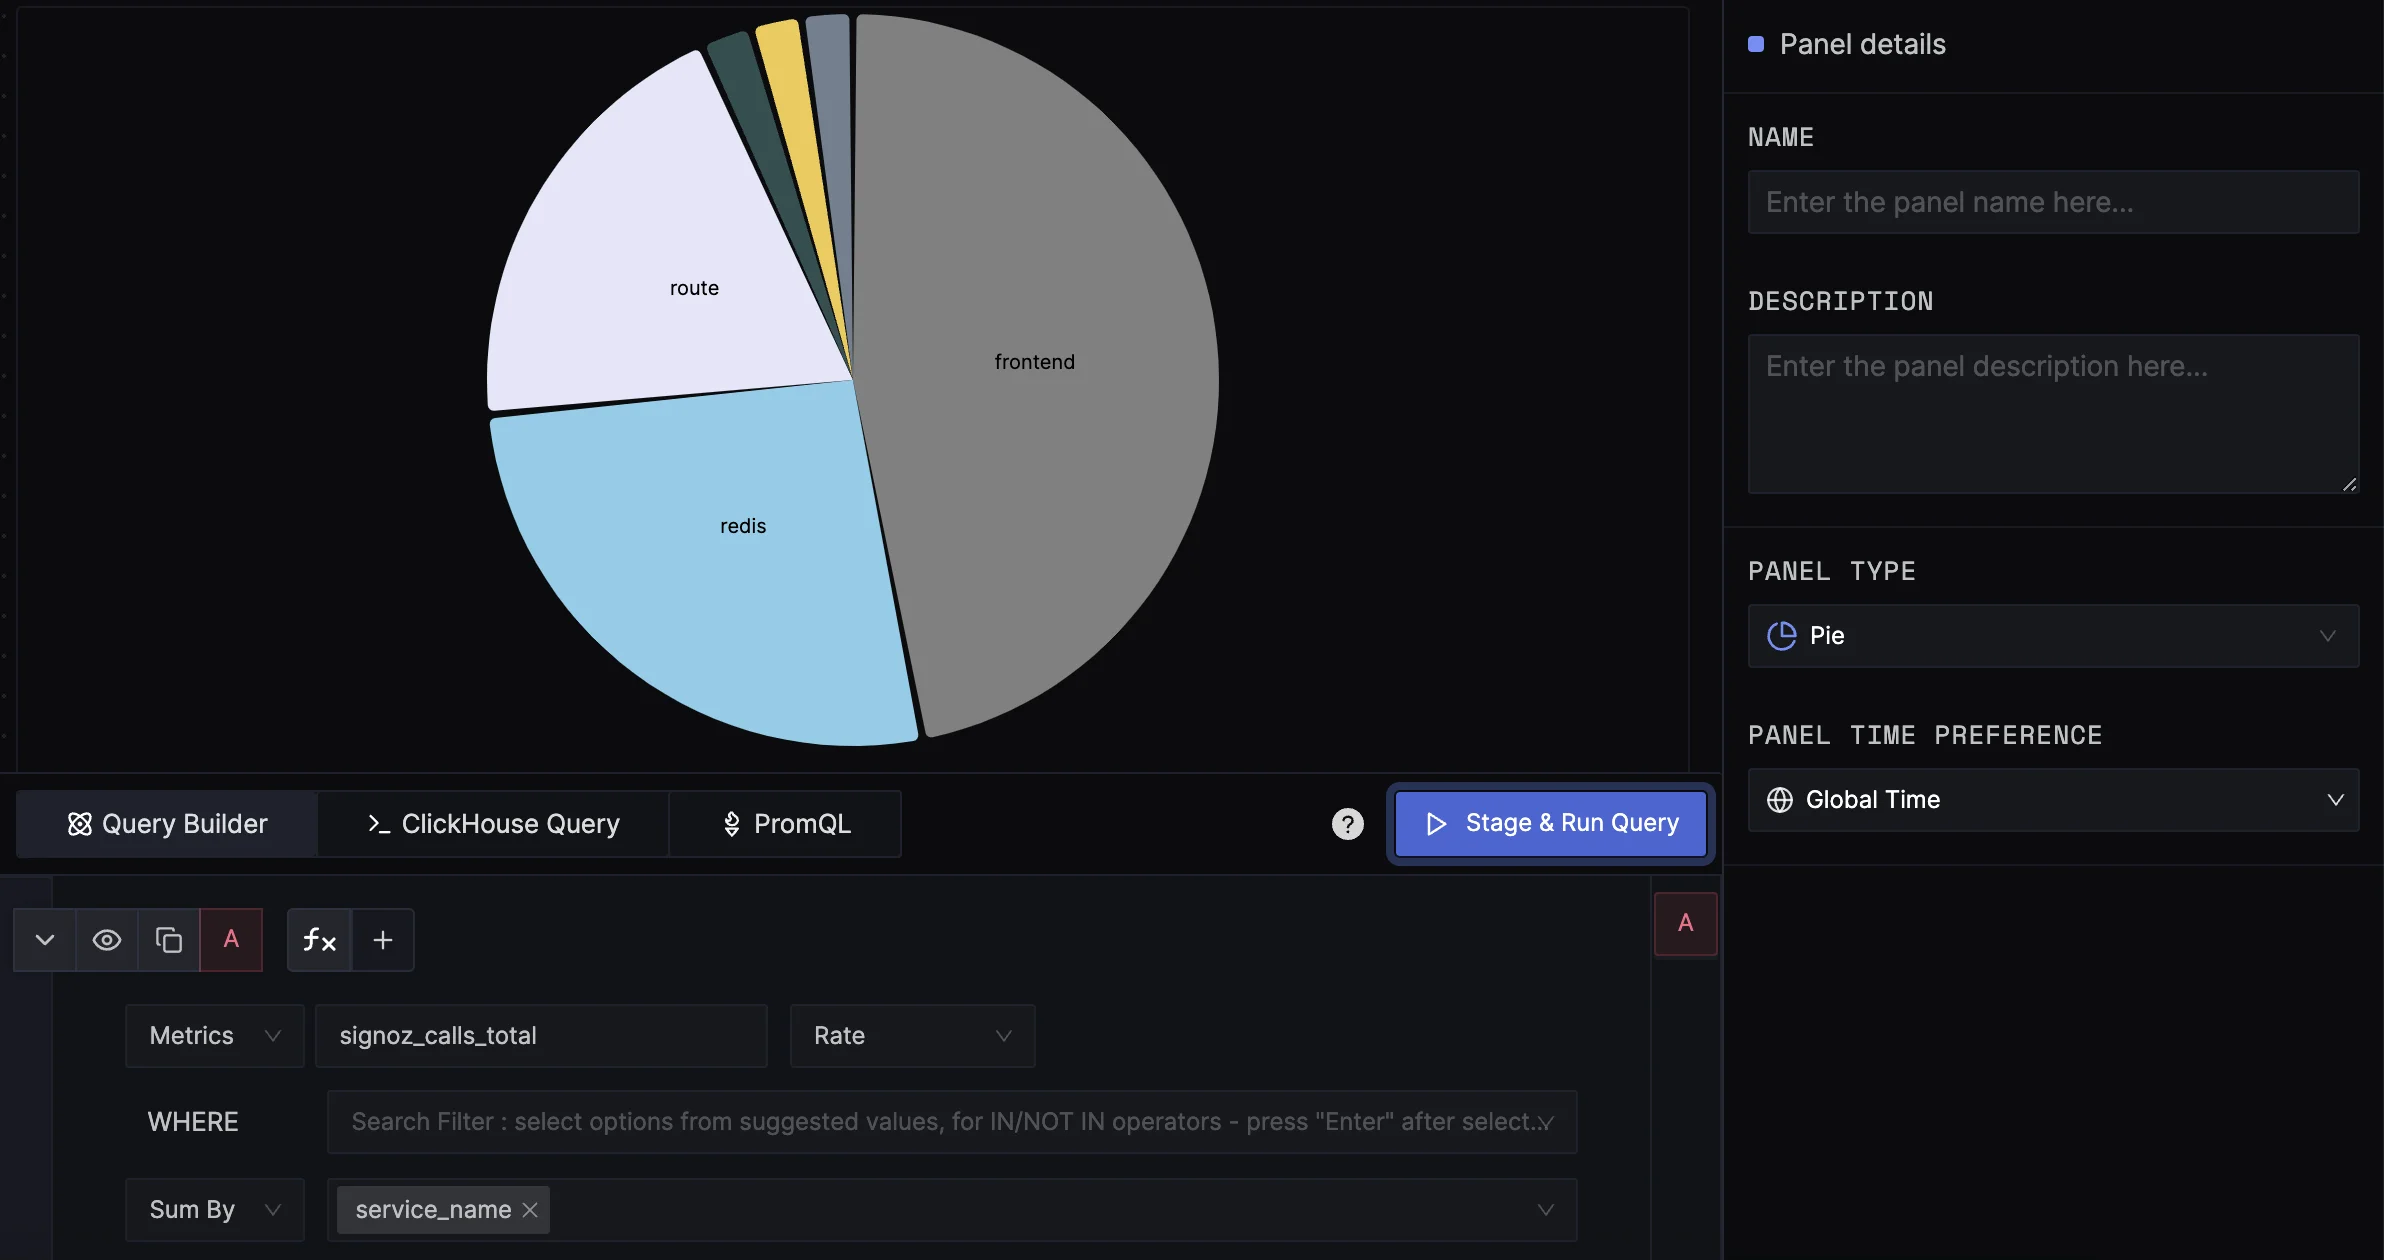
Integrated Visualization in SigNoz
SigNoz Cloud is the easiest way to run SigNoz. Sign up for a free account and get 30 days of unlimited access to all features.
You can also install and self-host SigNoz yourself since it is open-source. With 24,000+ GitHub stars, open-source SigNoz is loved by developers. Find the instructions to self-host SigNoz.
SigNoz’s capabilities provide more powerful tools for monitoring and analyzing metrics compared to PromQL, leading to improved observability and insights.
Key Takeaways
- Unique label value counting is crucial for detailed metric analysis in Prometheus
- The
count()function, combined withwithout()orby(), is the primary method for counting unique labels count_values()offers an alternative approach for specific use cases, preserving the actual values being counted- Grafana provides powerful visualization options for unique label count data
- SigNoz enhances monitoring capabilities, offering additional features for label-based analysis and high-cardinality data handling
FAQs
What's the difference between count() and count_values() in Prometheus?
count() returns the number of time series, while count_values() creates a new time series for each unique value. Use count() for simple unique counts and count_values() when you need to preserve the actual values being counted.
How can I optimize queries for counting unique labels in large datasets?
To optimize unique label count queries:
- Use specific time ranges to limit data processing
- Apply filters before counting to reduce the dataset
- Use recording rules for frequently executed queries
- Consider using SigNoz for more efficient handling of high-cardinality data
Can I use regex in label selectors when counting unique values?
Yes, you can use regex in label selectors. For example:
count(http_requests_total{endpoint=~"/api/.*"}) by (method)
This query counts unique HTTP methods for all API endpoints.
How does counting unique label values help in capacity planning?
Counting unique label values aids capacity planning by:
- Tracking the number of active resources (e.g., servers, containers)
- Monitoring user or tenant growth in multi-tenant systems
- Identifying trends in resource utilization across different services or environments
By analyzing these unique counts over time, you can forecast future resource needs and plan accordingly.
