How to Handle Null Values in Prometheus Time Series Data
When working with Prometheus time series data, encountering gaps or missing data points can be frustrating. These absences can disrupt visualizations and skew your analysis. However, setting these missing data points (or gaps) to zero can help maintain continuity in your dashboards, though it’s essential to understand when to apply this solution to avoid misleading interpretations.
In this article, we’ll explore why gaps occur in Prometheus data, how to handle them using PromQL, and when it's appropriate to fill them with zero. We'll also touch on how Grafana and SigNoz can enhance your ability to manage missing data. Let’s dive in.
Understanding Missing Data in Prometheus Time Series
In Prometheus, a "null value" doesn’t exist in the typical database sense. Instead, when we talk about missing data, we mean the absence of a data point at a specific time. This absence shows up as a gap in your time series graphs.
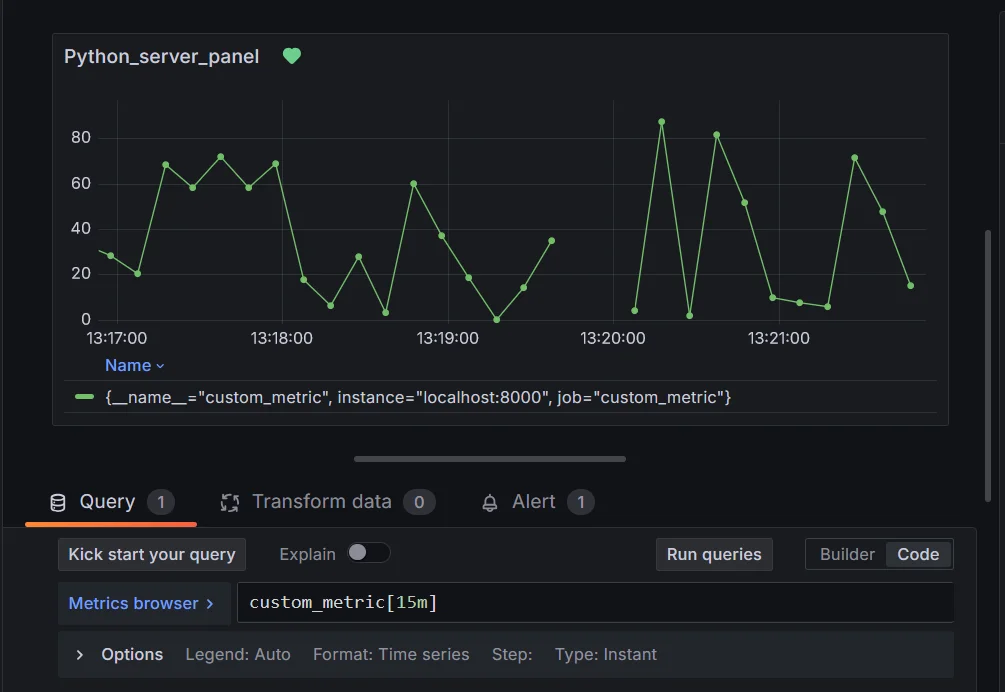
Common Causes of Missing Data:
- Scrape Failures: Prometheus scrapes targets at regular intervals. If a target is down or unreachable, Prometheus can’t gather data, leaving a gap.
- Absent Metrics: Sometimes, metrics are not emitted during a certain period, especially in applications that only report specific events.
- Counter Resets: For counter metrics (which track cumulative counts), resets can appear as a missing data point or a sudden drop, depending on how the graph is visualized.
Why Does This Matter?
These missing data points can confuse visualizations. You might misinterpret gaps as zero or simply overlook them in key parts of your analysis. Properly handling missing data ensures that your graphs reflect reality without introducing misleading trends. You can understand this better with the help of the scenario listed below.
Scenario: Monitoring Server CPU Usage
Imagine you're monitoring CPU usage across multiple servers in your infrastructure using Prometheus and visualizing the data in Grafana. The metric you're tracking is cpu_usage_percent, which records the percentage of CPU utilization at regular intervals (every 10 seconds).
Normal Situation
When everything is running smoothly, the graph in Grafana shows a continuous trend of CPU usage, fluctuating between 30% and 80%:
Time:   |--------|--------|--------|--------|
CPU %:  |  40%   |  50%   |  70%   |  65%   |
You can easily spot high usage peaks and take necessary action, such as scaling resources if the usage remains consistently high.
Data Gaps Without Proper Handling
Now, imagine that for a few minutes, one of your servers stops sending metrics due to a network issue or because Prometheus couldn't scrape the data. This results in missing data points during that period:
Time:   |--------|--------|--------|--------|--------|--------|
CPU %:  |  40%   |  50%   |   -    |   -    |   -    |  65%   |
- Impact: If the graph doesn't handle missing data well, it will show gaps where the data is missing. You might overlook this gap and assume that nothing significant happened during that time. However, it could represent a critical outage, a CPU spike, or other vital information that went unnoticed due to missing data.
Should You Set Gaps as Zero in Prometheus?
When is Setting Gaps to Zero a Good Idea?
There are cases where filling in missing data points with zero can make sense, especially when:
- You’re analyzing trends: Gaps in data can disrupt trends, making it hard to follow patterns over time. Filling them with zeros smooths out the visual, giving you a continuous line to track performance.
- You want consistent graphs: Gaps can make your graphs hard to read. By setting these to zero, you ensure there are no breaks, improving readability.
When Should You Avoid Setting Gaps to Zero?
Filling in missing data with zero isn’t always the right solution. For certain metric types, especially counters, setting a gap to zero can suggest something that didn't actually happen:
- Counter metrics: Zero might imply a reset or sudden drop, which could skew your understanding of system behavior.
- Sporadic metrics: For metrics that are emitted only under specific conditions, setting missing points to zero can distort the truth, making it seem like nothing happened when the data should just remain absent.
For example, if you look back to the previous scenario where missing data points existed for CPU usage data. Without proper handling, you might configure the graph to default missing data to zero. Now, your graph looks like this:
Time:   |--------|--------|--------|--------|--------|--------|
CPU %:  |  40%   |  50%   |   0%   |   0%   |   0%   |  65%   |
- Impact: The graph now shows that CPU usage dropped to 0% for those missing intervals. This can lead to a misleading trend where it seems like your server experienced zero CPU activity during that period. However, the reality is that no data was collected, not that the CPU usage dropped to zero. You might falsely conclude that everything was fine or under-utilized, when in fact, the server might have been down or highly overloaded.
Methods to Handle Missing Data in Prometheus Queries
Handling missing data points in Prometheus is crucial for ensuring accurate visualizations and analyses. Below, you'll find two sections outlining basic and advanced methods for managing missing data.
Basic Methods for Handling Missing Data
Using
or vector(0)- This technique allows you to replace missing values with zero.
custom_metric or vector(0)- Explanation: This query returns the value of
custom_metric, and if it’s absent, it defaults to0.
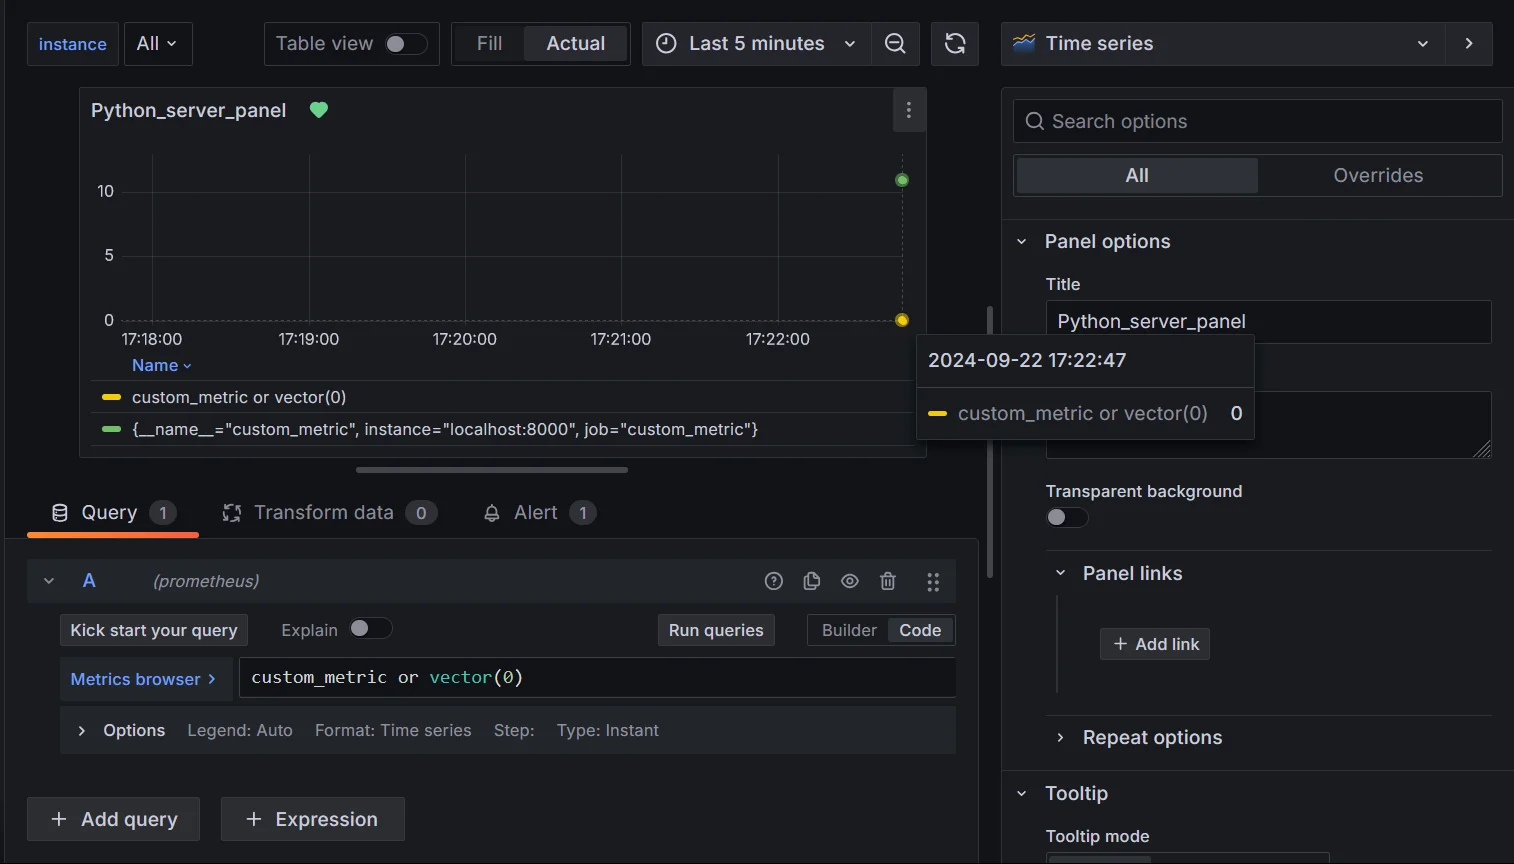
Handling missing data using vector(0) Use Case: Imagine monitoring server CPU usage. If the server goes offline, rather than seeing a confusing gap, you can treat the missing data as
0, indicating that the server wasn’t active.Utilizing the
absent()Function- The
absent()function helps identify completely missing metrics.
absent(custom_metric)- Explanation: This query returns a value when
custom_metricis not present, useful for alerting on missing metrics.
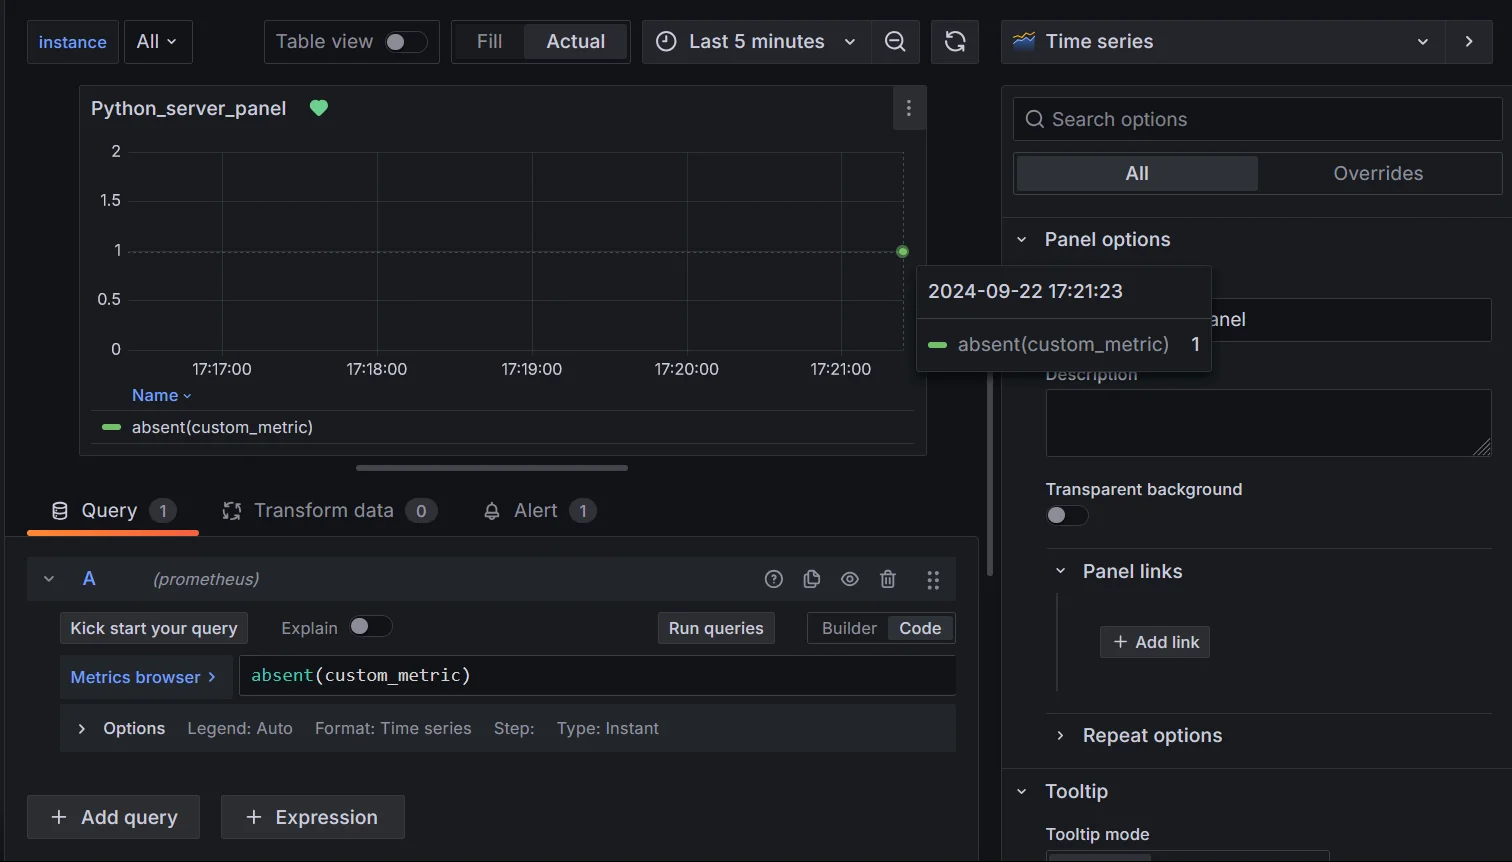
Handling missing data using absent() Use Case: In a microservices architecture, you'll want to know if a service’s health metric stops being scraped.
absent()can alert you that the service may be down or unreachable, helping to detect system failures early.Note: It returns an empty vector if the vector passed to it has any elements and a 1-element vector with the value 1 if the vector passed to it has no elements.
- The
Advanced PromQL Techniques for Null Handling
Applying
group_leftandgroup_rightfor Label Matching- Scenario: You have two metrics: one for system resource usage (e.g., CPU) and another for error rates. The second metric (
error_rate) doesn’t always have data for every instance, leading to missing information when you attempt to join the two. - Solution: Use
group_leftorgroup_rightdepending on the label relationship to include all relevant data, even if some metrics are missing values.
Syntax:
# for left join
metric_a * on(label) group_left(label_value) metric_b or vector(0)
# for right join
metric_a * on(label) group_right(label_value) metric_b or vector(0)
Query examples:
# Left join example
system_resource_usage * on(instance,exported_instance) group_left error_rate or vector(0)

# Right join example
error_rate * on(instance,system_resource_usage) group_right or vector(0)
Explanation:
group_left: Matchessystem_resource_usagewitherror_ratefor each instance and exported instance, ensuring that missing error values are filled with0.group_right: Ensures all error rates are preserved even if the resource usage data is missing for some instances.or vector(0): Fills missing values with0for better visualization.
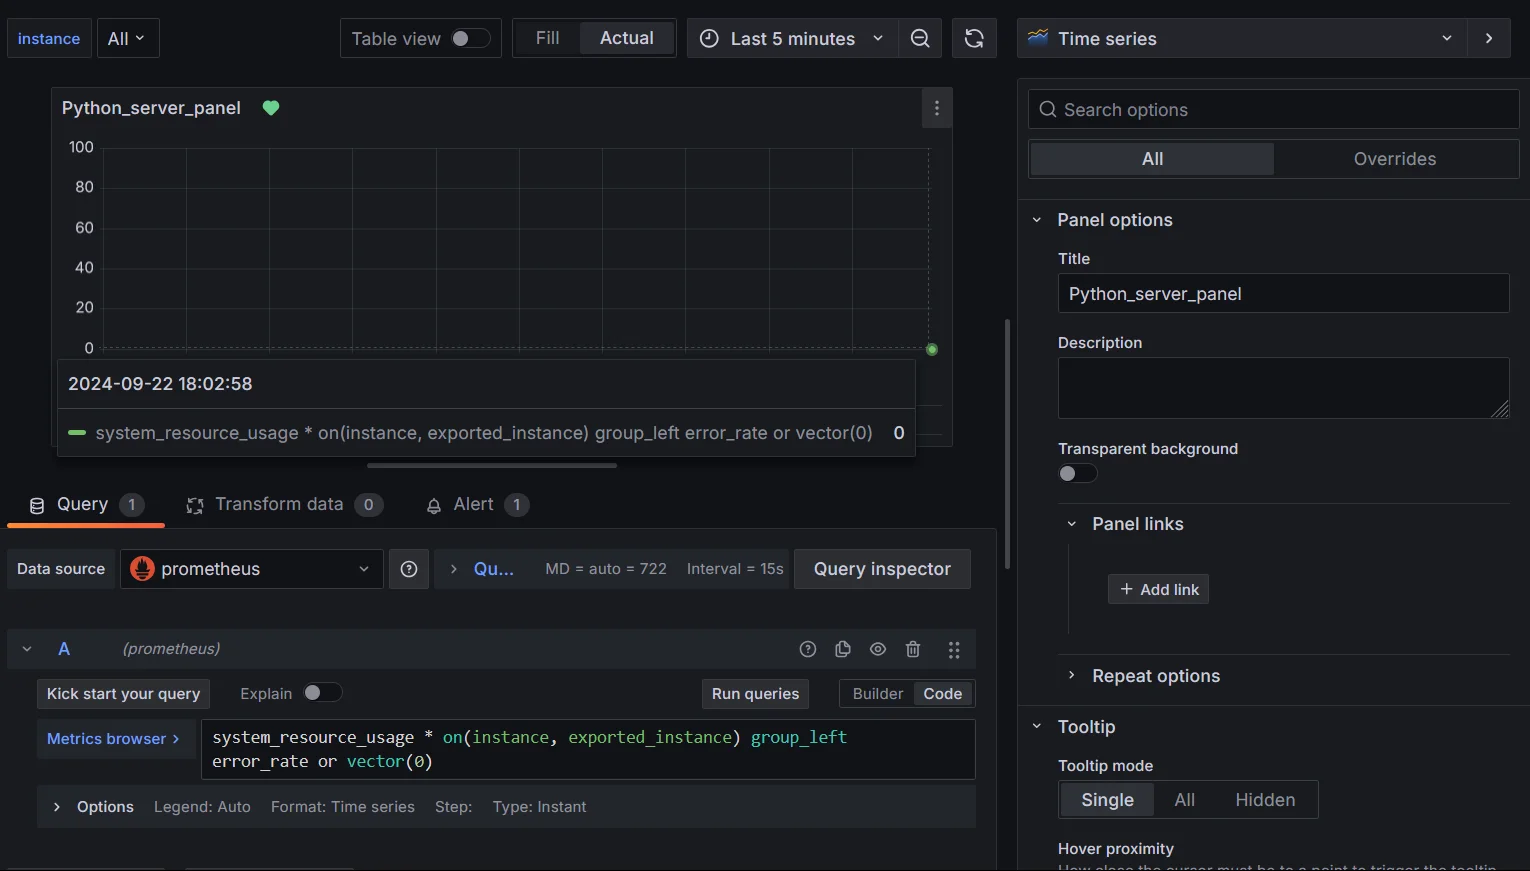
Handling missing data using group_left() Use Case: You’re monitoring CPU usage per instance alongside error rates. By using
group_left, you ensure that even if there are no errors for certain instances, the CPU usage is still included in your visualizations, and errors are treated as zero instead of missing. Alternatively, usegroup_rightif you prioritize error rate data over system resource metrics.- Scenario: You have two metrics: one for system resource usage (e.g., CPU) and another for error rates. The second metric (
Using
absent_over_time()for Detecting Long-Term Absences- Scenario: You’re monitoring a critical metric over time and want to detect if it has stopped reporting for an extended period, indicating a problem with the service or the metric’s availability.
- Solution: Use
absent_over_time()to monitor whether a metric has been missing for a defined period.
absent_over_time(custom_metric[1m])Explanation: This function returns a value if
custom_metrichas been absent for the last 1 minute, useful for identifying metrics that are not being scraped over extended periods.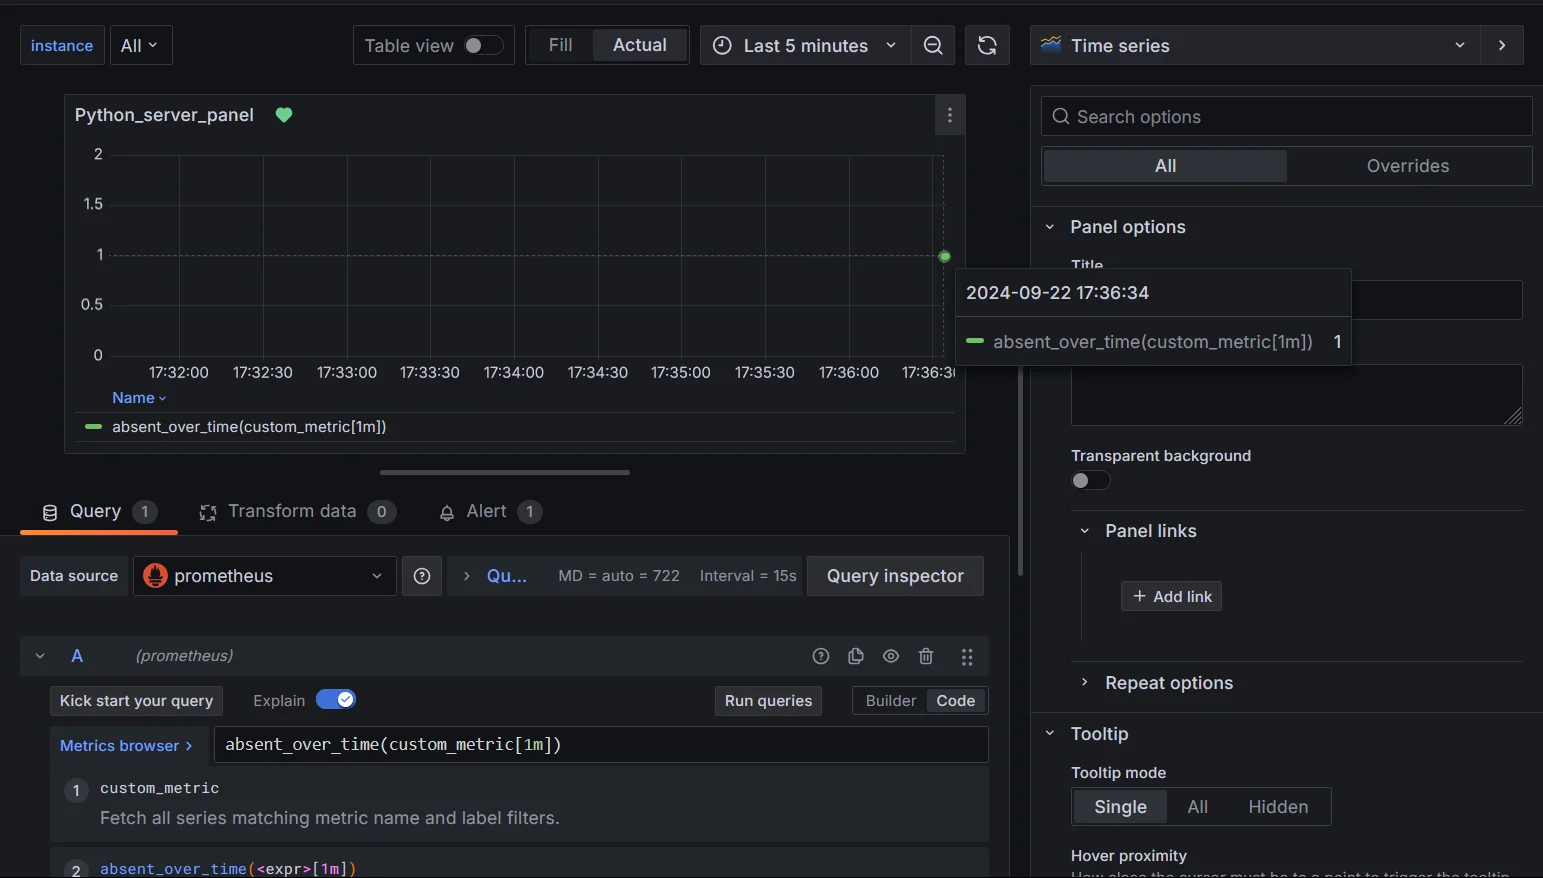
Handling missing data using absent_over_time()
Best Practices for Handling Null/Missing Values in Time Series Data
To effectively manage null values in the Prometheus time series:
- Understand the Causes: Investigate why data is missing, such as network issues or service downtime, and document these findings for future reference.
- Choose Appropriate Methods: Select handling methods based on context. For instance, set missing values to zero if no activity is expected, or use interpolation for continuous data.
- Regularly Audit Data Collection: Monitor the metrics collection process to ensure it functions correctly. Adjust scrape intervals based on data volatility.
- Document Strategies: Maintain clear documentation on how missing values are handled, and use comments in PromQL queries for clarity.
Monitoring Gaps in Data with SigNoz
SigNoz is a powerful observability tool that allows you to track missing data points more effectively, helping you avoid blind spots in your monitoring. SigNoz can help you in:
- Detecting Missing Data with SigNoz SigNoz can alert you to missing data automatically by configuring rules for your most critical metrics. This means you won’t have to rely on visually spotting gaps in your Grafana dashboards; instead, SigNoz can proactively notify you.
- Visualizing Data Gaps in SigNoz Dashboards SigNoz provides advanced visualizations for analyzing patterns in missing data. This can help you see trends where certain metrics go missing frequently, helping you dig into root causes and improve data collection reliability.
SigNoz Cloud is the easiest way to run SigNoz. Sign up for a free account and get 30 days of unlimited access to all features.
You can also install and self-host SigNoz yourself since it is open-source. With 24,000+ GitHub stars, open-source SigNoz is loved by developers. Find the instructions to self-host SigNoz.
Key Takeaways
- Missing data points (or gaps) in the Prometheus time series can occur due to various reasons like scrape failures or counter resets.
- While setting missing data to zero can smooth out your visualizations, it’s important to use this technique wisely to avoid skewing your analysis.
- PromQL provides several methods like or vector(0) and absent() to handle missing data.
- Best practices involve choosing appropriate methods, documenting strategies, and regular audits of null handling approaches.
- Tools like SigNoz can provide advanced capabilities for monitoring, alerting, and analyzing null value patterns in your time series data.
FAQs
What causes null values in Prometheus time series data?
Missing values in Prometheus time series can be caused by temporary service outages, network issues, scrape failures, or the absence of specific metrics during certain time intervals.
How do null values affect time series analysis?
Null or missing values can lead to broken graphs, skewed calculations, and false alerts. They can make trend analysis difficult and potentially lead to misinterpretation of data.
Can setting nulls to zero lead to data misinterpretation?
While setting nulls/missing values to zero can improve data continuity, it's important to understand the context of your metrics. For some types of data, zero might not be an appropriate replacement for a null value. Always consider the nature of your metrics when deciding how to handle null values.
What are the differences in handling nulls for counters vs. gauges?
For counters, which only increase over time, setting nulls to zero might not be appropriate as it could indicate a reset. For gauges, which can increase or decrease, setting nulls to zero or the last known value might be more suitable. The choice depends on the specific metric and what the null value represents in your system.
