Supercharge your Kubernetes Monitoring.
With AI powered insights.
SigNoz Cloud gives you actionable insights across pods, nodes, namespaces, workloads, and the services running inside them. All unified across logs, traces, and metrics in a consolidated OTel-native architecture.

One click end-to-end observability from clusters to containers
As a pod restarts or error rate spikes, get the full picture; not three uncorrelated tabs. SigNoz aligns infrastructure metrics, distributed traces, log lines in a single backend. Go from node CPU to service trace to the exact log line in one click. No copy-pasting trace IDs or manually matching any timestamps.
Read More

Proactive Alerts and Resolution before your users get disrupted
Create alerts on any K8s signal - pod restart rate, node memory pressure, OOMKilled events, or service error rates, directly from your dashboard, alerts tab, or a query. Route to Slack, PagerDuty, Opsgenie, Teams, Incident.io. No extra configuration layer for maintenance windows or multi-severity rules.
Read MorePredictable Pricing as you scale
Most observability platforms force a trade-off between data you process and price you pay. SigNoz Cloud adds full visibility into every layer of your Kubernetes cluster, nodes, control plane, and workloads without the operational overhead or tradeoffs.
Read More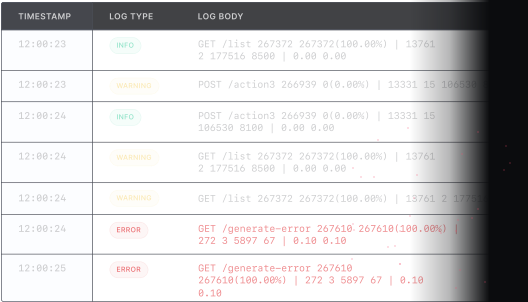

Dynamic resource scaling for cost optimization and performance
See actual CPU and memory usage against requests and limits across every workload. Identify over-provisioned deployments, pods running near OOM, and nodes with headroom to consolidate. CronJob monitoring shows run history, duration, and failure rates. GPU utilization tracked for AI and ML workloads alongside standard compute.
Read MoreAsk about your Kubernetes cluster in plain English, from where you work
SigNoz connects to Claude Code, Cursor, and other coding agents via MCP. Noz AI agent gets full cluster context with pod status, node metrics, trace data, service topology and debug production Kubernetes issues without leaving your terminal - all in one session. No separate AI SRE tool.
Read More
Get started in mins. OpenTelemetry-native. Your instrumentation stays yours.
SigNoz is built on OpenTelemetry from day one not just compatible with it. Deploy the OTel Collector via Helm, instrument your services with any OTel SDK, and your telemetry flows in. No proprietary agents, no DaemonSet sprawl, no re-instrumentation if you ever want to switch backends. Your instrumentation is a company asset, not a vendor dependency.
Read MoreAuto-discovers new services. No config update needed.
Kubernetes workloads are ephemeral as pods come and go, deployments scale, and new services ship daily. SigNoz via the OTel Collector auto-discovers new services as they appear and starts collecting telemetry immediately. Metadata enrichment on ingest means every signal is tagged with namespace, cluster, pod, and workload - so filters just work, for services that didn't exist last week.
Read More

Advanced Anomaly Detection before they surprise you
Not every incident announces itself. Anomaly detection in SigNoz surfaces outliers in response times, error rates, and resource usage that threshold-based alerts miss because you didn't know what threshold to set. Detect problematic services, unusual traffic patterns, and pod behavior that deviates from seasonal baselines automatically.
Read More

