OpenTelemetry Node.js - Getting Started with Tracing, Logs, and Metrics
Node.js applications are asynchronous by nature (event loop, callbacks, promises) plus DB drivers and external API calls means a single user request can hop across multiple execution contexts, which makes pinpointing latency or errors by logs alone frustrating and slow.
OpenTelemetry (OTel) solves that pain by standardizing how you collect traces, metrics, and logs in a vendor-neutral way. OTel’s SDKs can auto-instrument common frameworks like Express, Fastify, and NestJS, while also letting you add custom spans and metrics around business logic and when paired with the correct observability tool it scales from a quick local setup to a production observability pipeline.
This guide takes you from a basic "zero-code" setup to a “production ready” setup.
Readers who prefer a guided walkthrough can follow the step-by-step Node.js tutorial series.
What is OpenTelemetry ?
OpenTelemetry is an open-source framework that provides a single set of APIs, libraries, and agents to collect distributed traces, metrics, and logs from your application.
In the context of Node.js:
- Traces show you the lifecycle of a request as it flows through your nodejs routes, middleware, and database queries.
- Metrics provide aggregated data, such as request rates, error percentages, and CPU usage.
- Logs are correlated with traces, allowing you to see exactly what the application logged during a specific slow request.
OpenTelemetry provide developers three different ways to instrument their application:
- Zero Code (Automatic Instrumentation): Requires no code changes, developers needs to install auto instrumentation libraries.
- Code-based (Automatic Instrumentation + Libraries): Requires minimal code change along with installation of Auto-Instrumentation libraries.
- Libraries (Manual Instrumentation): Requires extensive code change, but developers get more control on what to instrument as per business requirement.
Prerequisites
- Node.js 18.19+ (or 20.6+). If you use ESM preloading via
--import, use Node v20+. Download the latest version of Node.js here. - A destination for your telemetry data (we will use SigNoz Cloud for the examples, but the concepts apply to any OTLP-compliant backend).
Quick Start
To avoid manual setup, clone the sample Node.js app repository, which is contains a sample node.js app. You can refer to README.md for setup.
Architecture of Sample Node.js application:
- Creates a simple server using
express. - Defines two routes:
/data: Responds with a JSON payload./addCount: Responds with a JSON message.
- Defines one function:
fetchData(): Return the data recevied by calling the API’s
- The server listens on port
5555or an environment-specified port.
Once your node.js application setup is completed, proceed with next step.
How to Instrument Node.js Application with OpenTelemetry ?
As discussed earlier, there are three ways to instrument your application with OpenTelemetry. We will be focusing only on two of them which are Automatic Instrumentation & Manual Instrumentation.
How to Auto Instrument Node.js application ?
You should use this instrumentation when :
- You want to quickly get your application instrumented and start exporting telemetry with no code changes.
- You don’t have any specific business requirement for custom instrumentation for traces, metrics or logs.
Step 1: Install OpenTelemetry Packages
To enable telemetry data collection for your application, you need to install the necessary OpenTelemetry packages. Use the following commands:
npm install --save @opentelemetry/api
npm install --save @opentelemetry/auto-instrumentations-node
These libraries enable automatic instrumentation and interaction with the OpenTelemetry API.
Step 2: Configure Environment Variables
To configure OpenTelemetry for your application, export the necessary environment variables. These variables define the data export settings and identify your application in SigNoz.
Run the below in your terminal:
export OTEL_TRACES_EXPORTER="otlp"
export OTEL_EXPORTER_OTLP_TRACES_ENDPOINT="https://ingest.<Region>.signoz.cloud:443/v1/traces"
export OTEL_NODE_RESOURCE_DETECTORS="env,host,os"
export OTEL_SERVICE_NAME="<APP_NAME>"
export OTEL_EXPORTER_OTLP_HEADERS="signoz-ingestion-key=<SIGNOZ_INGESTION_KEY>"
export NODE_OPTIONS="--require @opentelemetry/auto-instrumentations-node/register"
Here is a breakdown of the environment variables used:
| Variable | Description |
|---|---|
OTEL_TRACES_EXPORTER | Specifies the traces exporter. Set to "otlp" to use the OpenTelemetry Protocol (OTLP) for exporting trace data. |
OTEL_EXPORTER_OTLP_TRACES_ENDPOINT | The SigNoz ingestion URL. You should have received this URL via email after registering with SigNoz Cloud. |
OTEL_NODE_RESOURCE_DETECTORS | Identifies additional resource metadata such as environment, host, and OS for better trace context. |
OTEL_SERVICE_NAME | The name of your application. This will appear in SigNoz as the service being monitored. |
OTEL_EXPORTER_OTLP_HEADERS | Contains authentication headers, including your SigNoz ingestion key. |
NODE_OPTIONS | Configures the Node.js runtime to preload OpenTelemetry's auto-instrumentation library. |
Be sure to replace <SIGNOZ_INGESTION_KEY> with your actual SigNoz ingestion key. If you haven't created one yet, you can follow Ingestion Key Guide to generate your access key.
Step 3: Start the Application
After setting the environment variables, start your application by running:
node index.js
You can check your application running at:
You need to generate some load in order to see data reported on SigNoz dashboard. Refresh the endpoints for 10-20 times, and wait for 2-3 mins.
Step 4: Visualize and Monitor in SigNoz Dashboard
Once your application is running and has generated some load, you can begin monitoring it in your SigNoz Cloud account. Navigate to the Services tab, you should see your application listed.
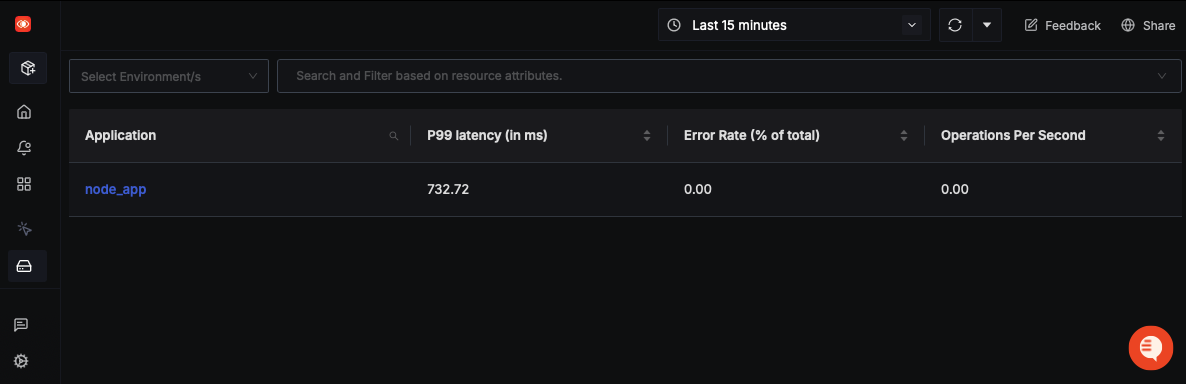
SigNoz makes it easy to visualize metrics and traces captured through OpenTelemetry instrumentation. It comes with out-of-box RED metrics charts and visualization. RED metrics stand for:
- Rate of requests
- Error rate of requests
- Duration taken by requests
Click on your application in the Services tab to be redirected to the Metrics page, where you can explore these metrics in detail.
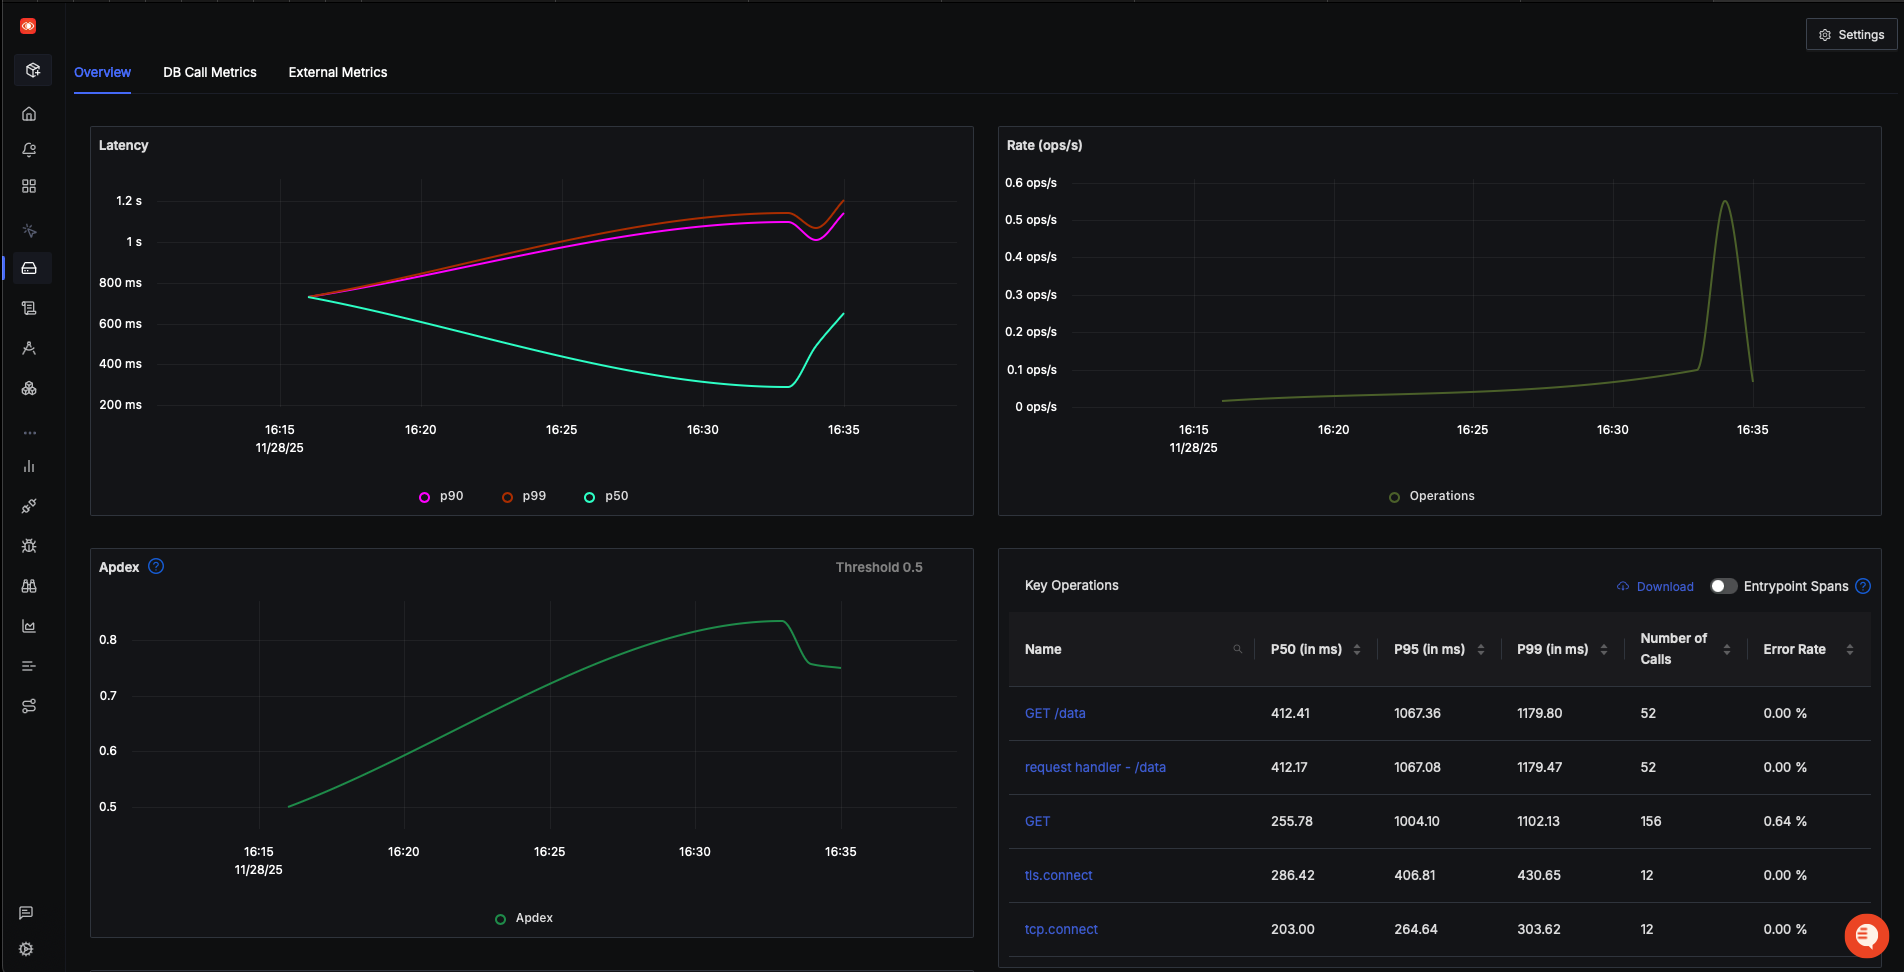
Measure things like application latency, requests per sec, error percentage and see your top endpoints
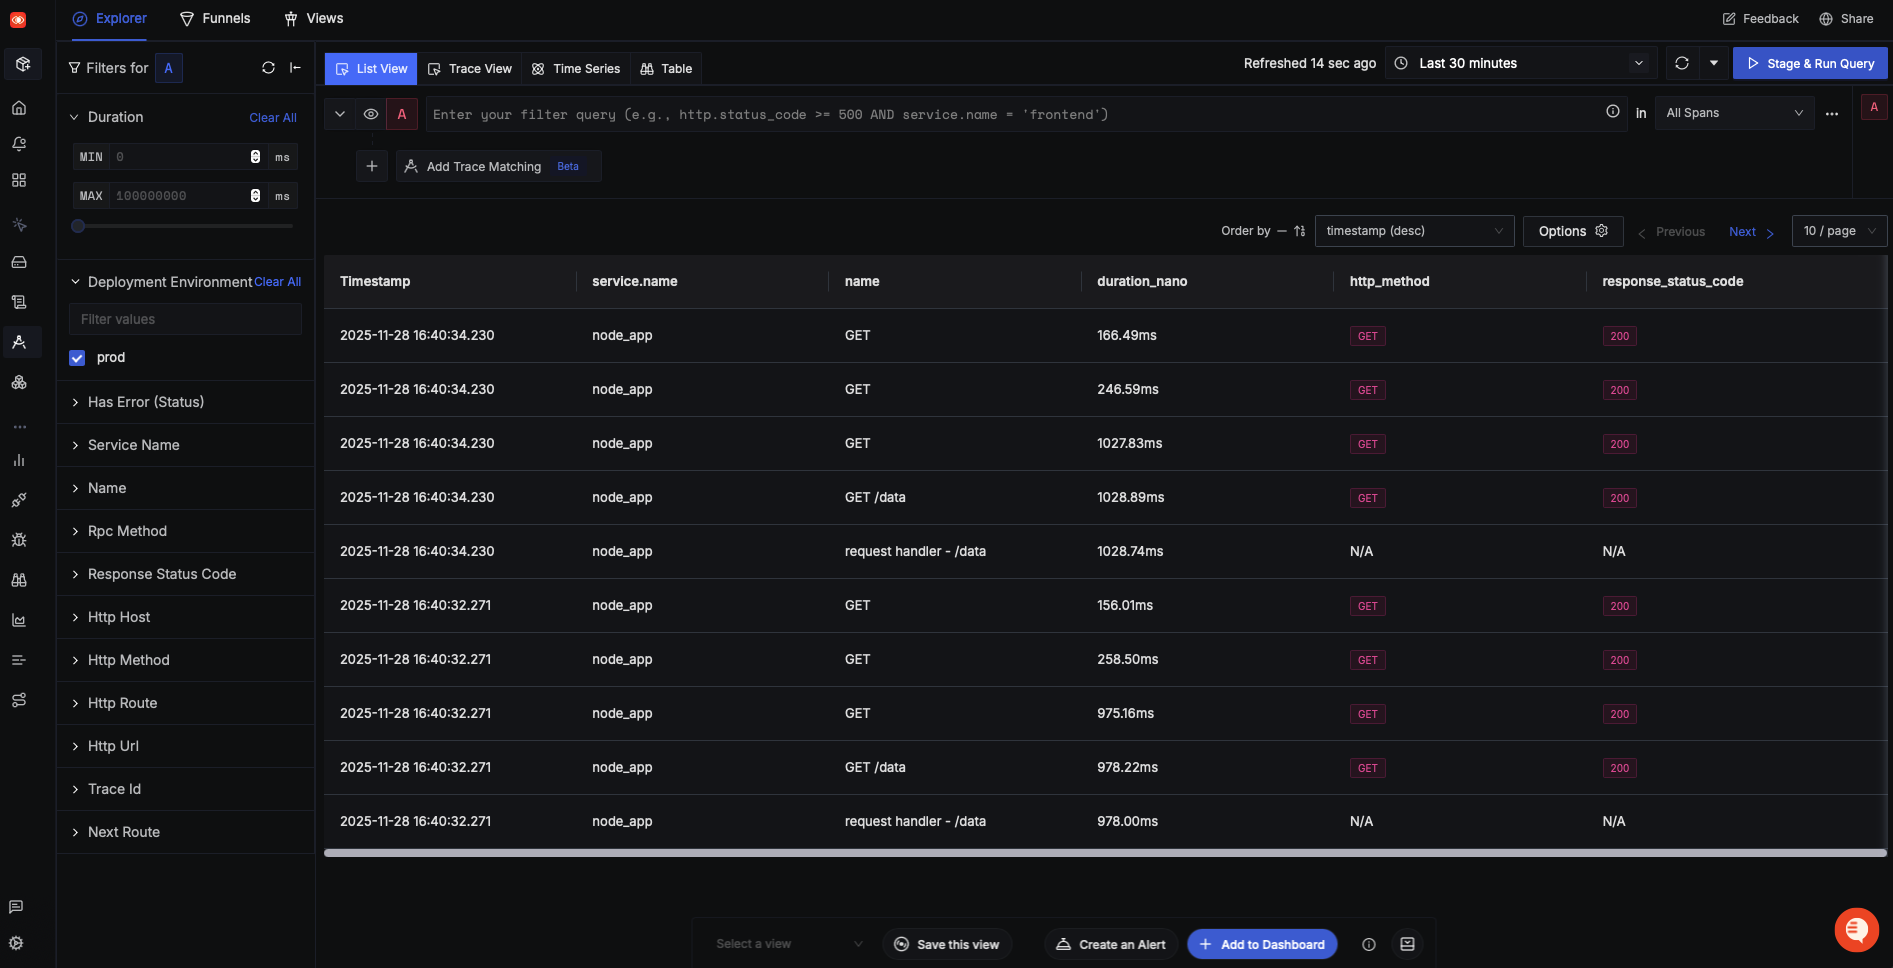
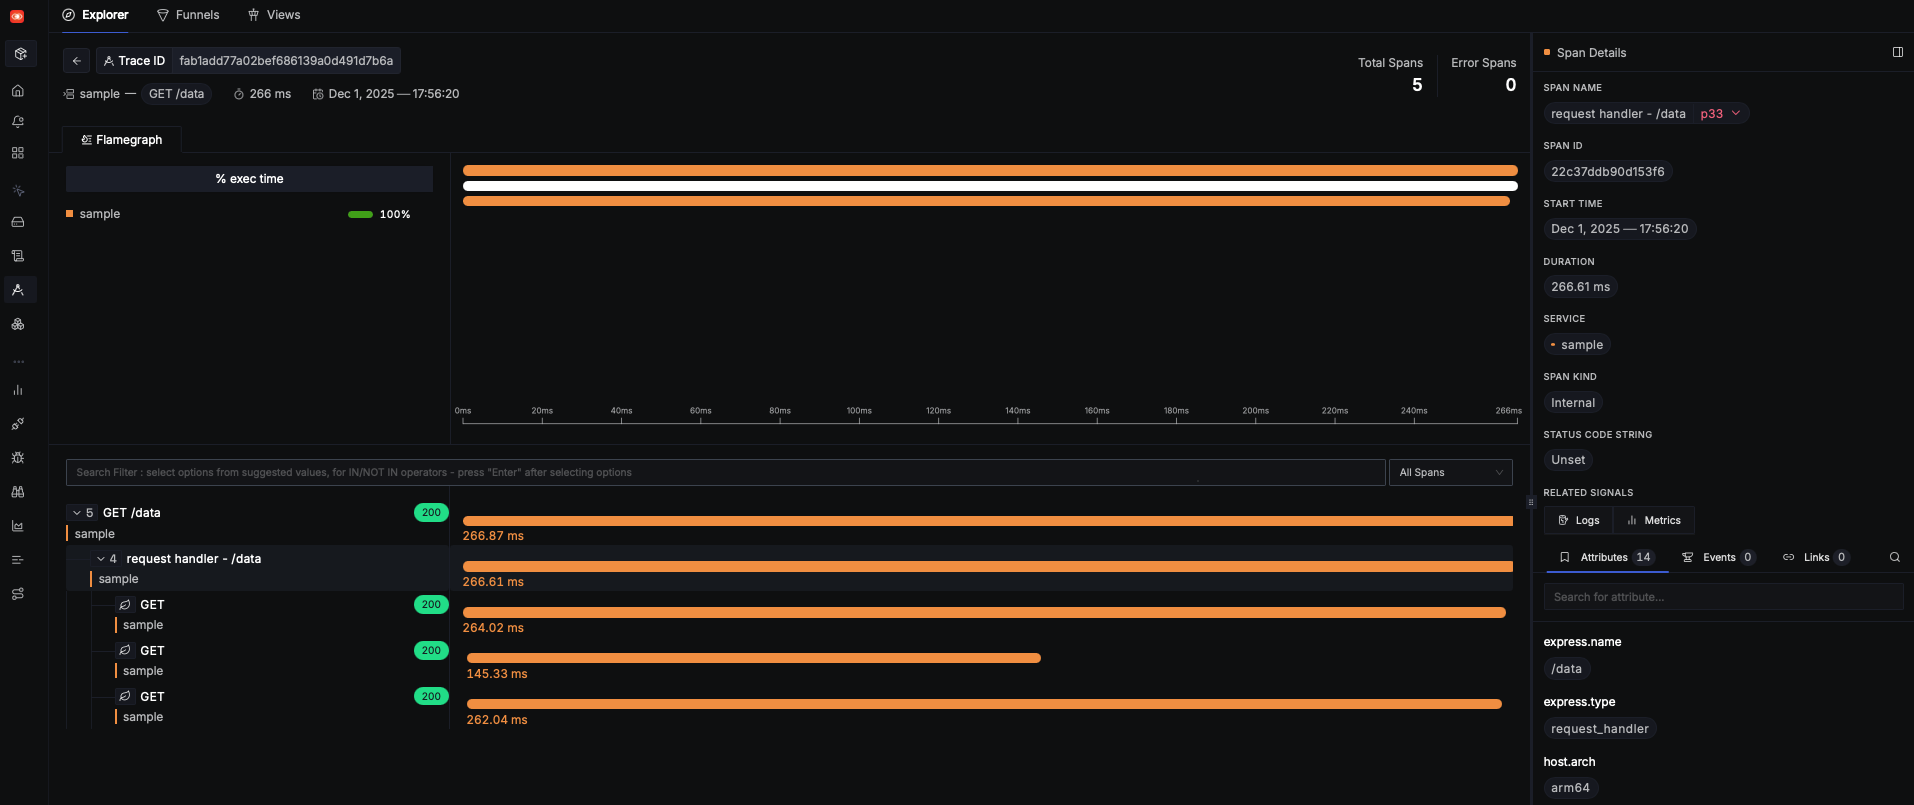
For more detailed analysis, navigate to the Traces tab. Here, you choose a particular timestamp where latency is high to drill down to traces around that timestamp to investigate the root cause. To better understand how to interpret these traces and identify performance bottlenecks, refer to the extended documentation page.
SigNoz provides flamegraphs, which are an invaluable tool for visualizing the exact duration taken by each span in a trace. Flamegraphs allow you to pinpoint which parts of your application are contributing to high latency.
Congratulations !! You have successfully auto instrumented your first NodeJS application with OpenTelemetry and SigNoz.
How to Manually Instrument your Nodejs application ?
You should use Manual Instrumentation when:
- You need custom business logic for tracing
- You need more context in your spans
- You are Instrumenting Custom Modules or Non-Standard Libraries
- You Need High-Value Metrics
- Distributed Tracing Across Microservices
Step 1: Install OpenTelemetry packages
To manually enable telemetry data collection for your application, you need to install the necessary OpenTelemetry packages. Use the following command to install:
npm i --save @opentelemetry/api
npm i --save @opentelemetry/exporter-metrics-otlp-http
npm i --save @opentelemetry/exporter-trace-otlp-http
npm i --save @opentelemetry/resources
npm i --save @opentelemetry/sdk-node
npm i --save @opentelemetry/sdk-metrics
npm i --save @opentelemetry/semantic-conventions
Step 2: Create a instrumentation.mjs file
This file is responsible for initializing and starting OpenTelemetry in your application. Without it, your app won’t generate & export any traces or metrics to the opentelemetry backend (in our case “SigNoz Cloud”).
import { NodeSDK } from '@opentelemetry/sdk-node'
import { PeriodicExportingMetricReader } from '@opentelemetry/sdk-metrics'
import { resourceFromAttributes } from '@opentelemetry/resources'
import { ATTR_SERVICE_NAME, ATTR_SERVICE_VERSION } from '@opentelemetry/semantic-conventions'
import { OTLPTraceExporter } from '@opentelemetry/exporter-trace-otlp-http'
import { OTLPMetricExporter } from '@opentelemetry/exporter-metrics-otlp-http'

// Initialize OpenTelemetry SDK with service metadata
const sdk = new NodeSDK({
  resource: resourceFromAttributes({
    [ATTR_SERVICE_NAME]: 'node-app', // service name
    [ATTR_SERVICE_VERSION]: '0.1.0', // service version
  }),

  // Export traces via OTLP/HTTP
  traceExporter: new OTLPTraceExporter({
    // url: "http://localhost:4318/v1/traces",
    url: 'https://ingest.{REGION}.signoz.cloud:443/v1/traces',
    headers: {
      'signoz-ingestion-key': '<SIGNOZ_INGESTION_KEY>',
    },
  }),

  // Export metrics on a periodic schedule
  metricReader: new PeriodicExportingMetricReader({
    exporter: new OTLPMetricExporter({
      url: 'https://ingest.{REGION}.signoz.cloud:443/v1/metrics',
      headers: {
        'signoz-ingestion-key': '<SIGNOZ_INGESTION_KEY>',
      },
    }),
    // Export metrics every 10 seconds
    exportIntervalMillis: 10000,
  }),
})

// Start telemetry collection
sdk.start()
Code breakdown
-
Import OpenTelemetry components
You bring in the Node.js SDK, OTLP exporters for traces and metrics, resource helpers, and semantic attribute constants.
-
Define the service’s identity
resource: resourceFromAttributes({
  [ATTR_SERVICE_NAME]: 'dice-server',
  [ATTR_SERVICE_VERSION]: '0.1.0',
})
This sets the name and version of your service so traces/metrics can be grouped correctly.
-
Configure trace & metrics exporting
traceExporter: new OTLPTraceExporter({ url: "https://ingest.{REGION}.signoz.cloud:443/v1/traces", headers: { "signoz-ingestion-key": "<SIGNOZ_INGESTION_KEY>", }, }), metricReader: new PeriodicExportingMetricReader({ exporter: new OTLPMetricExporter({ url: "https://ingest.{REGION}.signoz.cloud:443/v1/metrics", headers: { "signoz-ingestion-key": "<SIGNOZ_INGESTION_KEY>", }, }), exportIntervalMillis: 10000, }),Traceswill be exported to SigNoz Cloud.Metricsare exported periodically using the OTLP HTTP protocol to the SigNoz Cloud.
-
Create and start the NodeSDK
sdk.start()Initializes instrumentation, begins collecting traces and metrics, and starts sending them to the configured endpoints.
Step 3: Add custom Span & Metric Counters in index.js file
Your index.js file should look like below after adding custom Spans and Metrics .
const express = require('express')
const axios = require('axios')
const { trace, metrics } = require('@opentelemetry/api')

// Tracer for creating spans
const tracer = trace.getTracer('node-app', '0.1.0')

// Meter for creating counters
const meter = metrics.getMeter('node-app', '0.1.0')
const dataCounter = meter.createCounter('data.fetchData.counter')
const randomCounter = meter.createCounter('addCount.counter')

const app = express()
const PORT = process.env.PORT || 5555

async function fetchData() {
  return tracer.startActiveSpan('fetchDataFunction', async (span) => {
    // Span event: request start
    span.addEvent('Fetch request started')

    try {
      const [catFact, dogFact, randomJoke] = await Promise.all([
        axios.get('https://catfact.ninja/fact'),
        axios.get('https://dog.ceo/api/breeds/image/random'),
        axios.get('https://official-joke-api.appspot.com/jokes/random'),
      ])

      // Span event: request success
      span.addEvent('Fetch request succeeded')

      return {
        catFact: catFact.data.fact,
        dogImage: dogFact.data.message,
        joke: randomJoke.data.setup + ' - ' + randomJoke.data.punchline,
      }
    } catch (error) {
      // Span event: request failure
      span.addEvent('Fetch request failed', { error: error.message })
      return { error: 'Failed to fetch data from APIs' }
    } finally {
      span.end() // Close span
    }
  })
}

app.get('/data', async (req, res) => {
  dataCounter.add(1) // Metric count increment
  const data = await fetchData()
  res.json(data)
})

app.get('/addCount', async (req, res) => {
  randomCounter.add(1) // Metric count increment
  res.status(200).json({
    method: req.method,
    message: 'Increased count by 1.',
    ...req.body,
  })
})

app.listen(PORT, () => {
  console.log(`
Server running on http://localhost:${PORT}

curl http://localhost:${PORT}/data
curl http://localhost:${PORT}/addCount
`)
})
Code breakdown
-
Import and initialize OpenTelemetry APIs
const { trace, metrics } = require('@opentelemetry/api')You load the tracing and metrics API provided by OpenTelemetry.
-
Create a Tracer and Meter + Counters
const tracer = trace.getTracer('node-app', '0.1.0')

const meter = metrics.getMeter('node-app', '0.1.0')
const dataCounter = meter.createCounter('data.fetchData.counter')
const randomCounter = meter.createCounter('addCount.counter')
A tracer lets you create spans, units of work you want to measure and track (e.g., API calls, functions).
A meter is used to generate metrics (e.g., Counters).
Counters track how many times something happens:
dataCounterincrements each time/datais requestedrandomCounterincrements each time/addCountis requested
-
Start a new active span on
fetchData()This span measures how long the function takes and captures important events.
tracer.startActiveSpan('fetchDataFunction', async (span) => { // Function logic }) -
Add span events
Events represent moments in time inside a span. They show something happened at a specific point.
span.addEvent('Fetch request started') span.addEvent('Fetch request succeeded') span.addEvent('Fetch request failed', { error: error.message }) -
End the span
Close the tracing operation before your value is return.
span.end()
Step 4: Start the Application
-
Start your application by running below command in new terminal:
node --import ./instrumentation.mjs index.js -
You can check your application running at:
You need to generate some load in order to see data reported on SigNoz dashboard. Refresh the endpoints for 10-20 times, and wait for 2-3 mins.
Step 5: Monitor in SigNoz Dashboard
Once your application is running and has generated some load, you can begin monitoring it in your SigNoz Cloud account. Navigate to the Services tab, you should see your application listed.
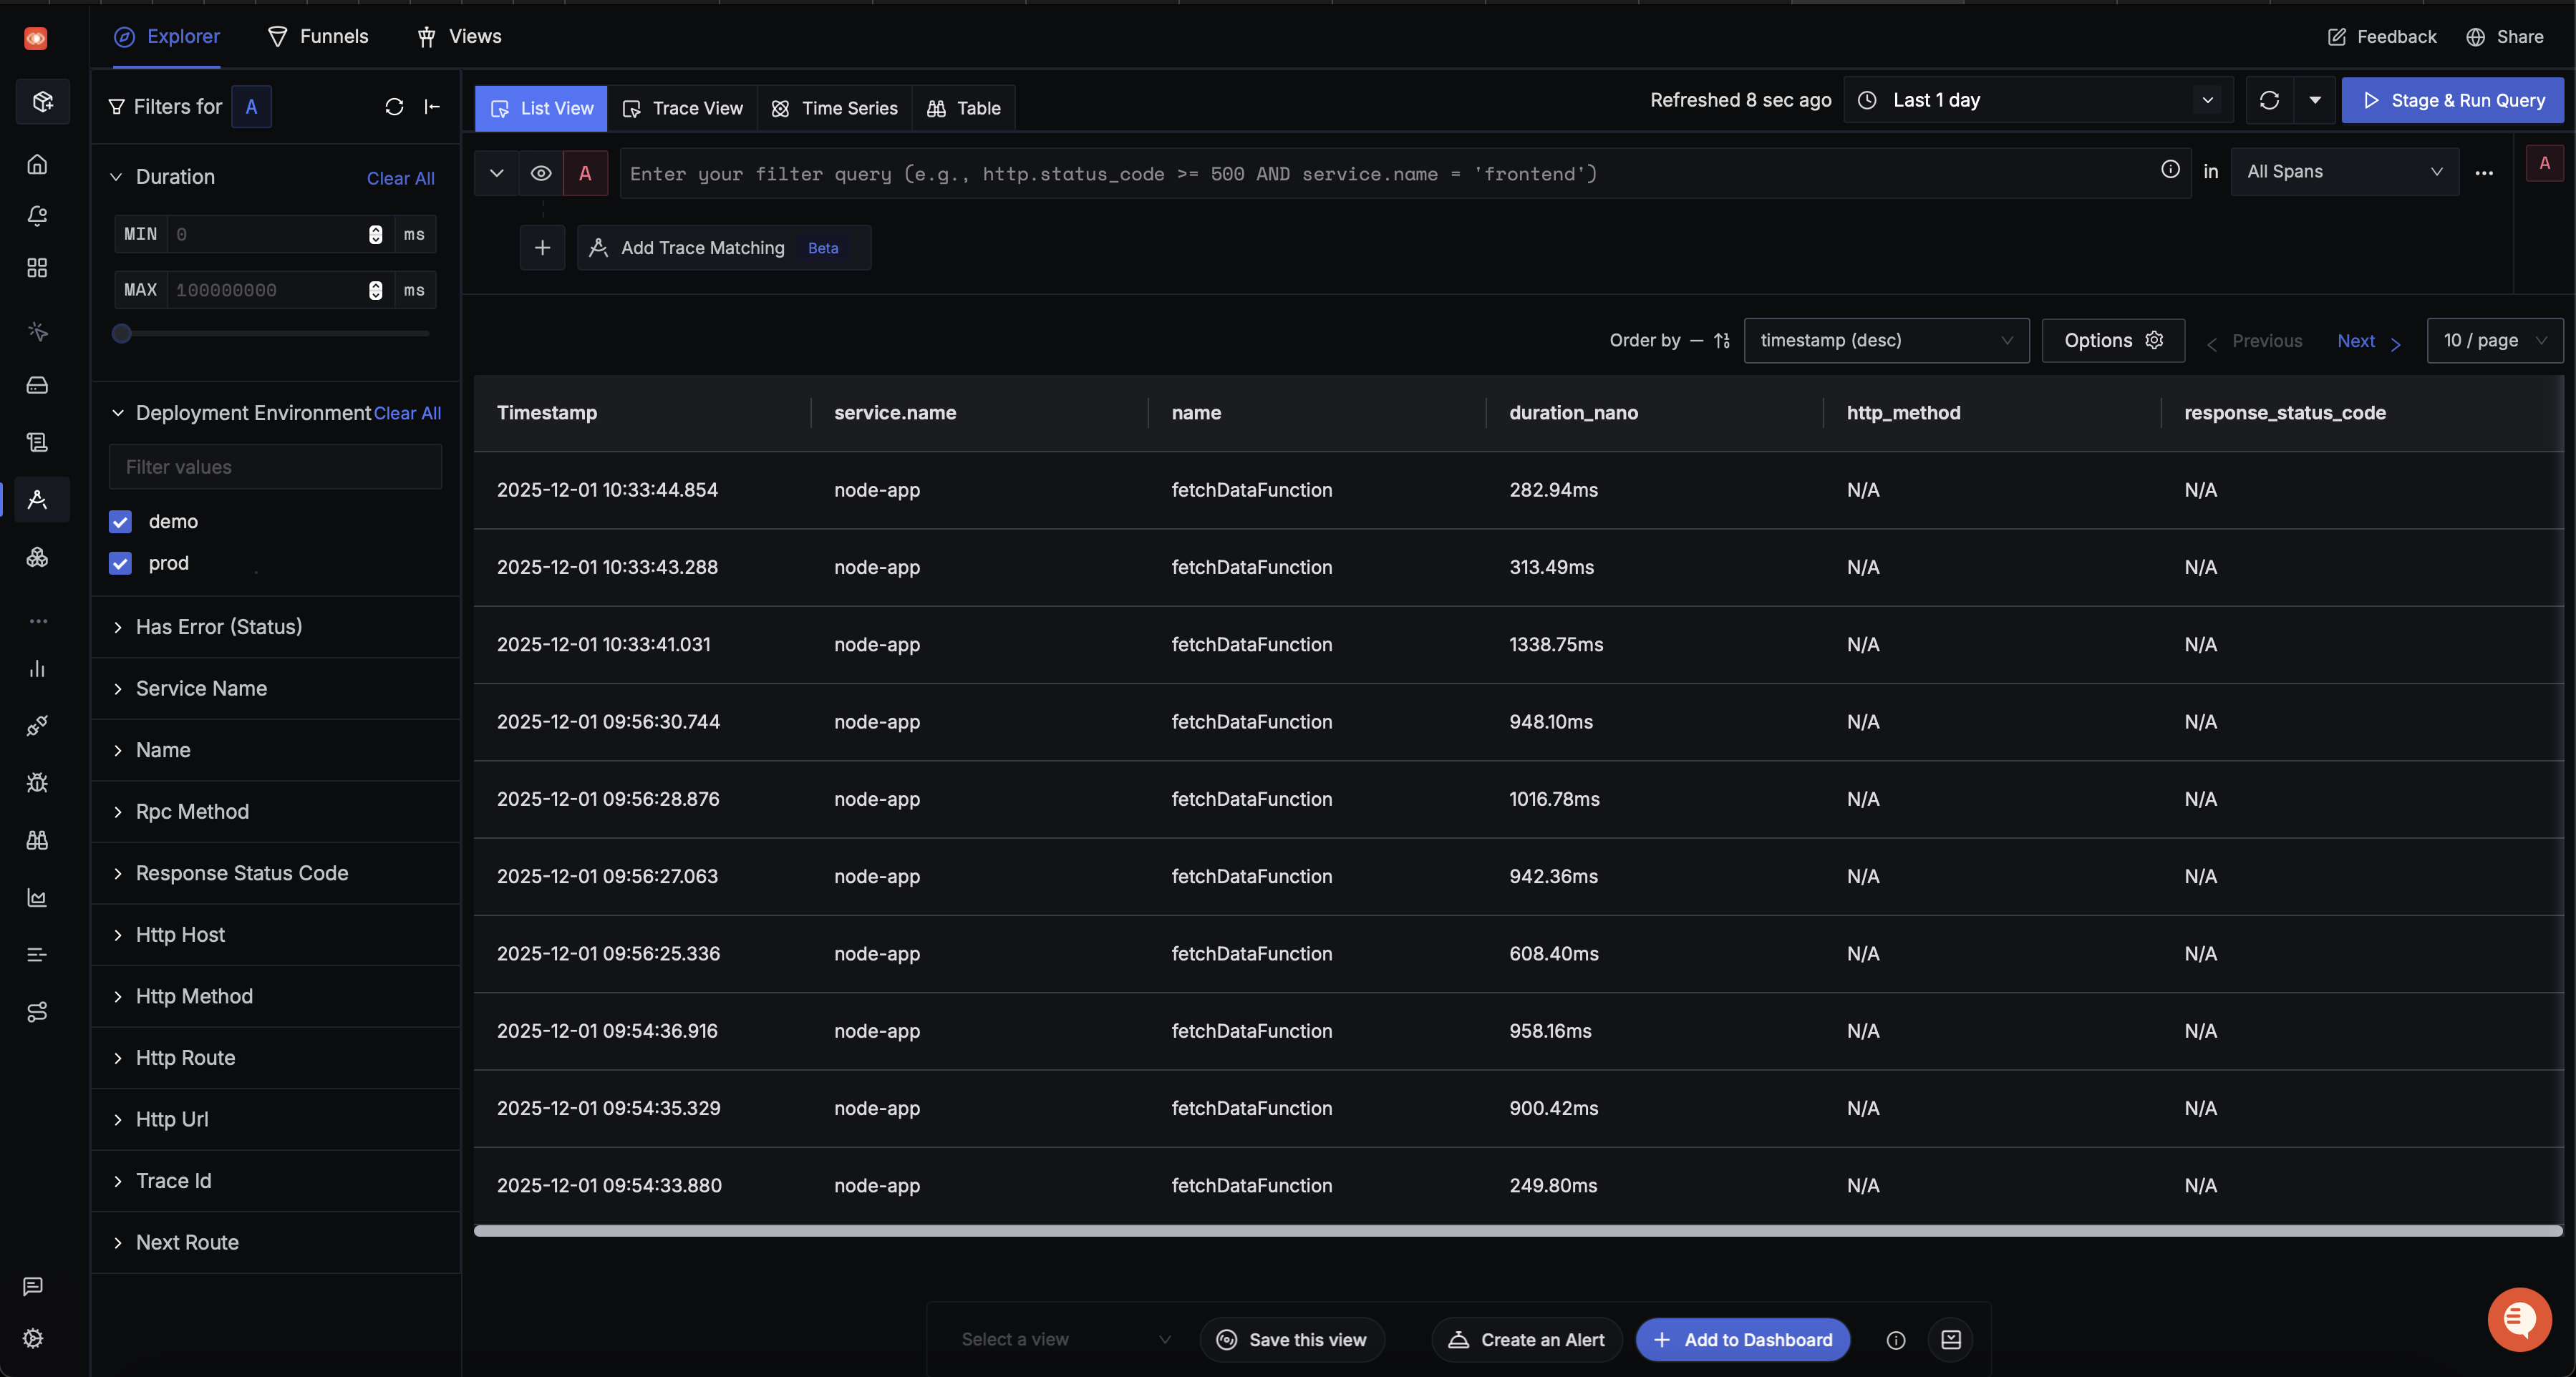
To check the added custom spans, navigate to the Traces tab. Here we can see your custom added span named fetchDataFunction .
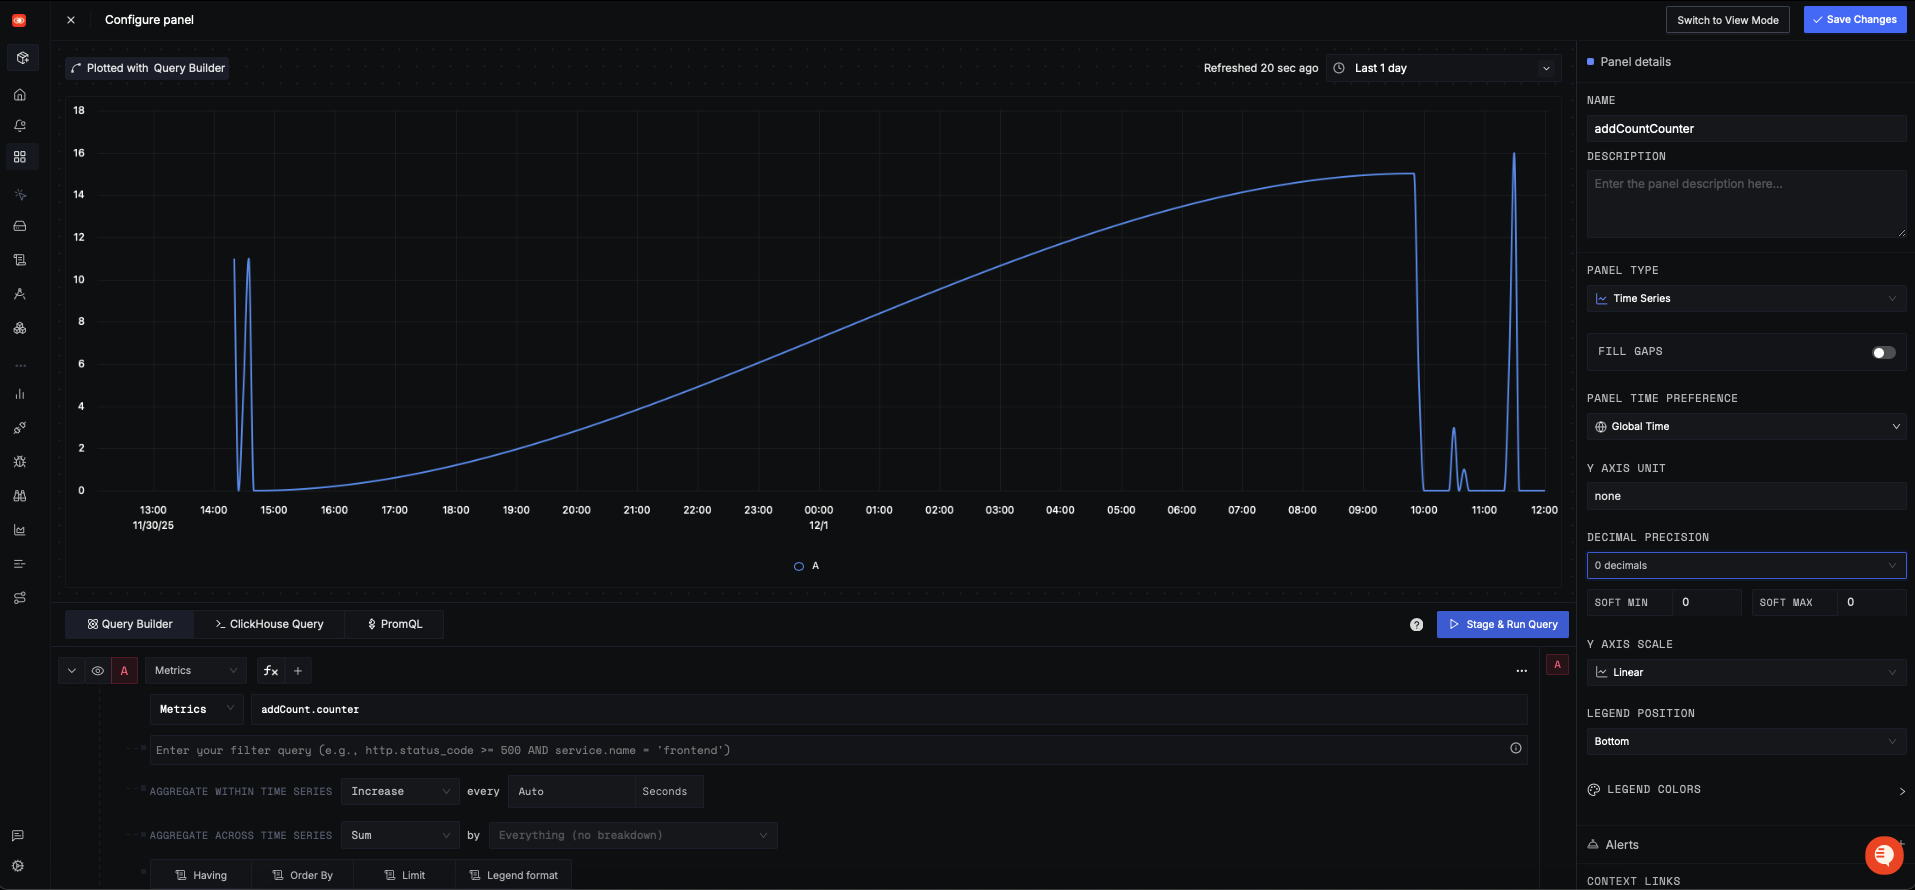
We had added counter metrics whose count will increase every time the API is called. You can add panel and view them in Dashboard. To better understand how to add these metrics panel in Dashboard, refer to the extended documentation page.
Congratulations !! You have manually instrumented your first Node.js application with OpenTelemetry and SigNoz.
Logging in NodeJs
Native logging in Node.js is quite minimal, which is why structured logging libraries like Winston and Pino are widely adopted in real-world projects.
If you want to Instrument your logs and forward them to SigNoz, please follow below guides:
Correlating Logs with Traces
Once your logs are flowing in, the next step is making them truly useful by tying them back to the requests they belong to. This is where trace-log correlation comes in. By embedding trace IDs into your log entries, you can jump from a slow or failing span directly to the logs that were generated during that exact execution path. It turns scattered information into a connected story, making debugging far quicker and far less guess-heavy.
If you want a deeper walkthrough of how trace-log correlation works in practice, you can follow our detailed guide here: Correlating Traces, Logs, and Metrics - OpenTelemetry NodeJS.
Best Practices for Instrumenting Node.js with OpenTelemetry
As you start instrumenting more services or move your setup toward production, keeping a few best practices in mind can save you a lot of friction down the road. These aren’t hard rules, but they come from common pitfalls teams hit when rolling out OpenTelemetry in real Node.js environments.
- Name your services and spans clearly Use meaningful, stable names so traces are easy to search and understand.
- Capture only what you need Avoid overly broad manual instrumentation. Focus on key business logic and high-value operations.
- Use consistent resource attributes
Standard fields like
service.name,service.version, and environment tags help keep your data organized. - Enable trace–log correlation Include trace and span IDs in your logs to speed up debugging and reduce guesswork.
- Monitor metrics alongside traces Counters, latency metrics, and error rates provide quick signals before you even look at traces.
- Validate locally before deploying Run your app with debug logging enabled to ensure spans and metrics export correctly.
These small steps help keep your telemetry clean, actionable, and ready for production as your application grows.
Conclusion
OpenTelemetry makes it very convenient to instrument your Nodejs application. You can then use an open-source APM tool like SigNoz to analyze the performance of your app. As SigNoz offers a full-stack observability tool, you don't have to use multiple tools for your monitoring needs.
Get Started with SigNoz
You can choose between various deployment options in SigNoz. The easiest way to get started with SigNoz is SigNoz cloud. We offer a 30-day free trial account with access to all features.
Those who have data privacy concerns and can't send their data outside their infrastructure can sign up for either enterprise self-hosted or BYOC offering.
Those who have the expertise to manage SigNoz themselves or just want to start with a free self-hosted option can use our community edition.
Hope we answered all your questions regarding microservices monitoring. If you have more questions, feel free to use the SigNoz AI chatbot, or join our slack community.
You can also subscribe to our newsletter for insights from observability nerds at SigNoz, get open source, OpenTelemetry, and devtool building stories straight to your inbox.
