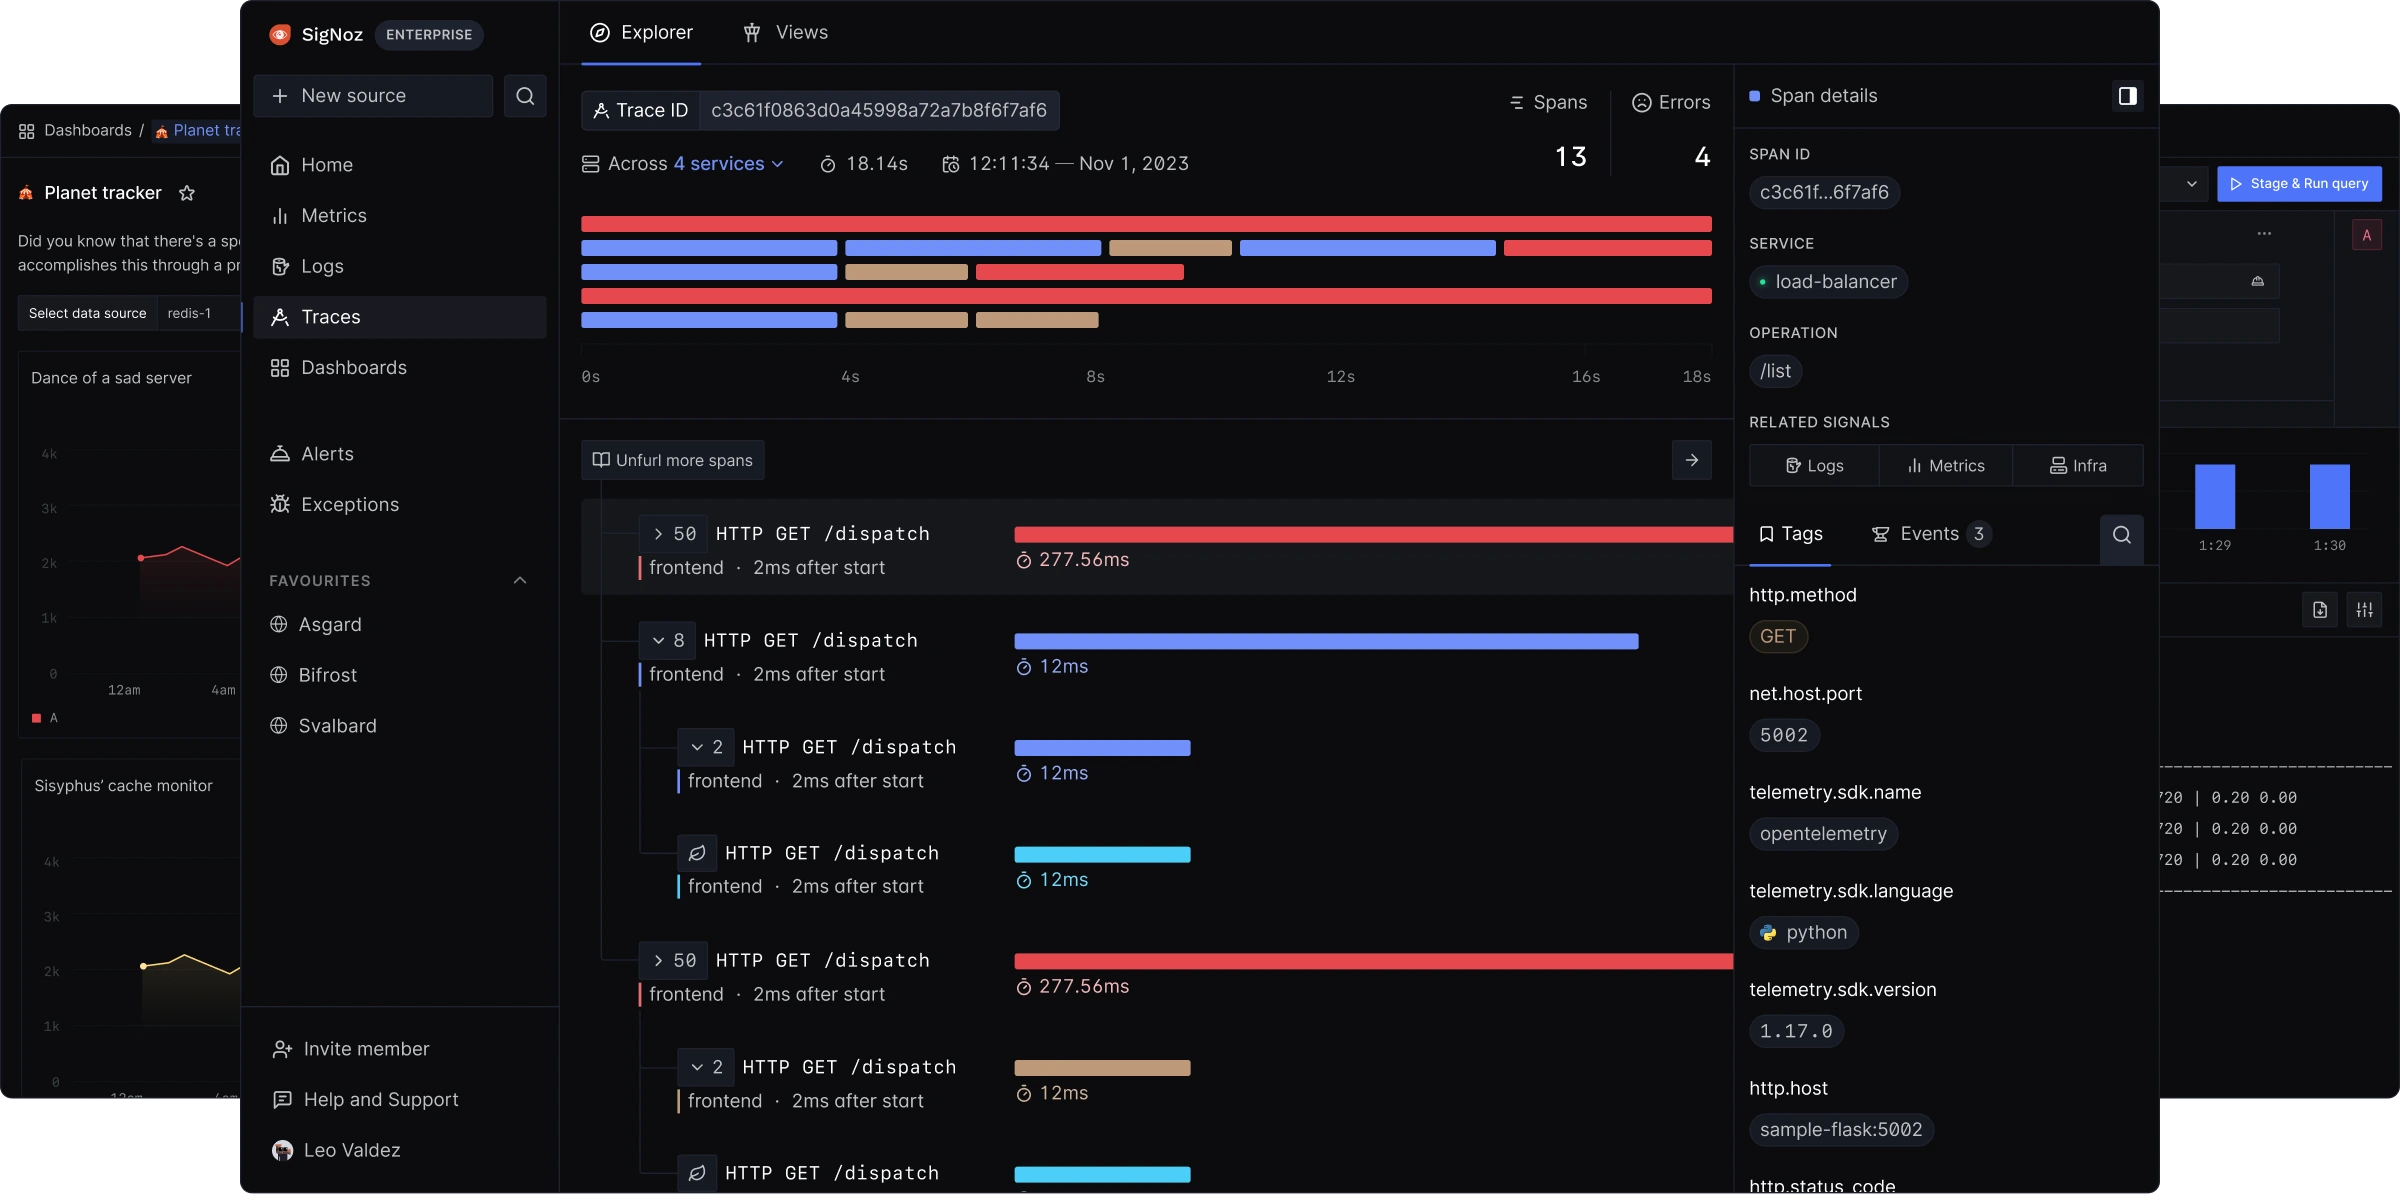
OpenTelemetry-Native Logs,
Metrics and Traces in a single pane
SigNoz is an open-source Datadog or New Relic alternative. Get APM, logs,
traces, metrics, exceptions, & alerts in a single tool.


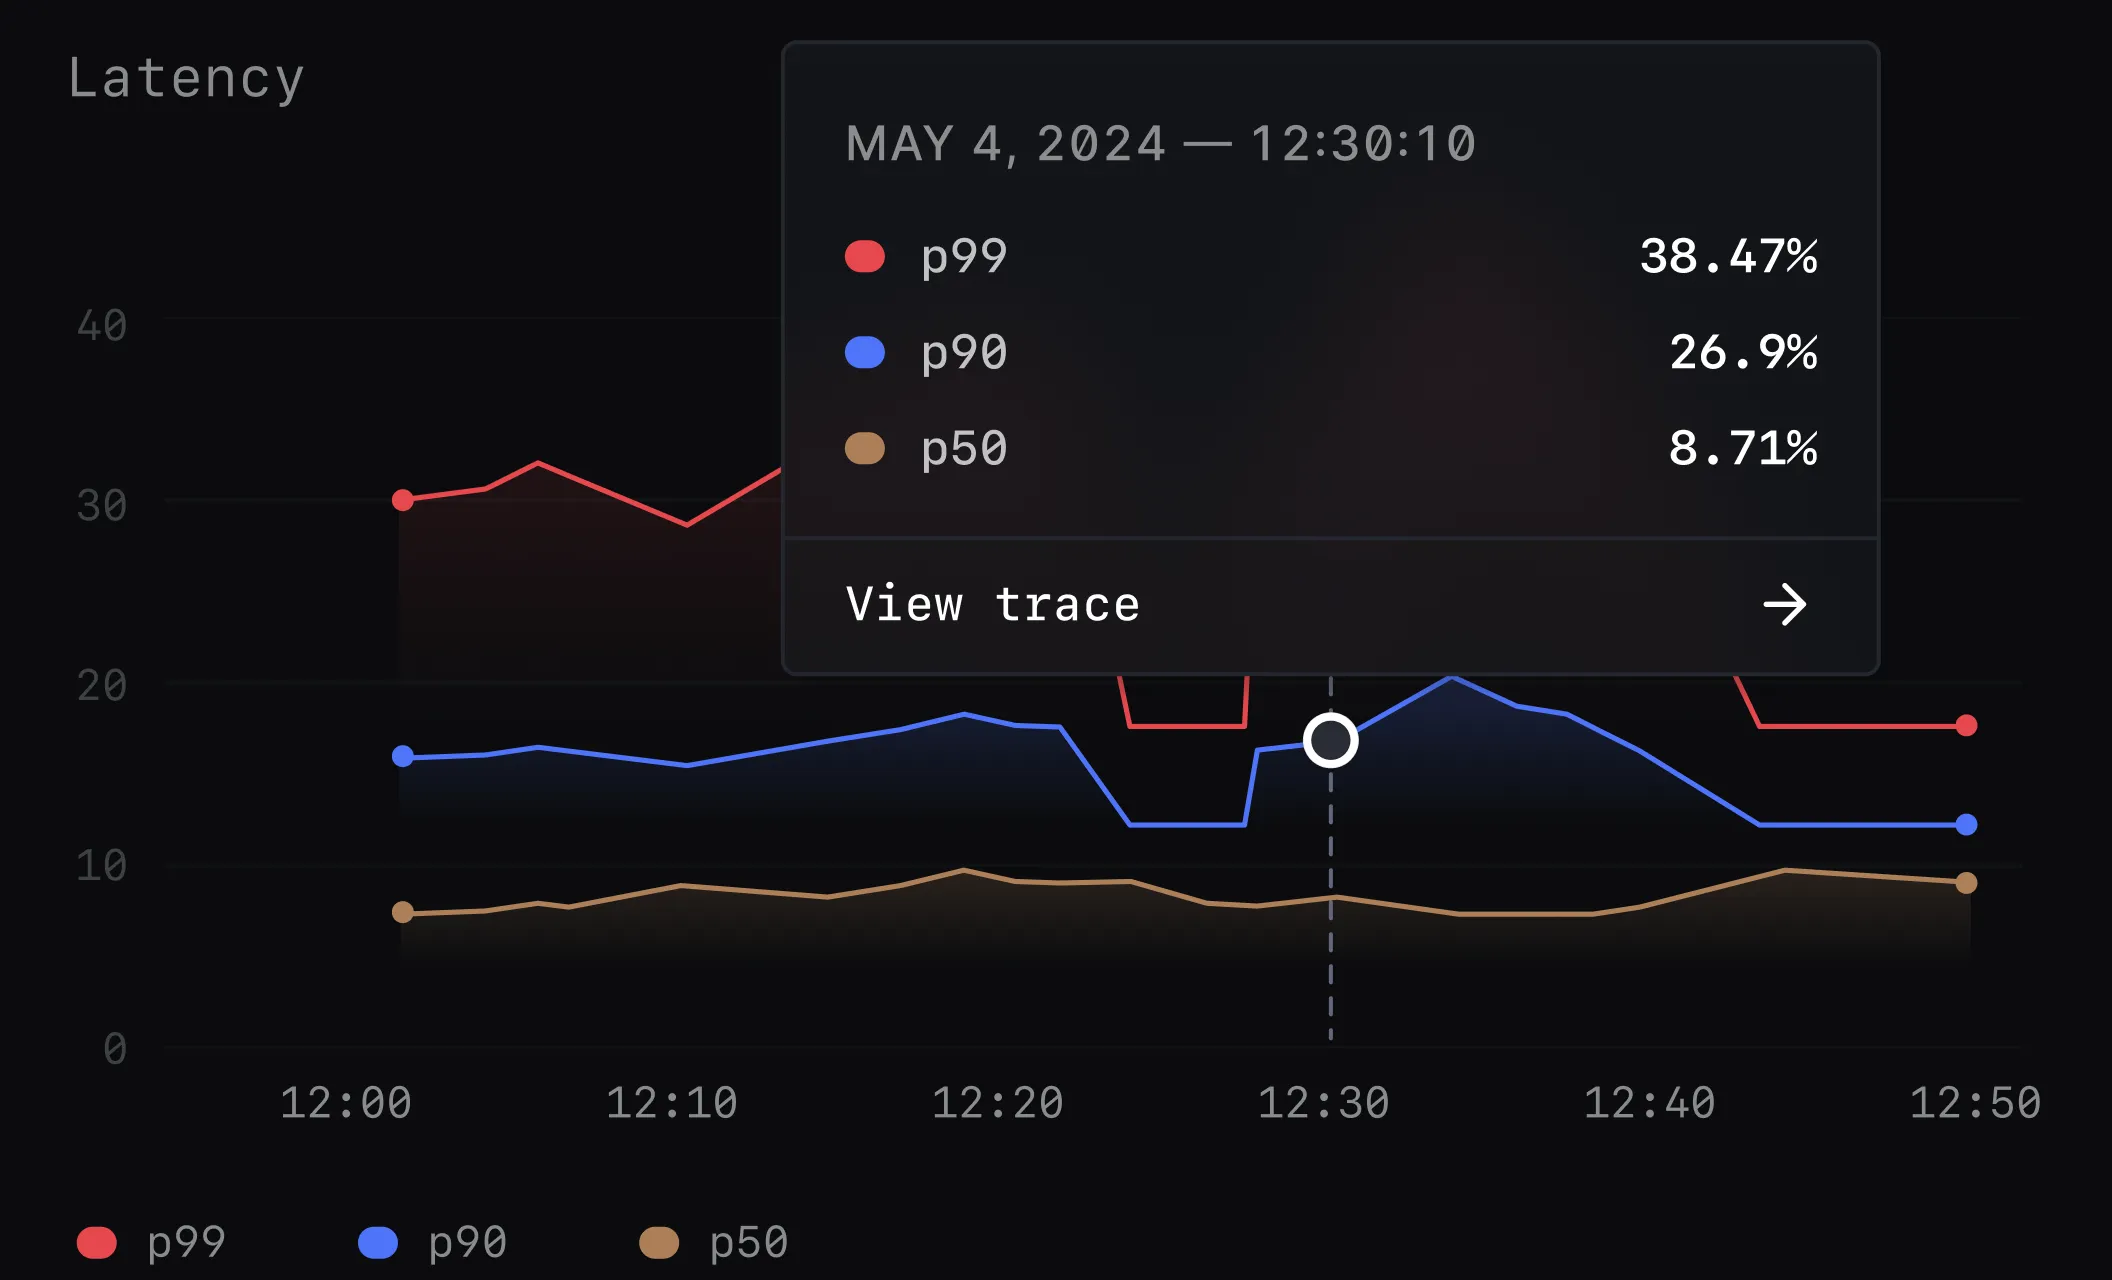
Metrics

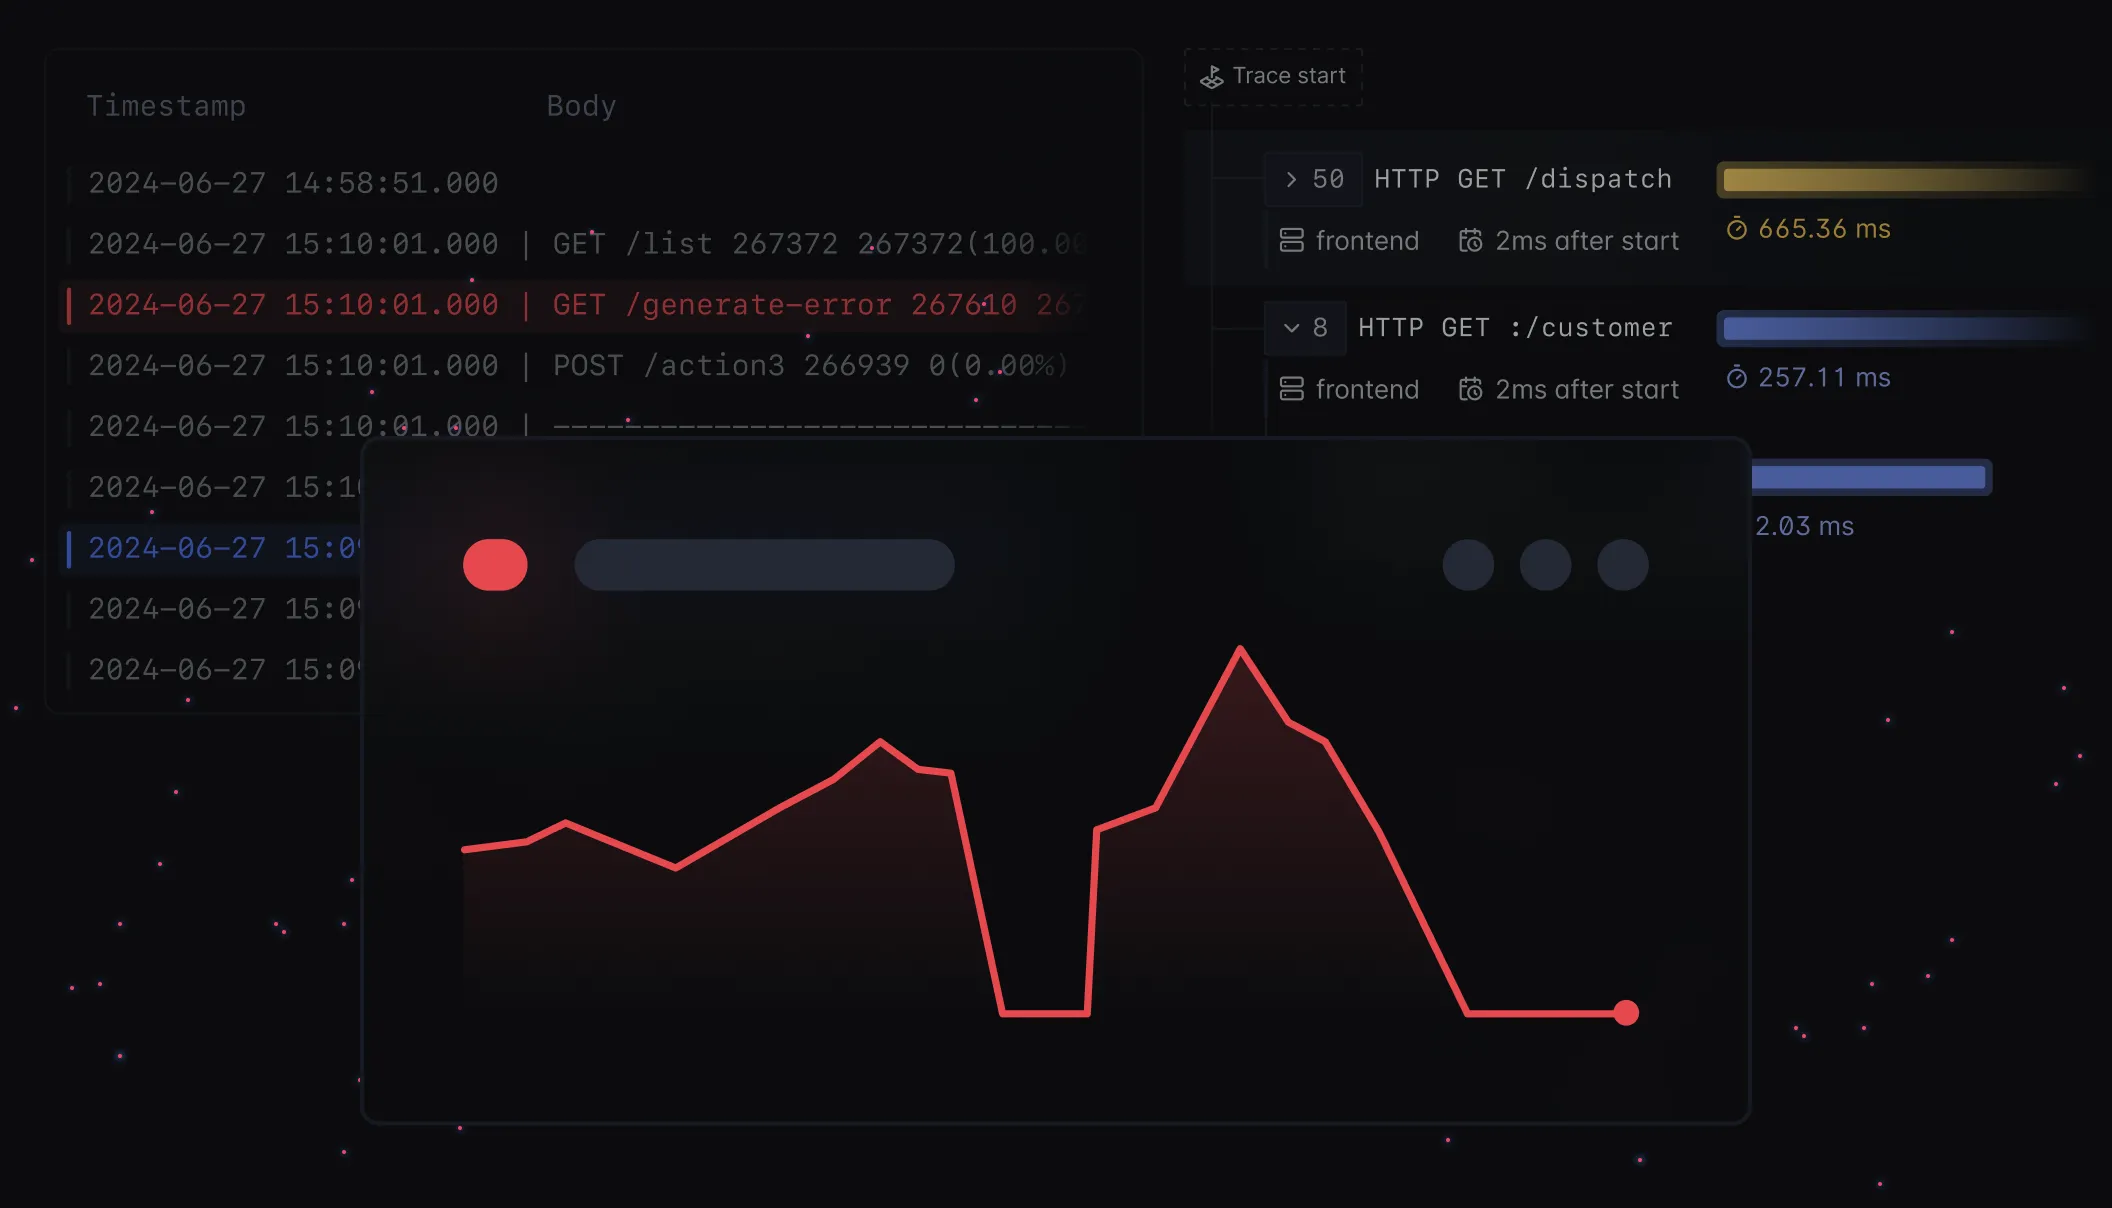
Traces

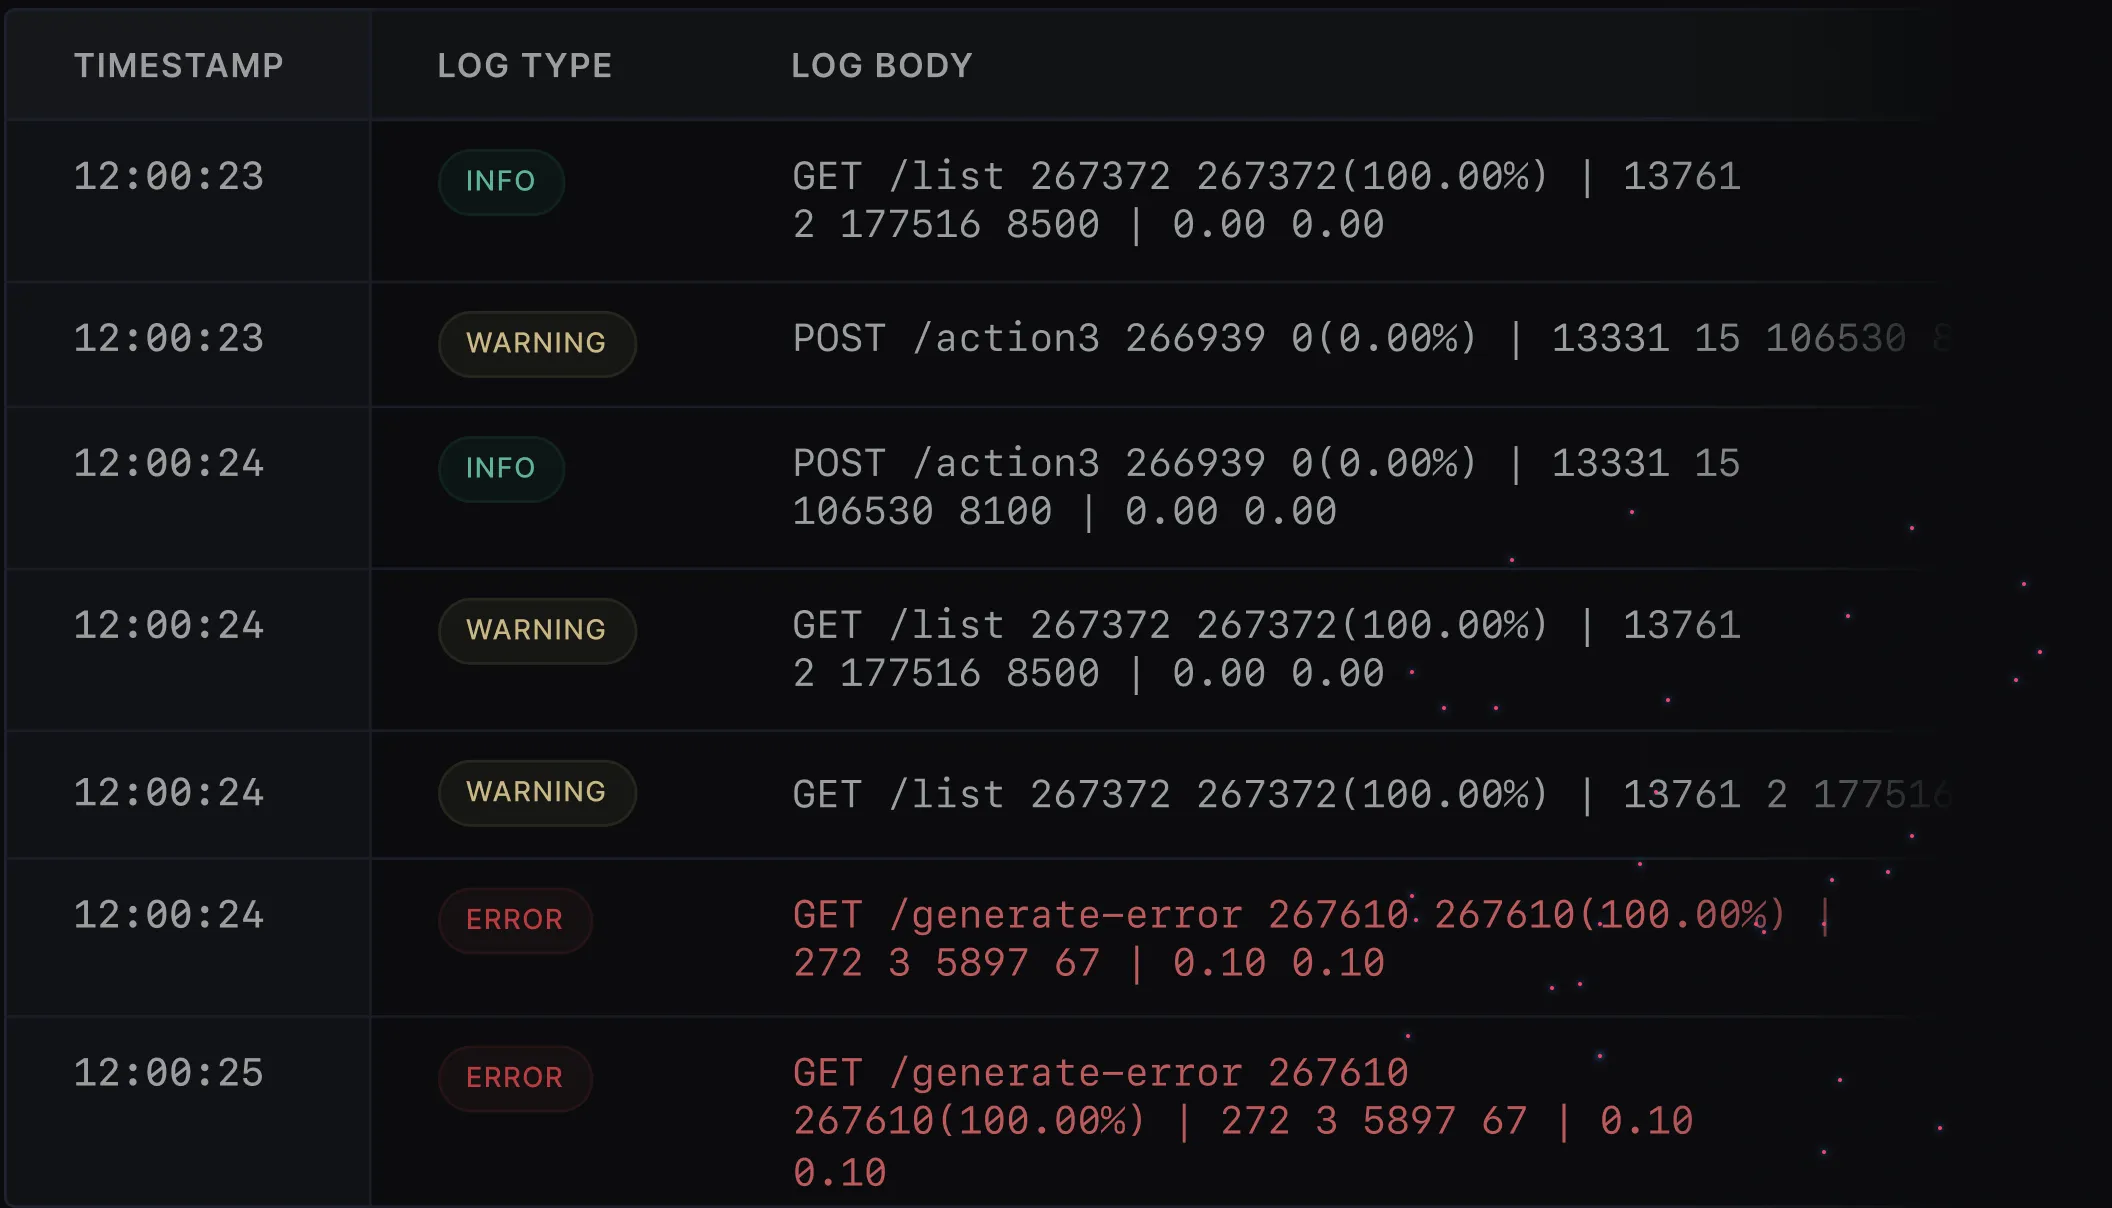
Logs

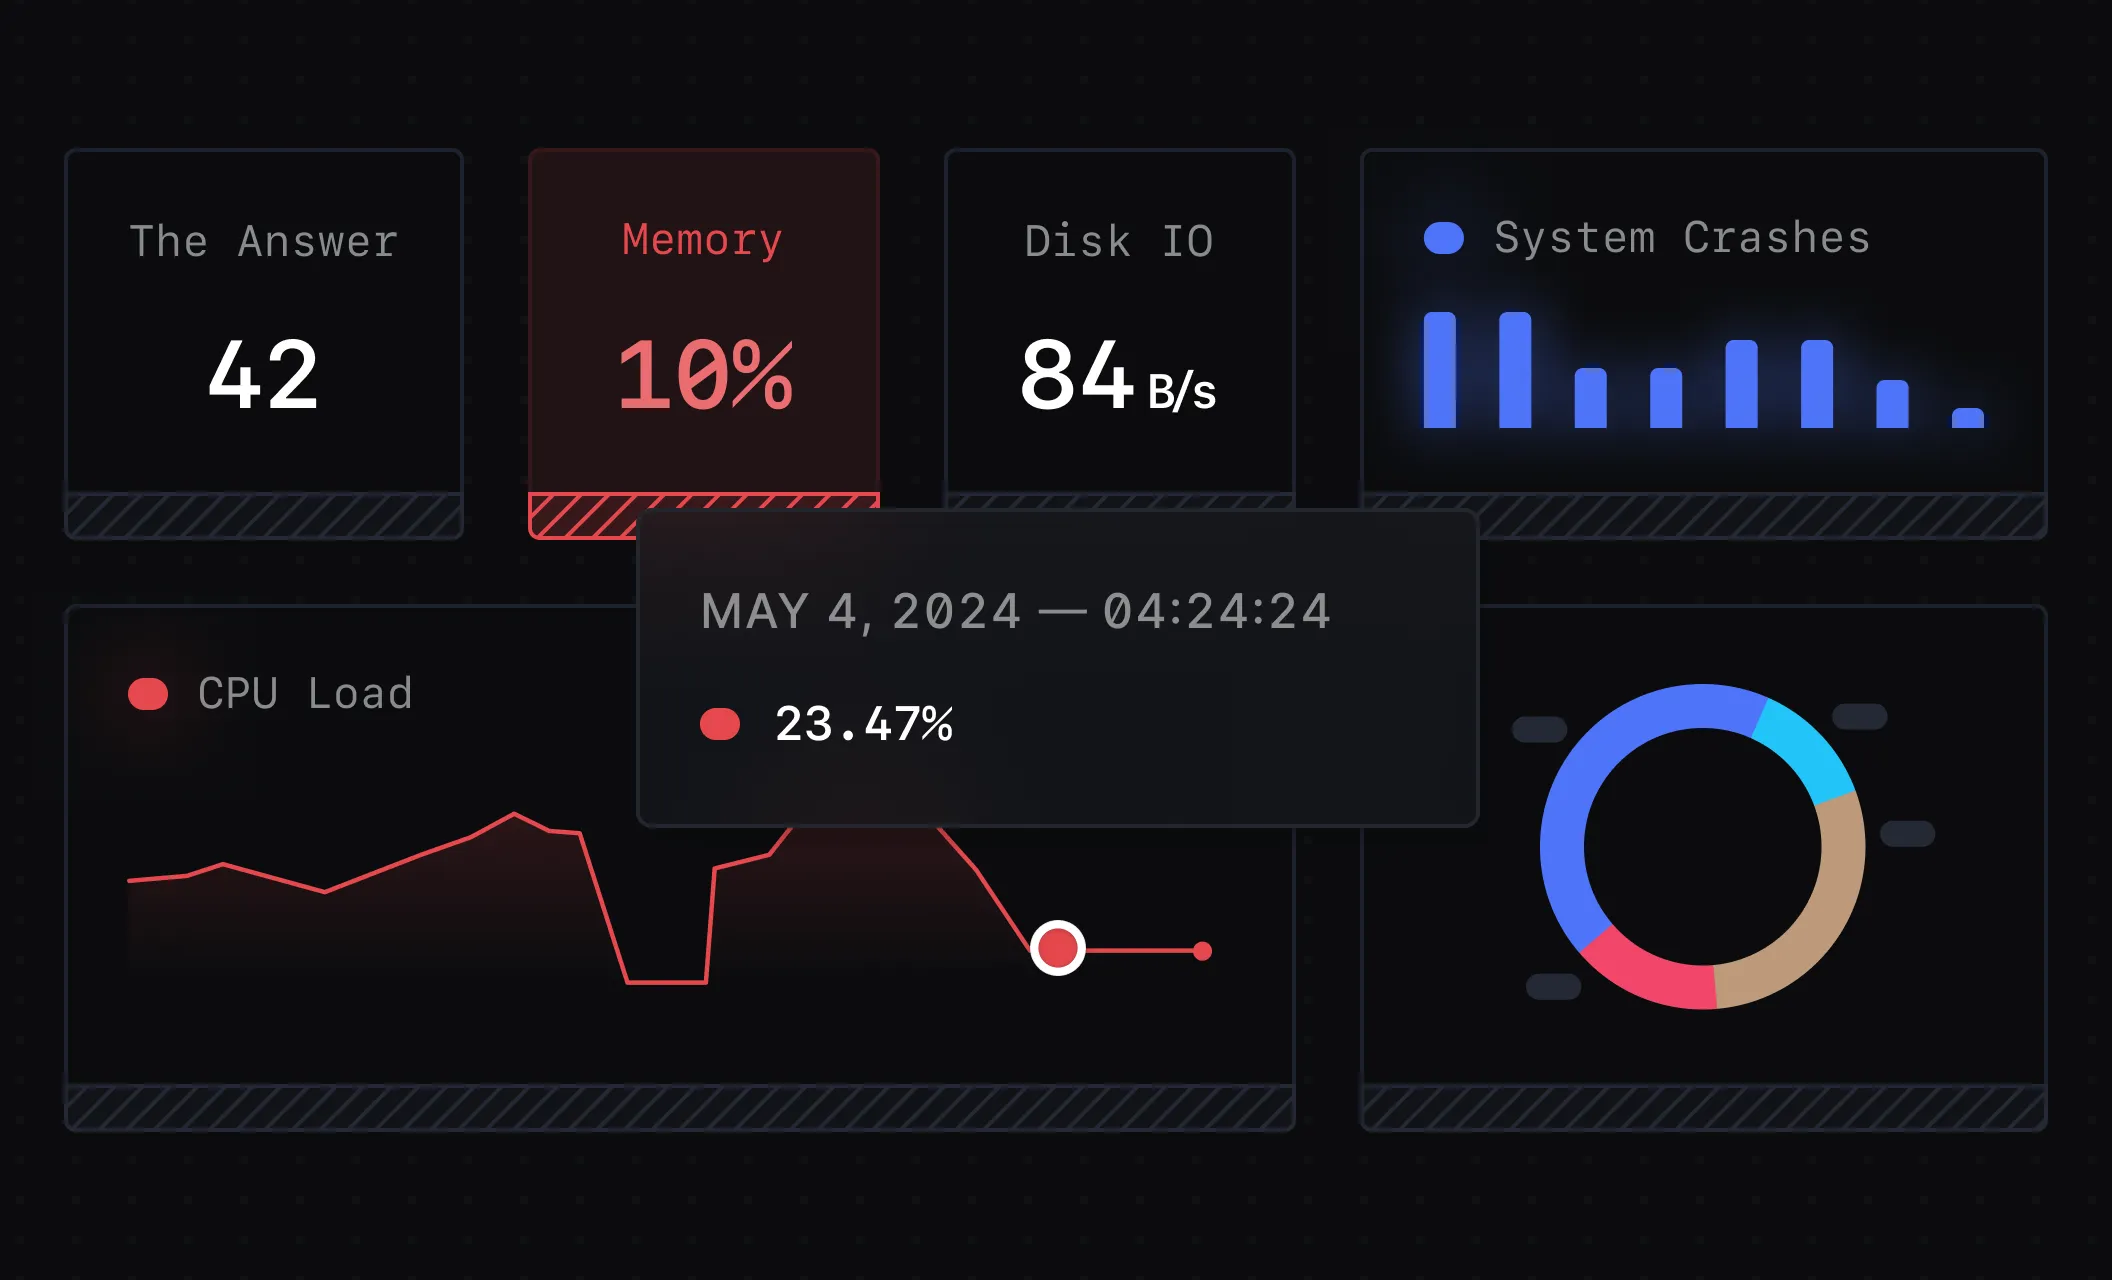
Dashboards

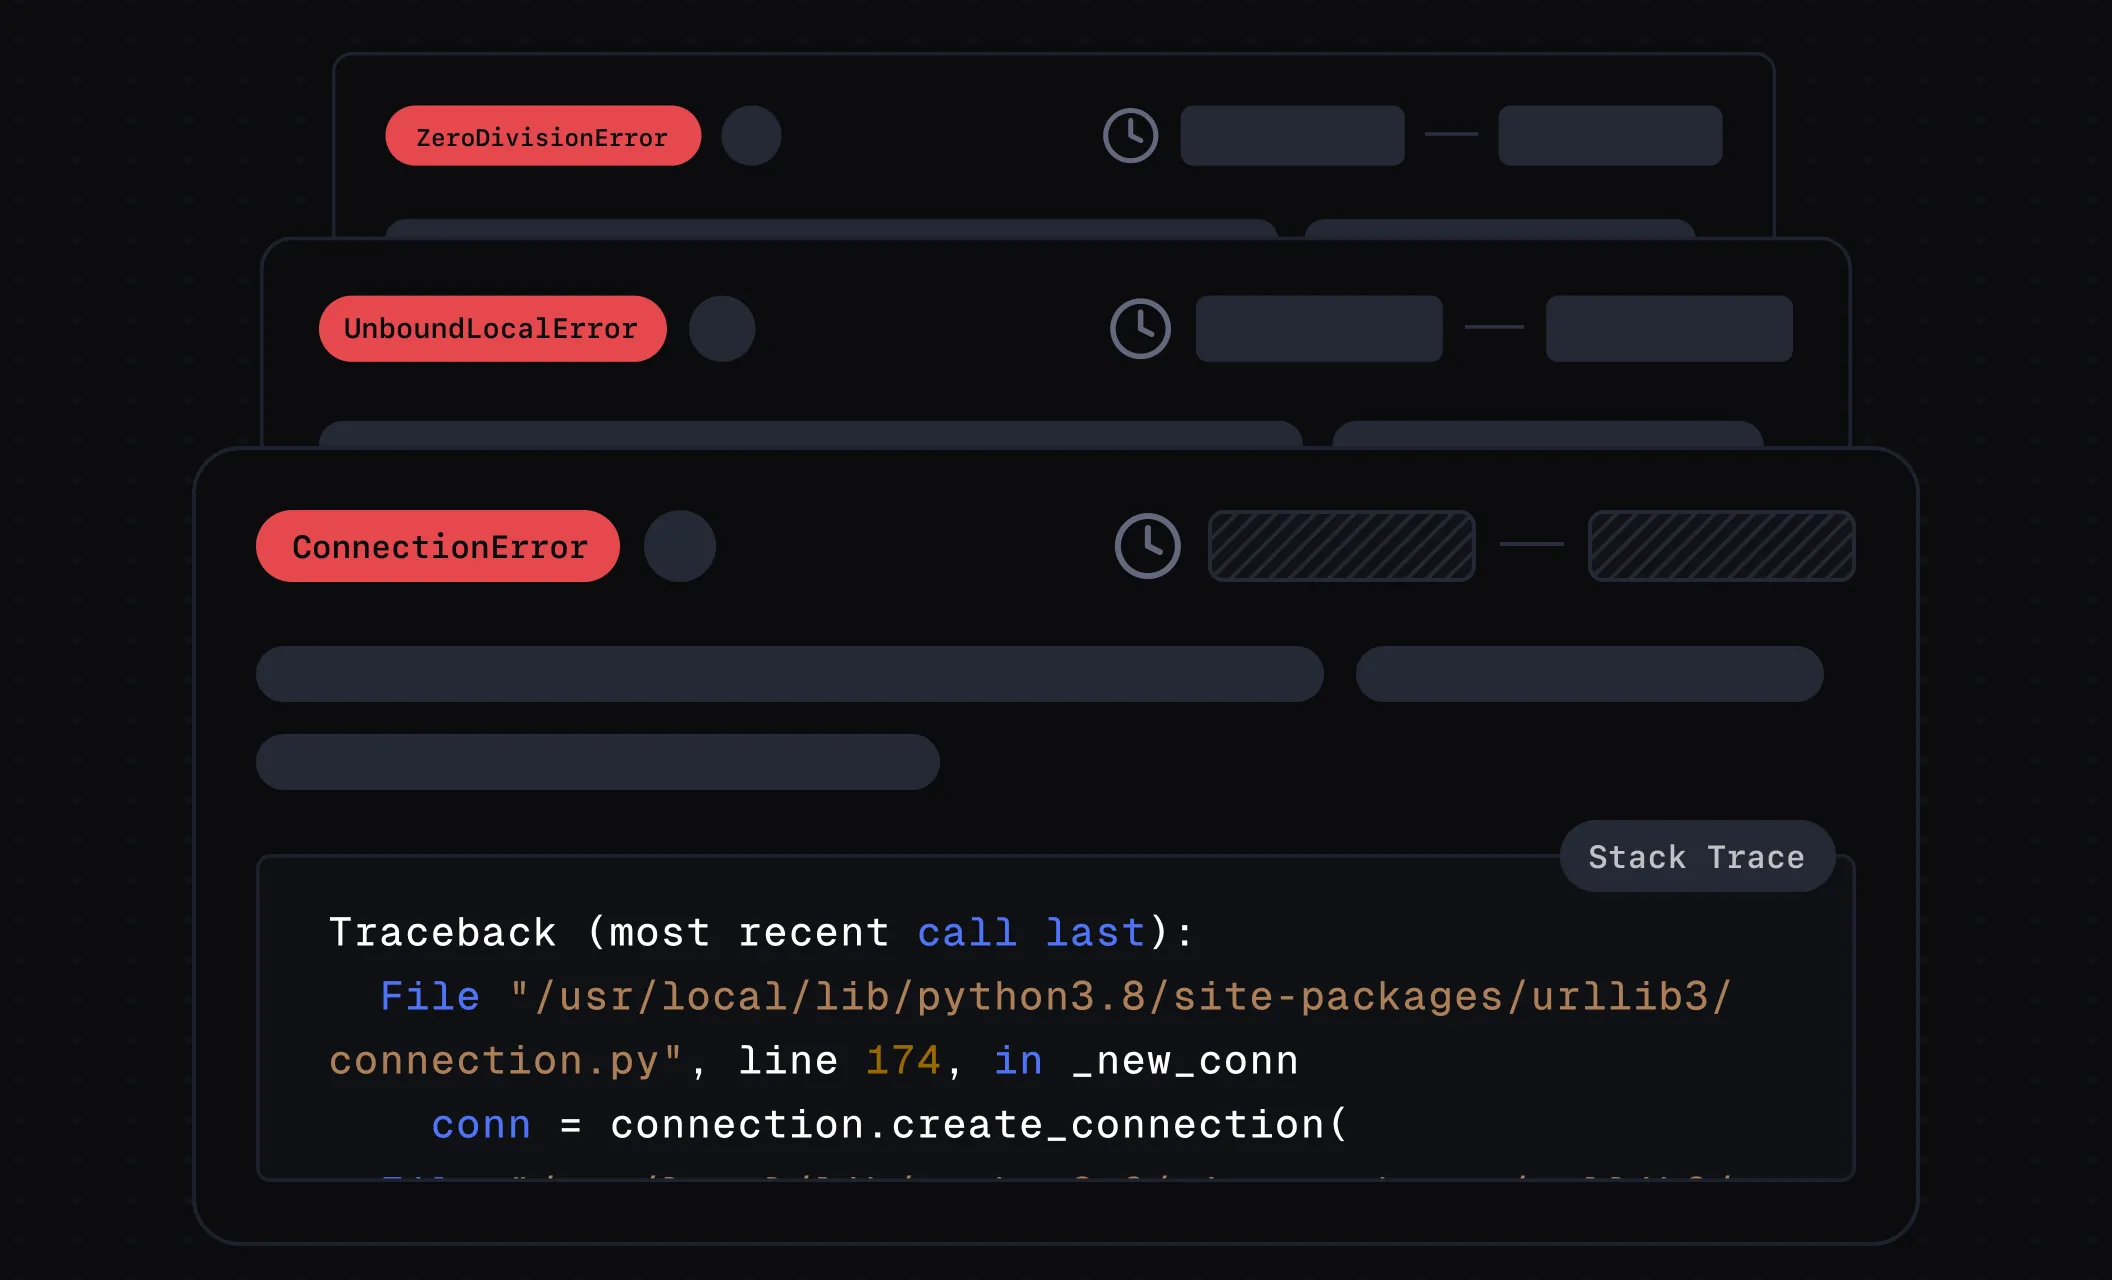
Errors

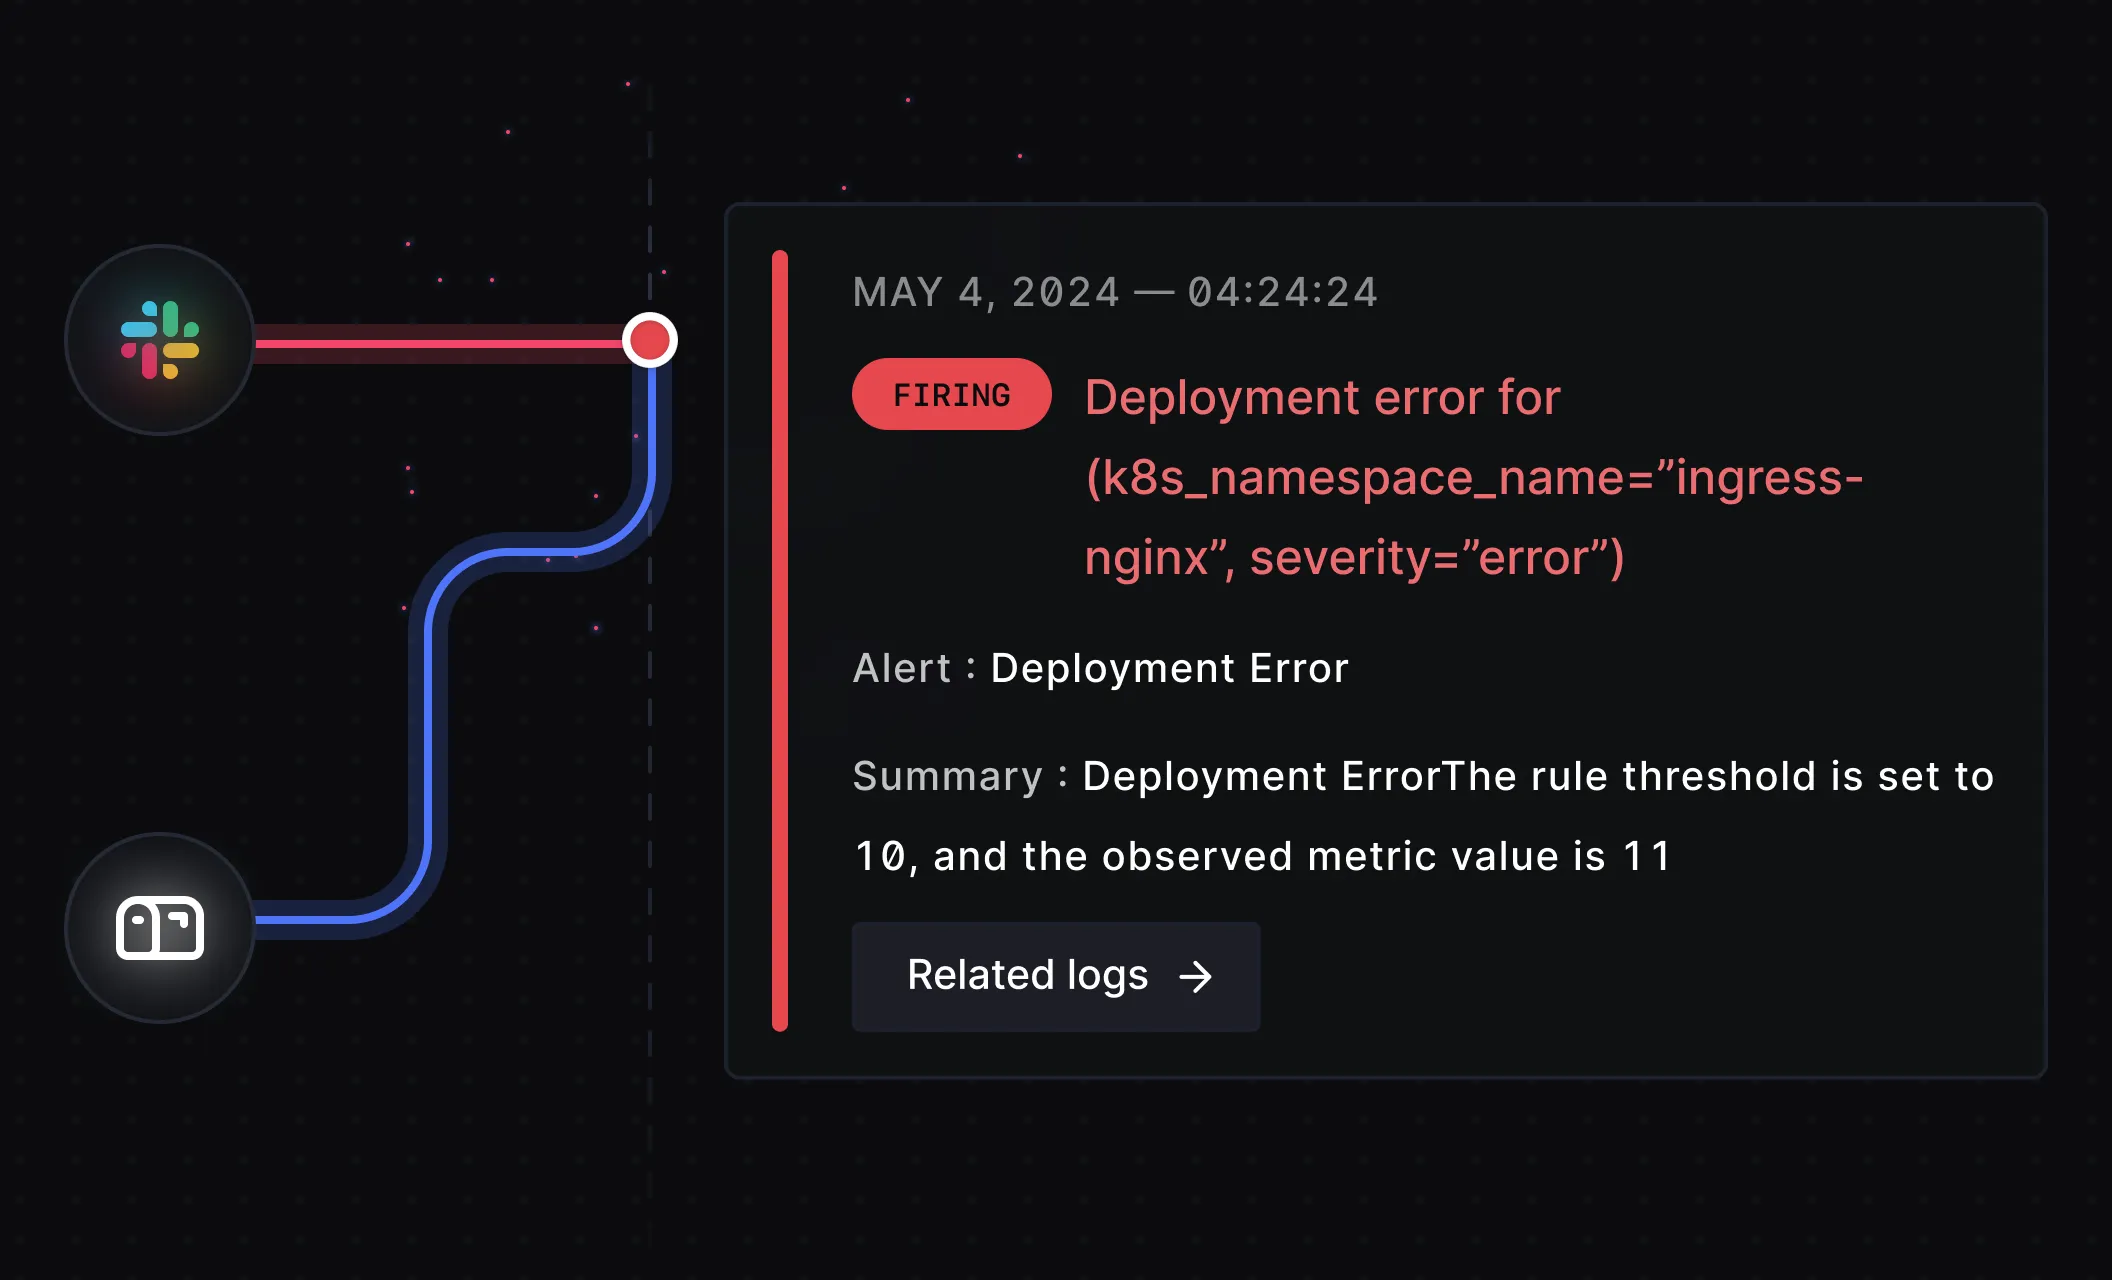
Alerts
INGEST DATA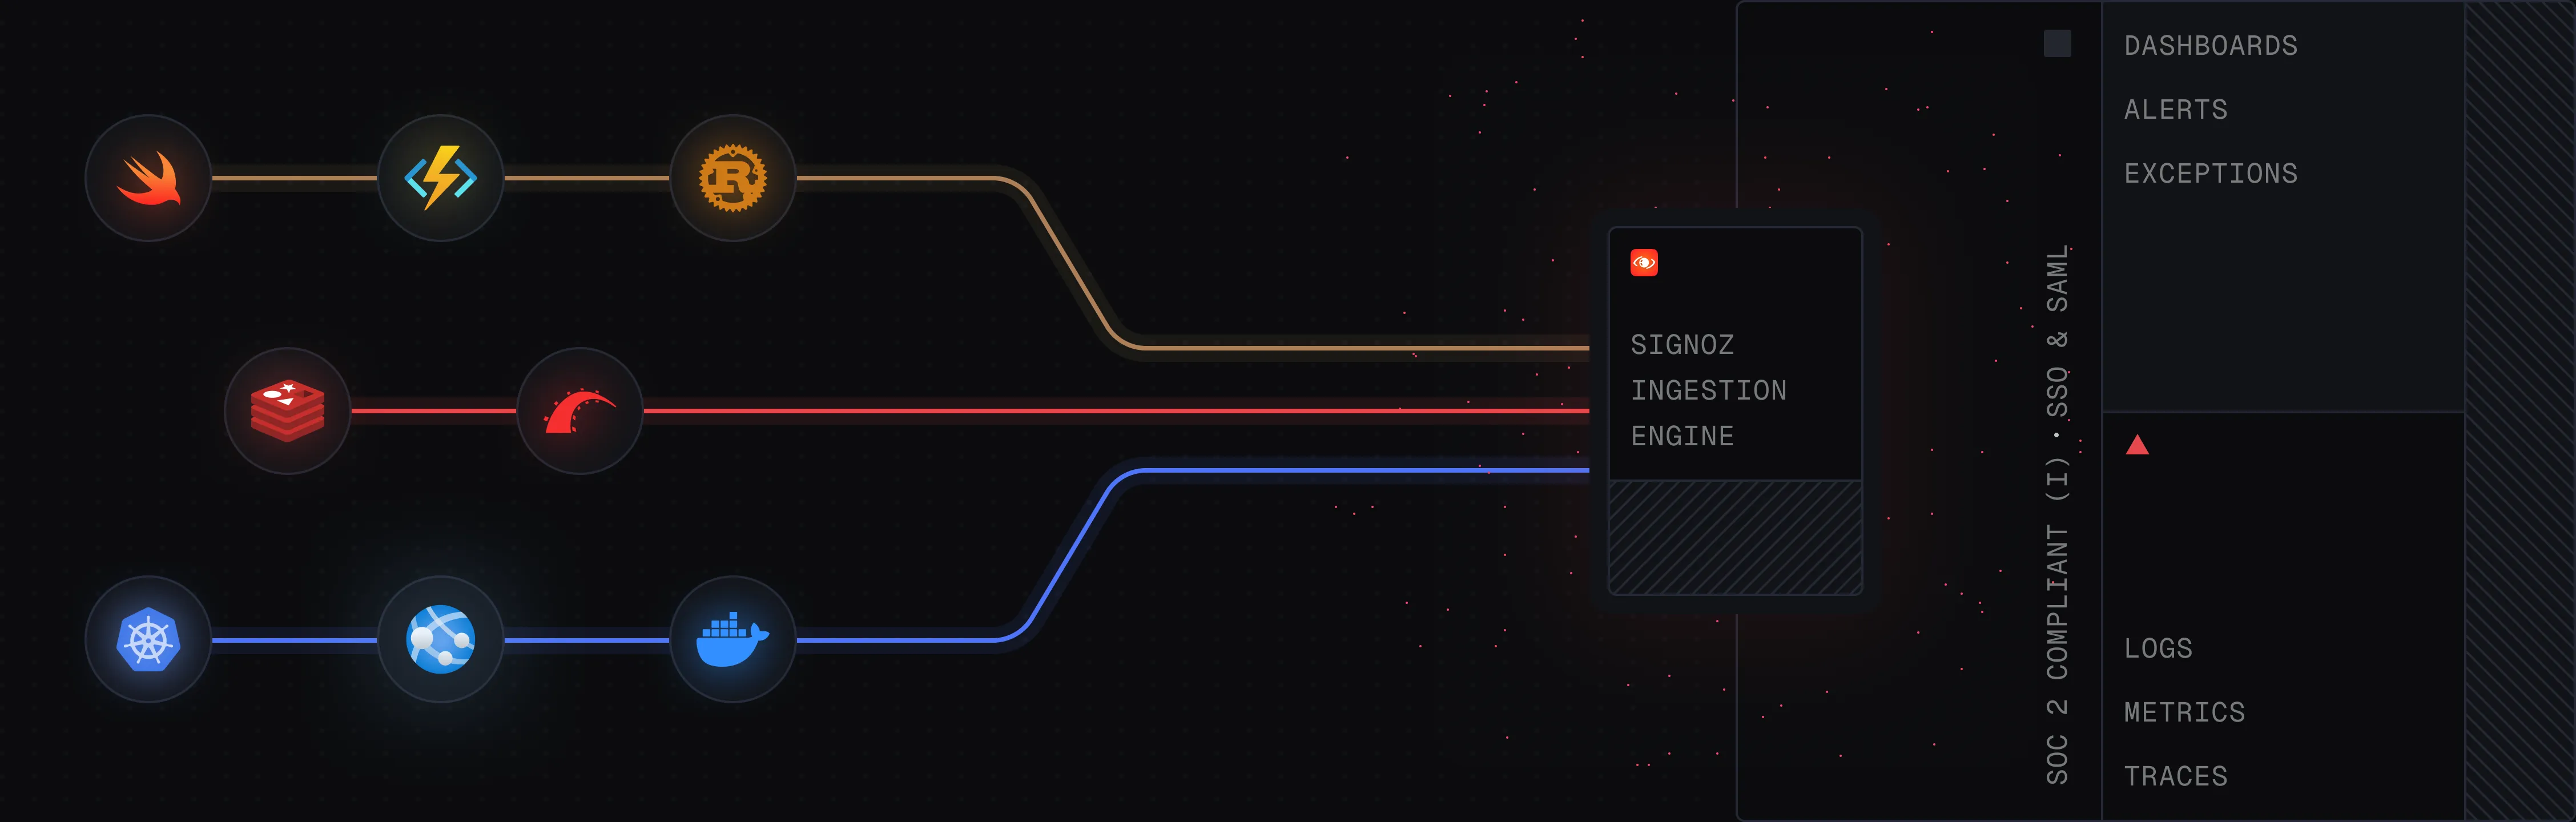


crafted by humans.
No need of using disparate tools for observability. Get everything in a single platform.
You can self-host SigNoz or use our cloud services, or use both depending on your use-cases.
SigNoz uses ClickHouse (used by likes of Uber & Cloudflare) as datastore - an extremely fast and highly optimized storage for observability data.
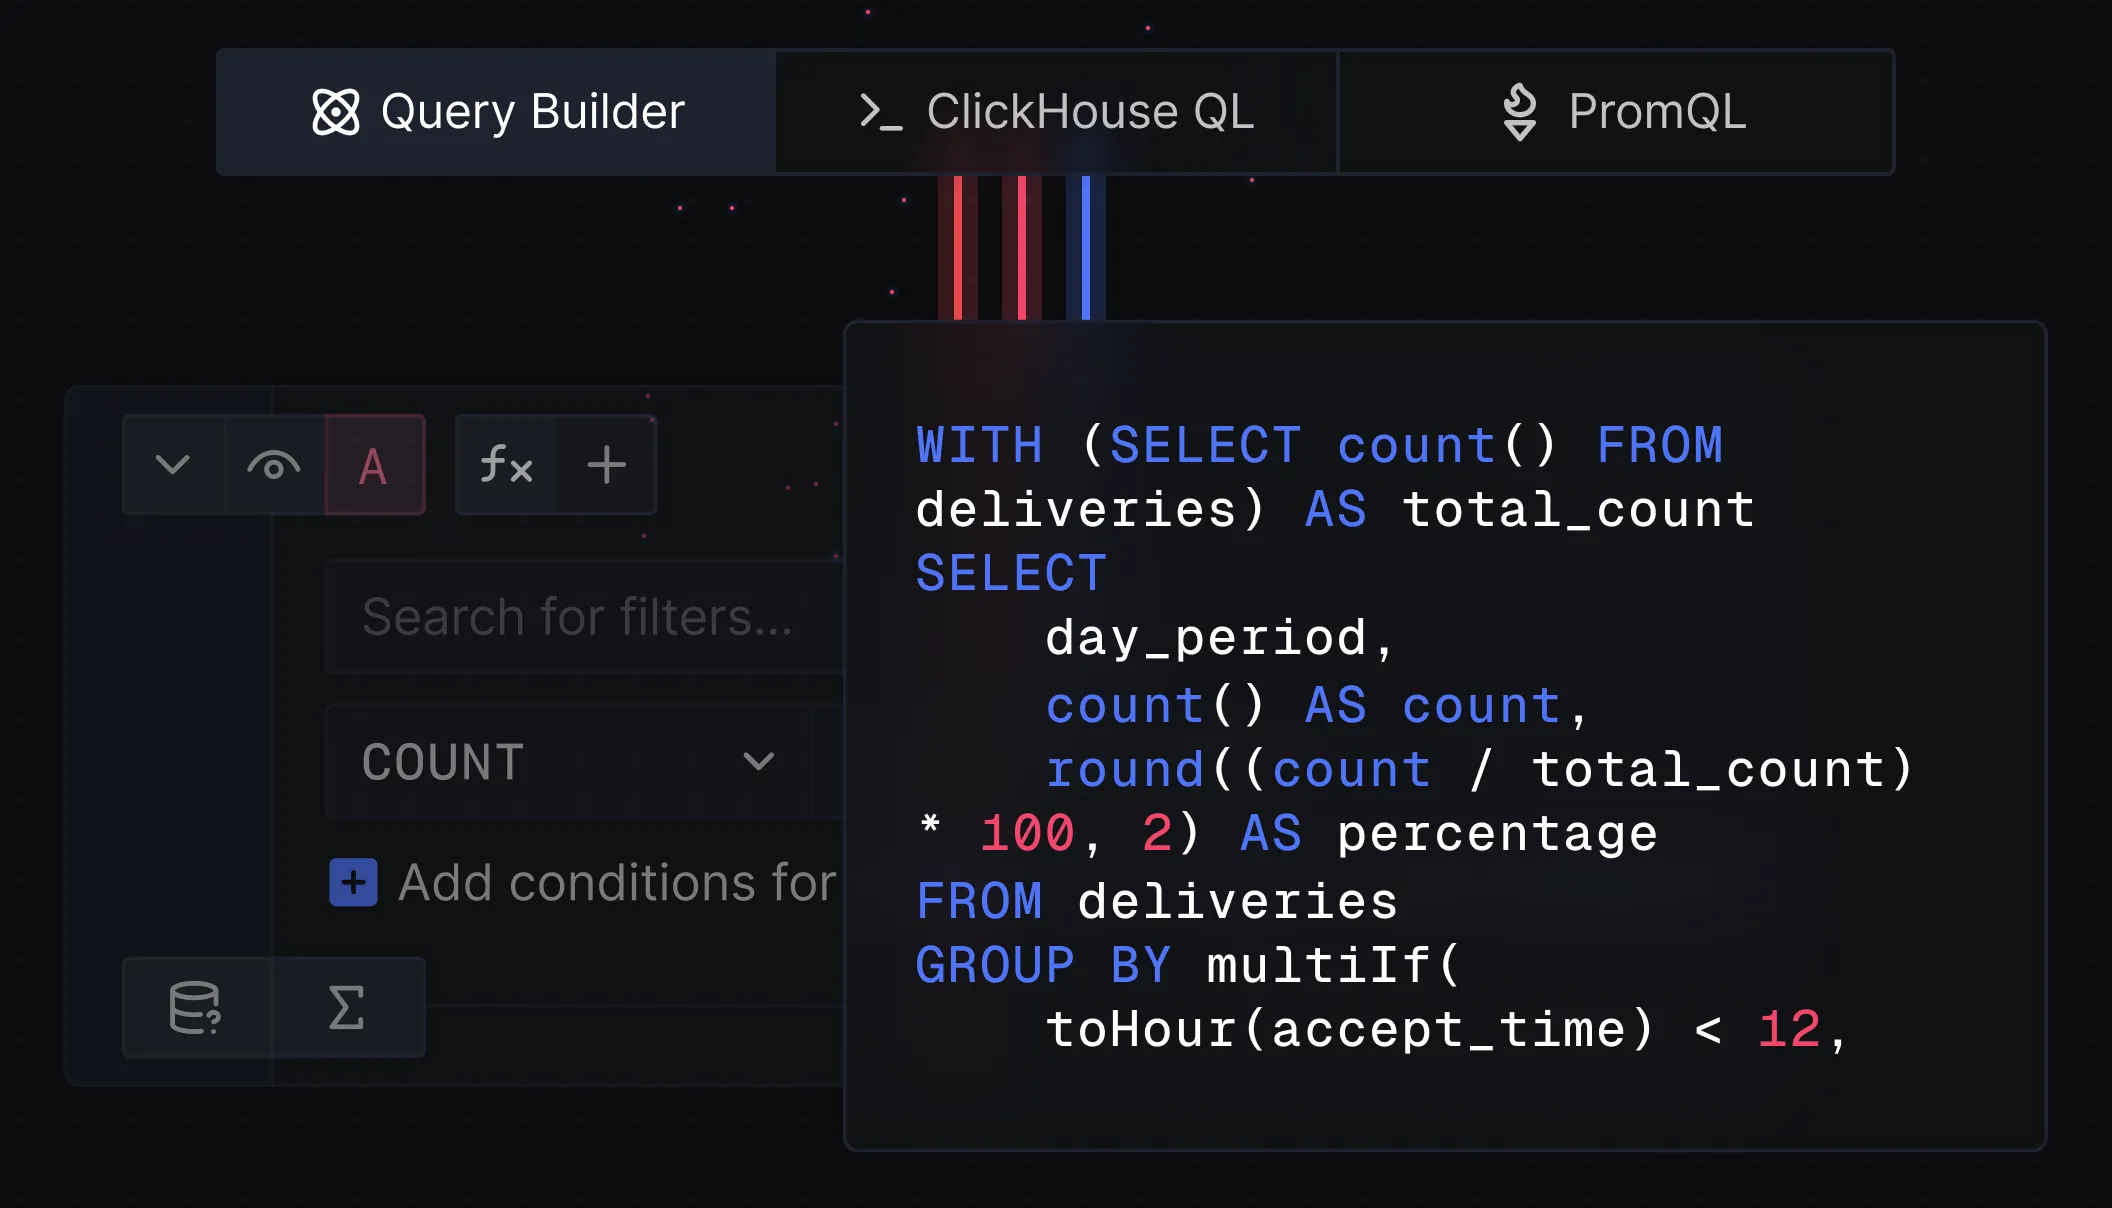
DIY Query builder, PromQL, and ClickHouse queries to fulfill all your use-cases around querying observability data.
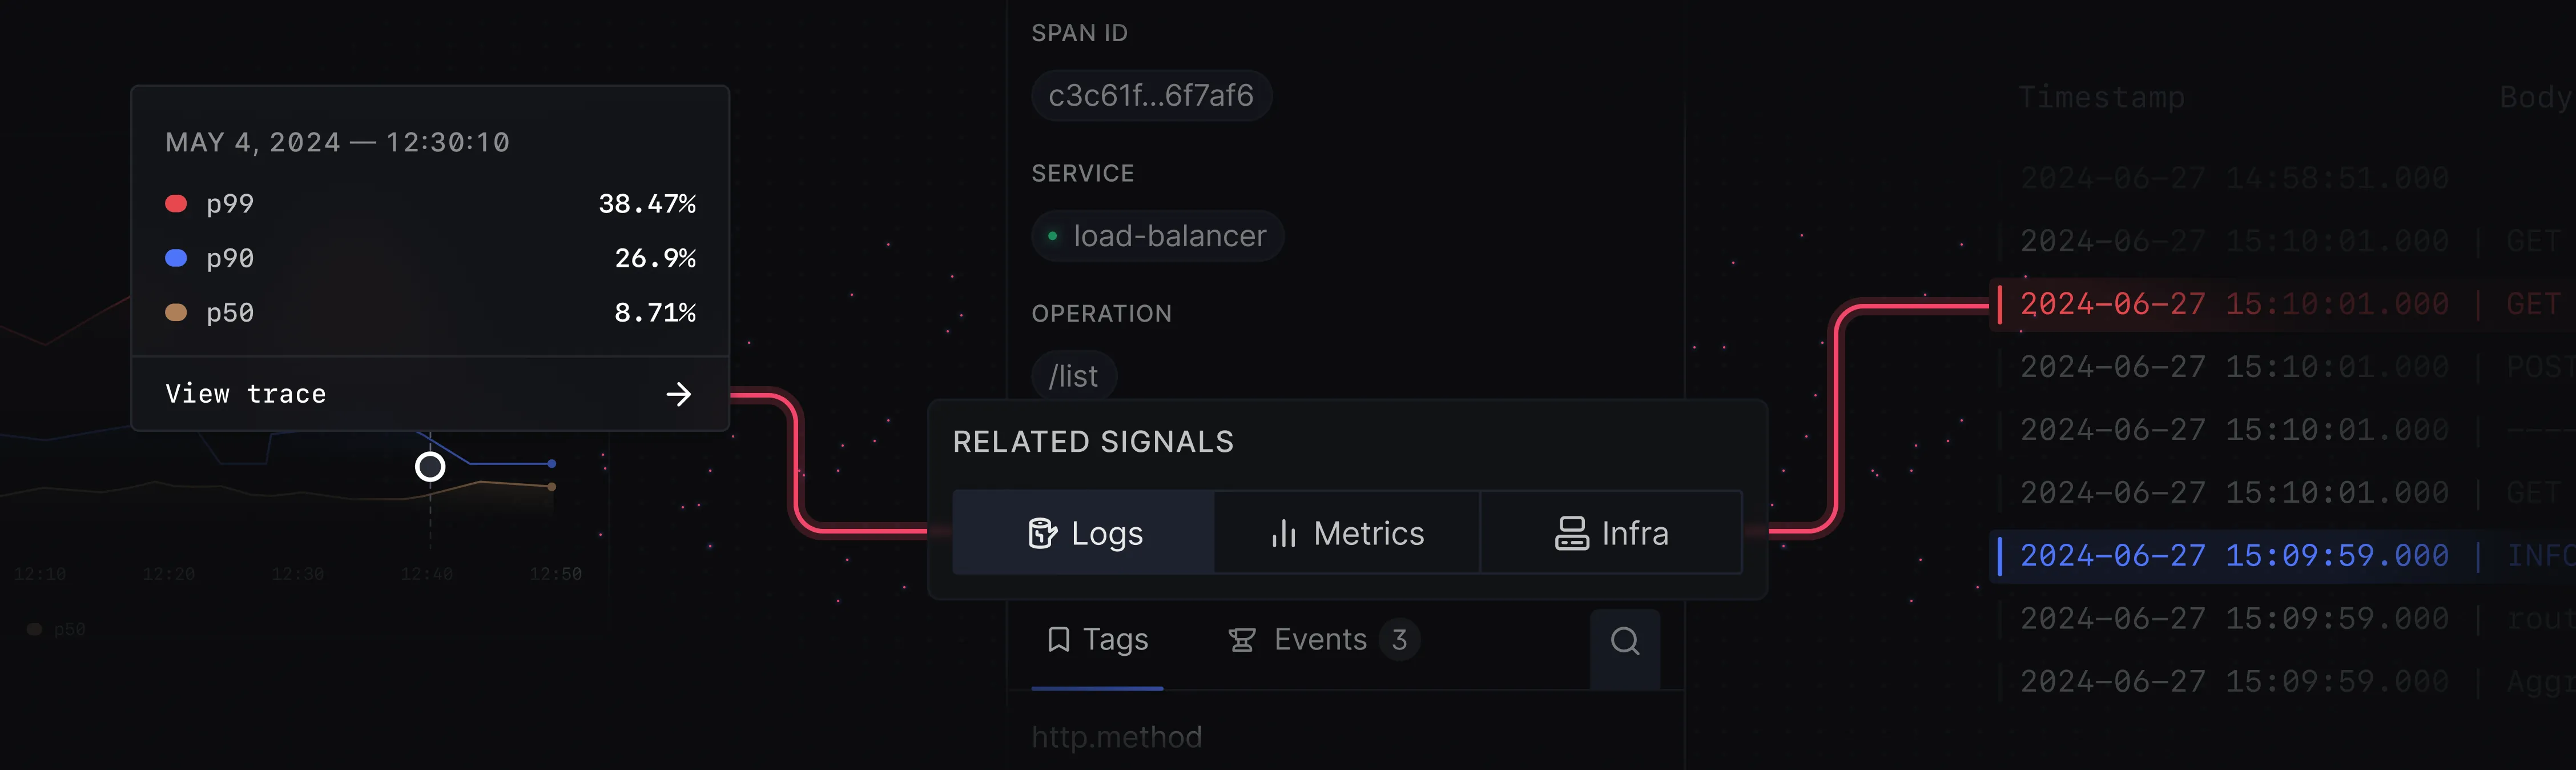
Correlated logs, metrics and traces for much richer context while debugging.
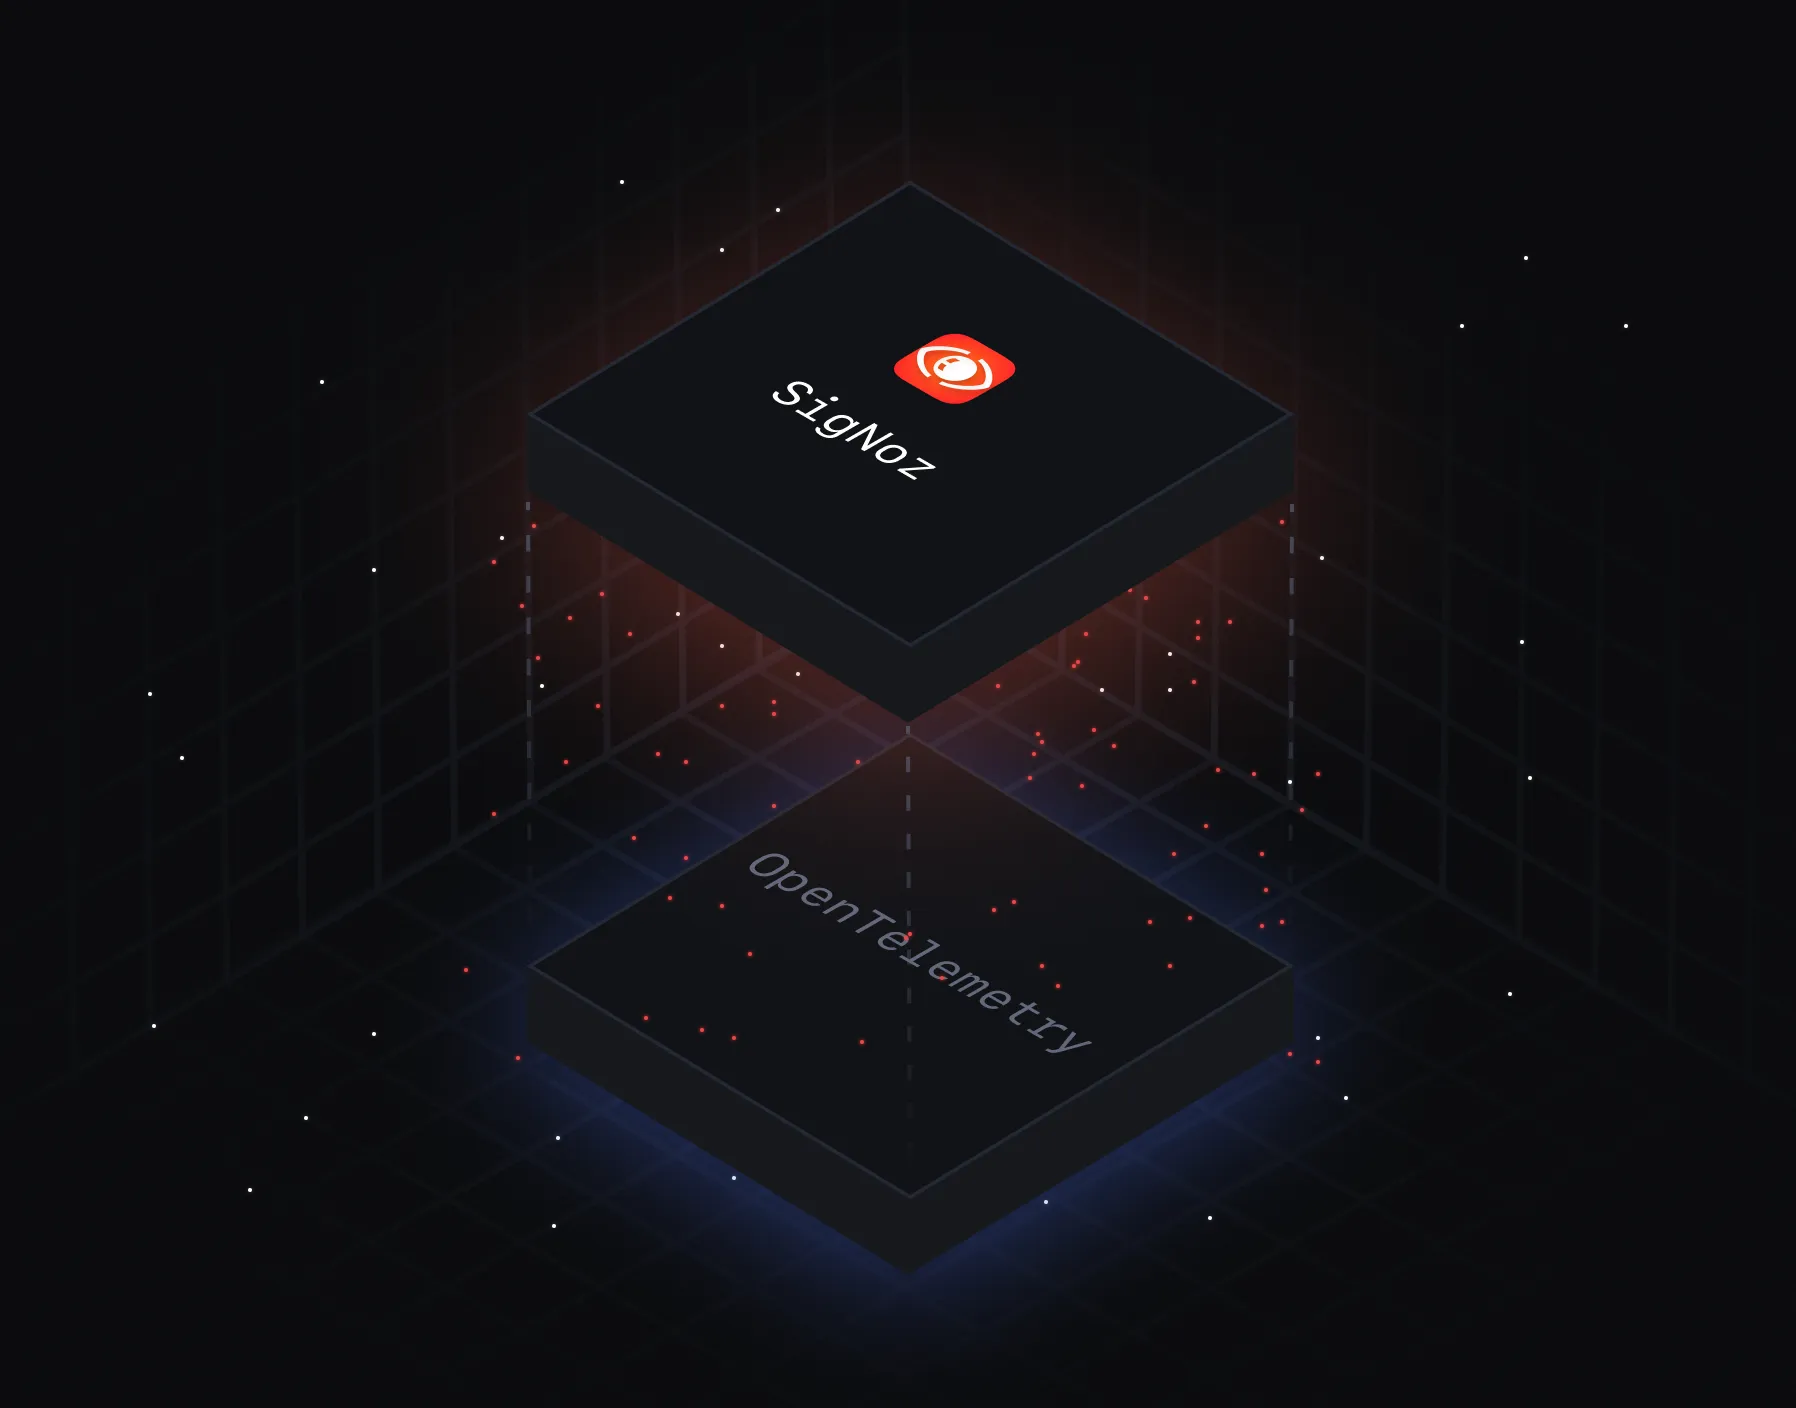
SigNoz is OpenTelemetry-Native
But why OpenTelemetry?
OpenTelemetry is the second most active project in the CNCF, with only
Kubernetes being more active.

No vendor lock-in
Get free of vendor-based agents inside your codebase.

Futureproof
OpenTelemetry's extensibility ensures support for any evolving technologies.

Covers all use-cases
OpenTelemetry is a one-stop solution for all your telemetry needs. Generate logs, metrics, and traces with one SDK.

Standardize Observability
A single standard for all telemetry signals means increased developer productivity, consistency across teams.
SigNoz is built from the ground up for OpenTelemetry
SigNoz offers the best in class support for OpenTelemetry's semantic conventions with the best visualizations ⎯ powered by our powerful ingestion engine.
- OpenTelemetry-first docs
- Correlation of signals based on OpenTelemetry's semantic conventions
- Exceptions based on OpenTelemetry's Trace data
- Messaging queue monitoring based on OTel's trace & metric's data
- Deployment env and marker support powered by OpenTelemetry
- Configurable observability pipelines supported by Opamp
- Span-based events for richer context while debugging
Comparing Datadog and New Relic's support for OpenTelemetry data
Walk through how native OpenTelemetry tools compare to APM products that have adopted OpenTelemetry only partially.
Why
select
SigNoz?
Built for scale
Our powerful ingestion engine has a proven track record of handling 10TB+ data ingestion per day.
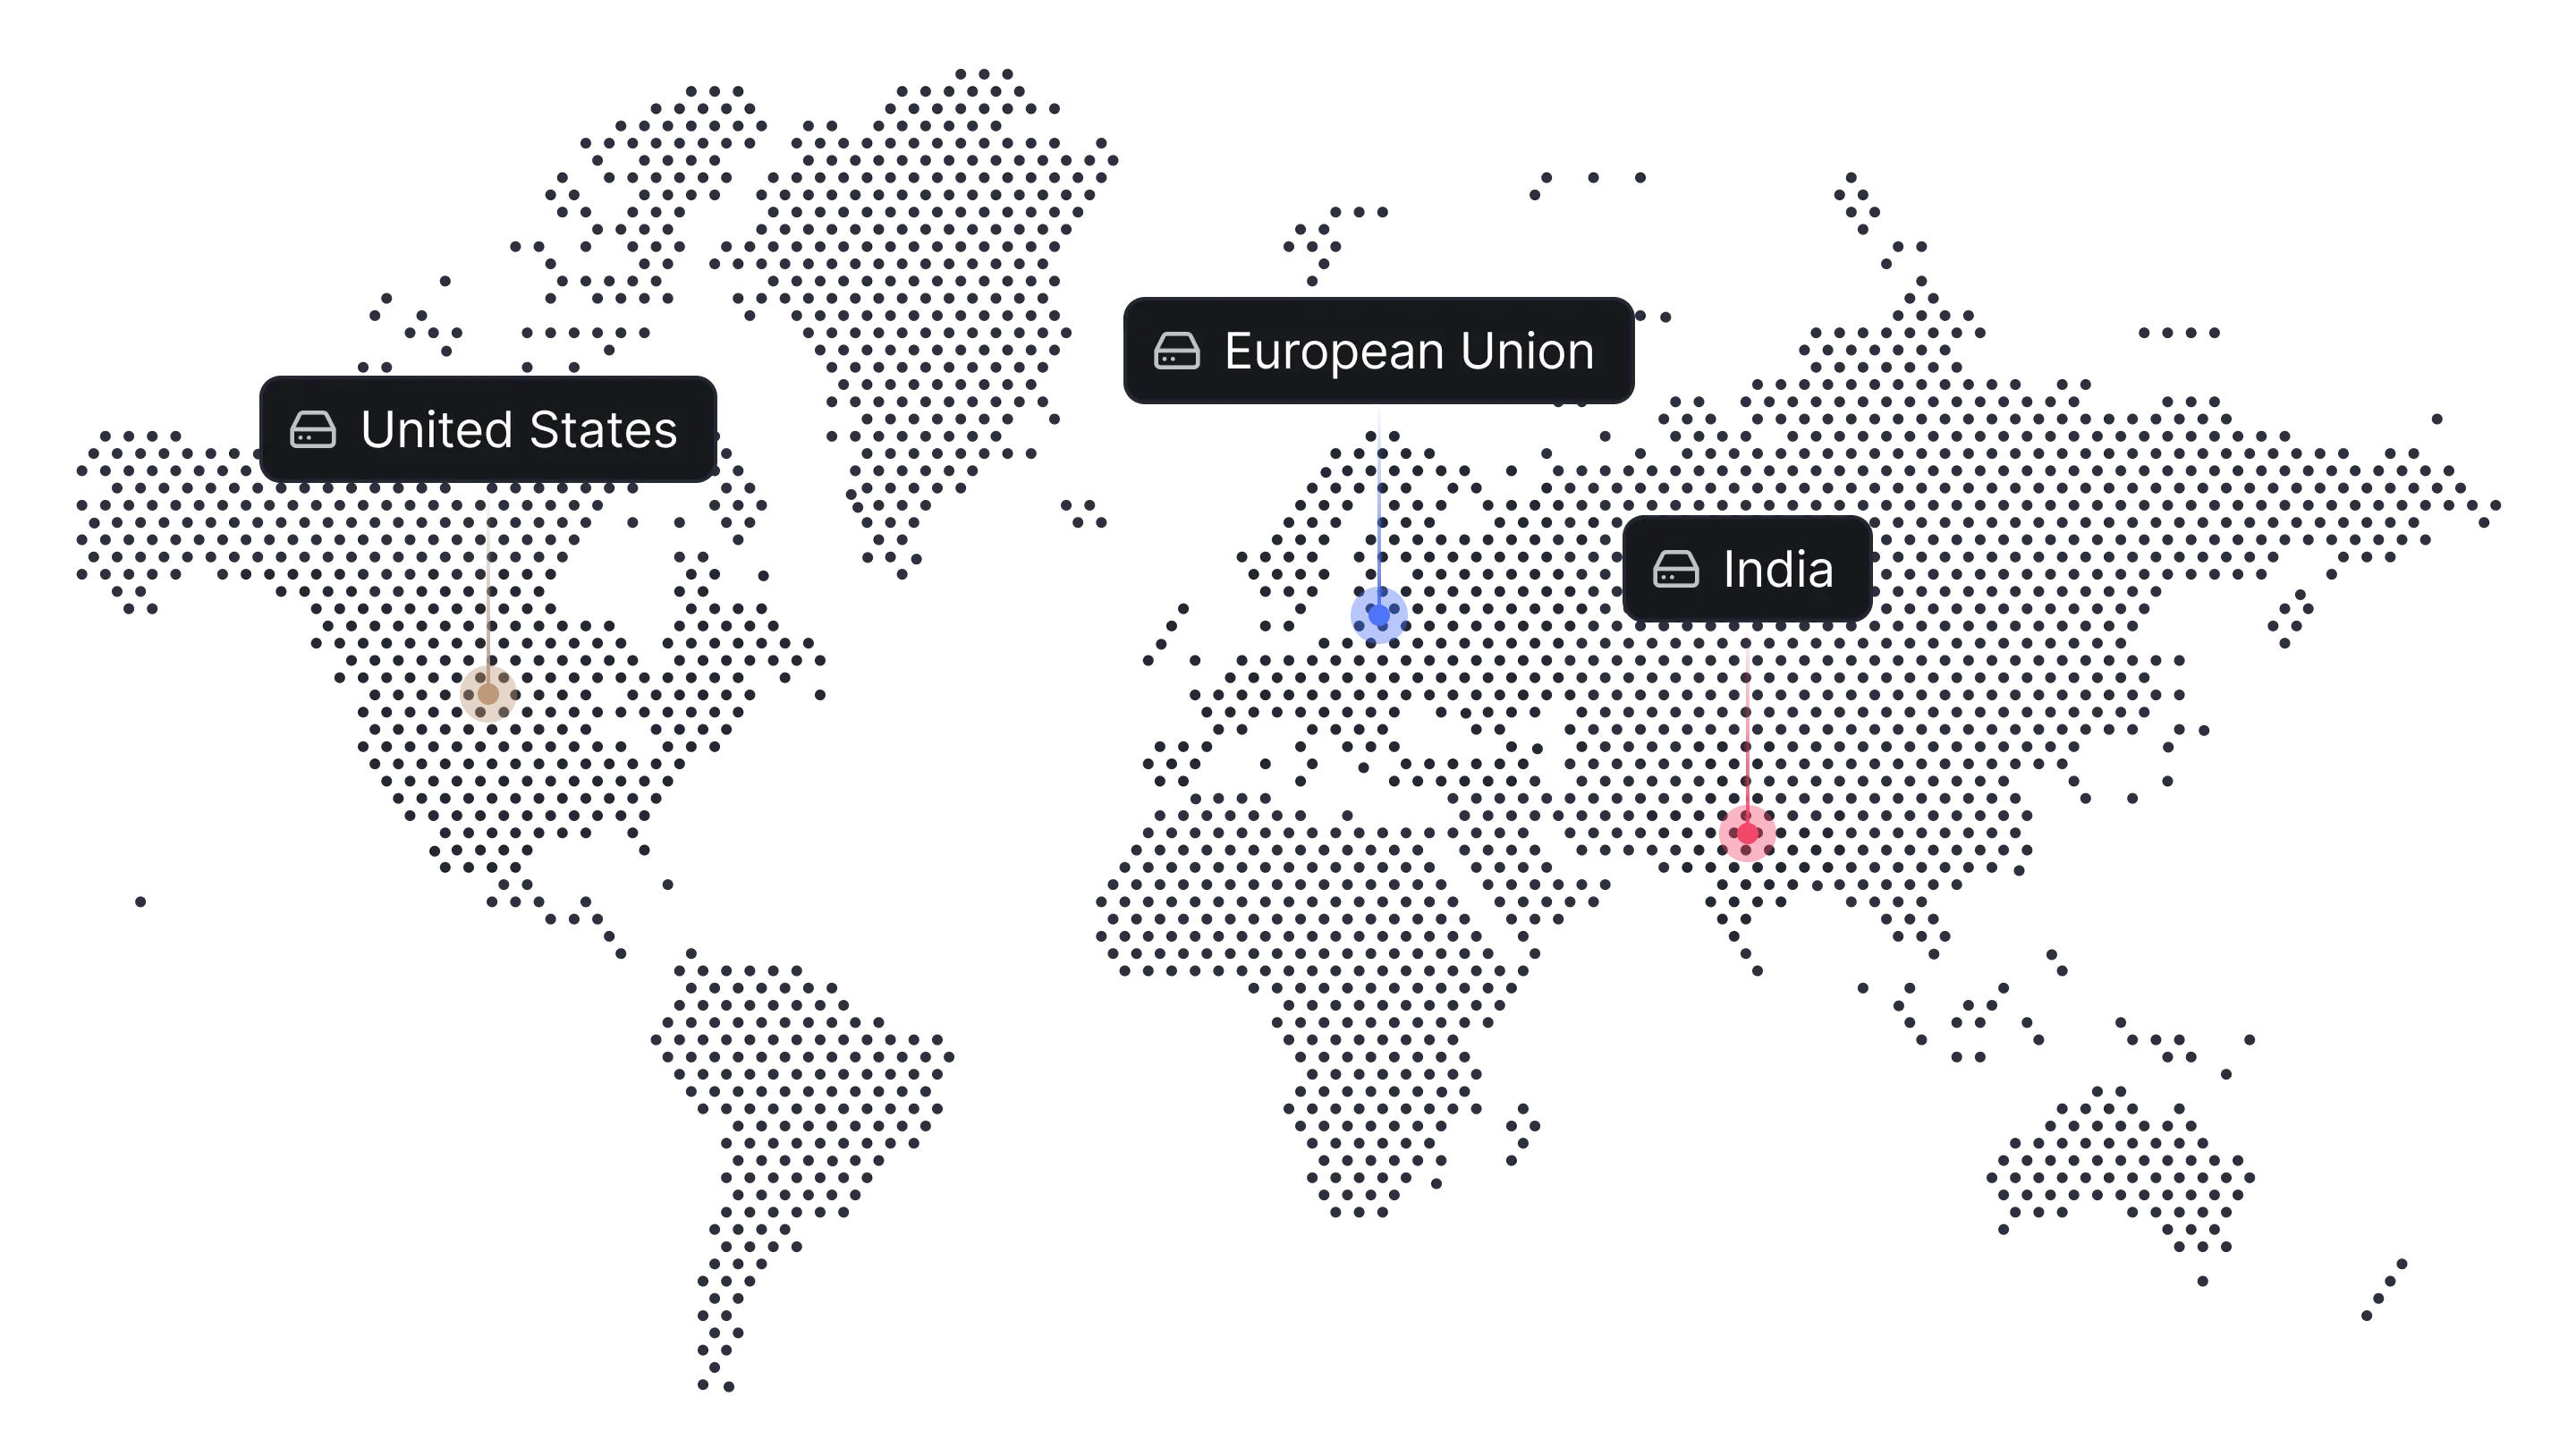
Trusted across the globe
Used by teams in all 5 continents ⎯ across the mountains, rivers, and the high seas.
Powering observability for teams of all sizes
Hundreds of companies ⎯from early-stage start-ups to public enterprises use SigNoz to build more reliable products.
Enterprise-grade Observability
Get access to observability at any scale with advanced security and compliance.
- SSO and SAML support
- Query API Keys
- Advanced Security
- AWS Private Link
- VPC Peering

Pricing you can trust
Tired of Datadog’s unpredictable bills or New Relic’s user-based pricing?
We’re here for you.
No user-based pricing
Add as many team members as you want.
No host (container or nodes) based pricing
No need to worry about auto-scaling during peak hours.
Simple usage-based pricing
Only pay for the data you send.
No special pricing for custom metrics
All metrics charged simply at $0.1 per million samples.


 We optimized all our top endpoints and fine-tuned database calls to improve our backend API response times by 35% using SigNoz.
 Both our dev and QA teams use SigNoz actively in dev and production environments to optimize application performance.
Vijaya Perumal
Tech Lead