Application Performance Monitoring
Powered by OpenTelemetry
SigNoz APM comes with out-of-box charts for key application metrics powered by OpenTelemetry.
Get latency, requests per second, error percentage, apdex & other key metrics
to understand your application performance.


Application Performance Monitoring?

Faster Analytics powered by ClickHouse
We use ClickHouse as our datastore. ClickHouse is a very fast and resource-efficient database for real-time analytics. Big companies like Uber and Cloudflare power their observability with ClickHouse as the database. It provides best-in-class ingestion rates and great compression ratios for efficient storage.

Correlation with other signals
We provide traces, metrics, and logs under a single pane of glass powered by OpenTelemetry SDKs. You can correlate your signals for a much richer context while debugging. Generate metrics from trace data, jump from traces to logs and vice-versa.

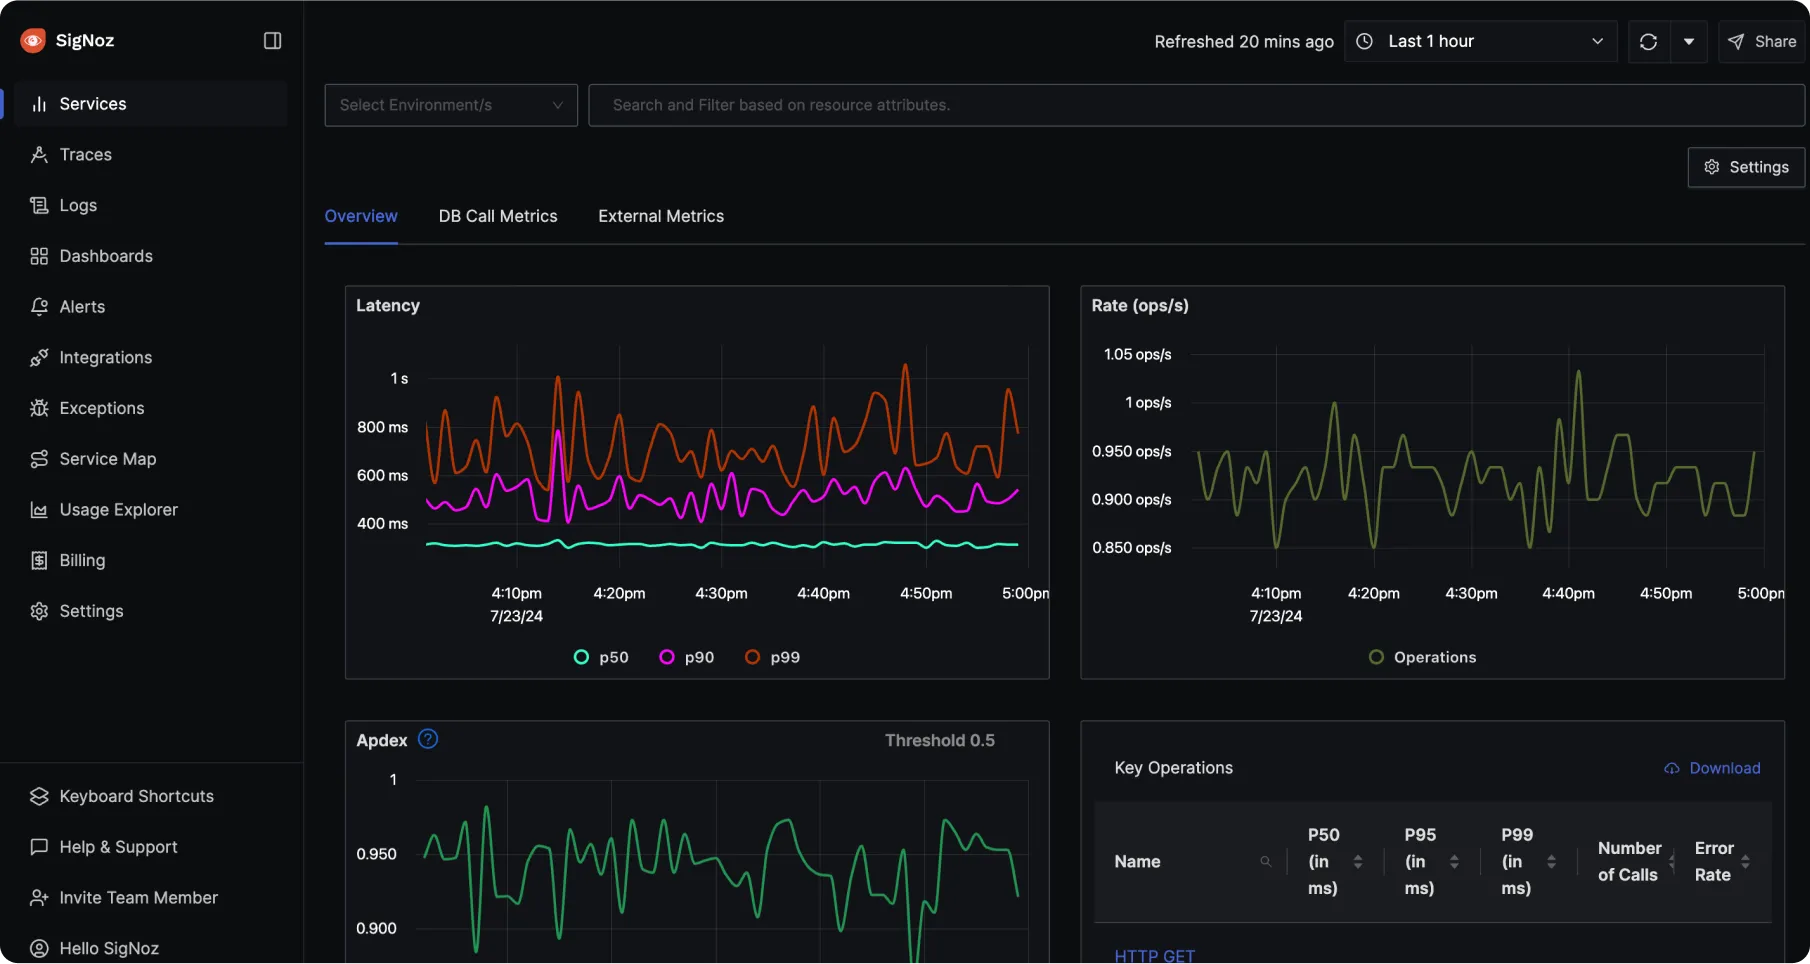
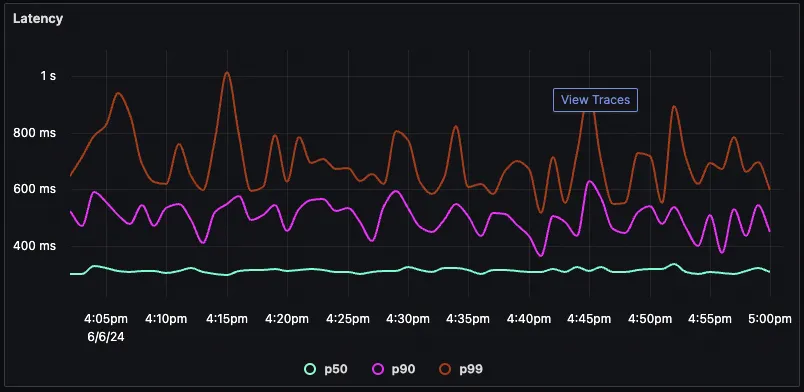
Out-of-box charts for key application metrics
Get key application metrics charts like p99, p90, p50 latency, request rate, error rates, Apdex and others with minimal code changes. Use auto-instrumentation libraries provided by OpenTelemetry to get started with observability quickly.
Monitoring Overview
Support for all popular languages
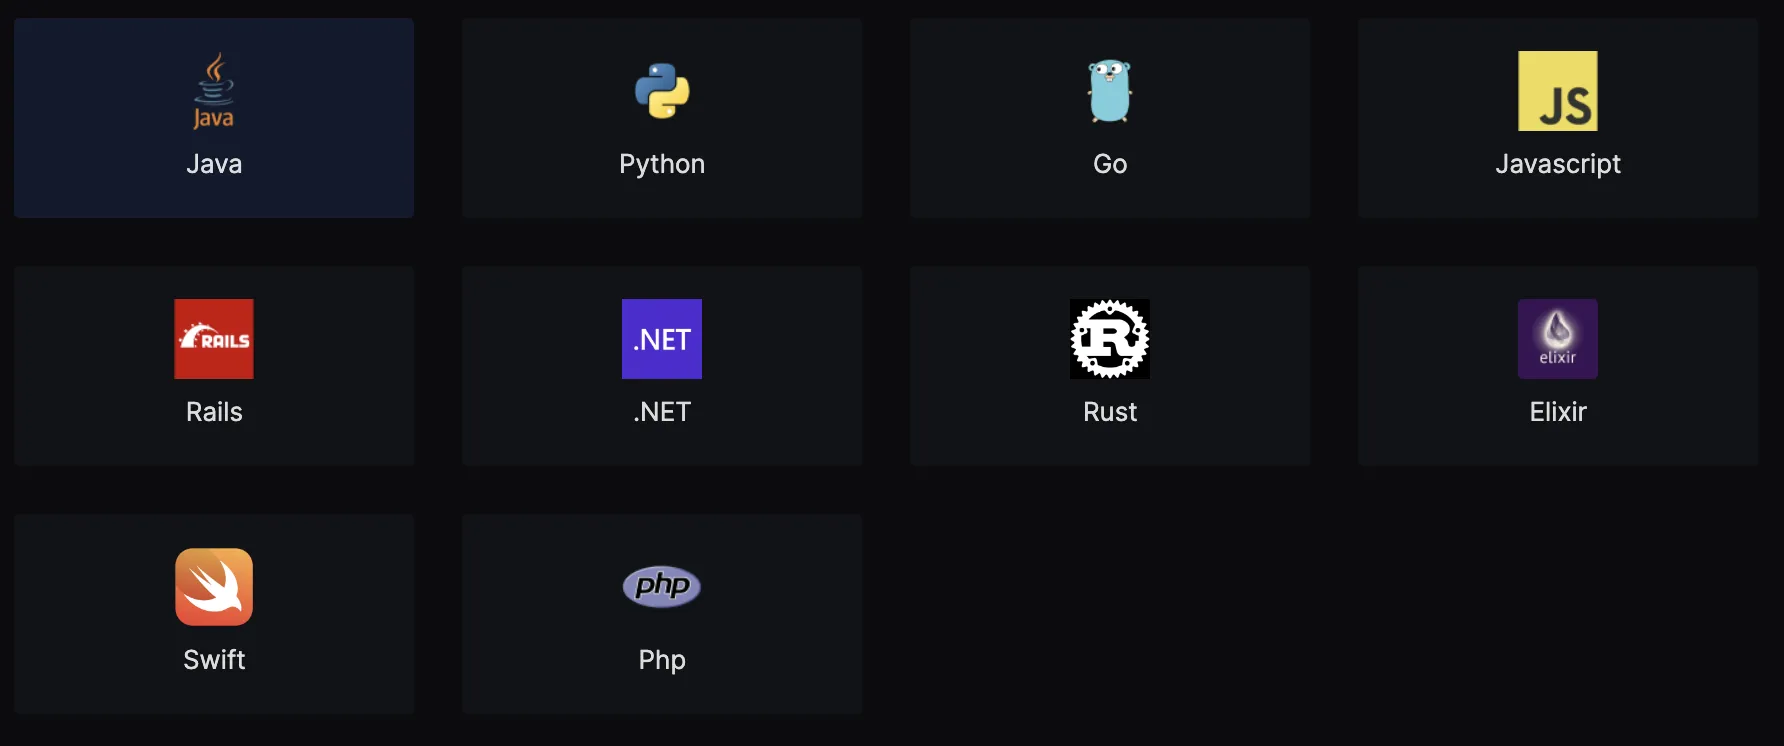
SigNoz supports a wide range of popular languages for application monitoring. Instrument your application code with OpenTelemetry, and start sending data to SigNoz.
Monitor all your services
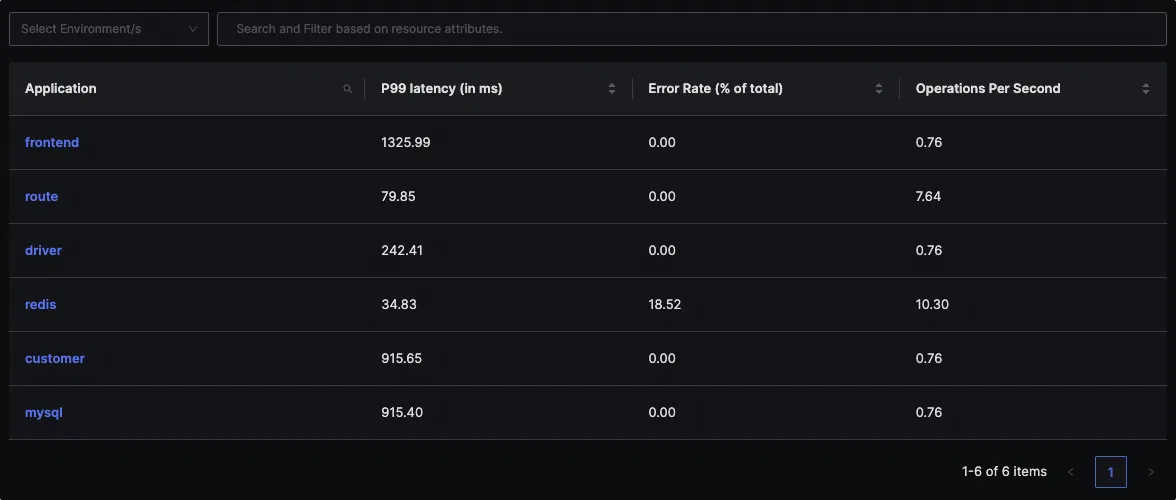
Be on top of your application performance with out-of-box charts for latency, error rate, operations per second, and other critical metrics of all your services.
Out-of-box APM Charts
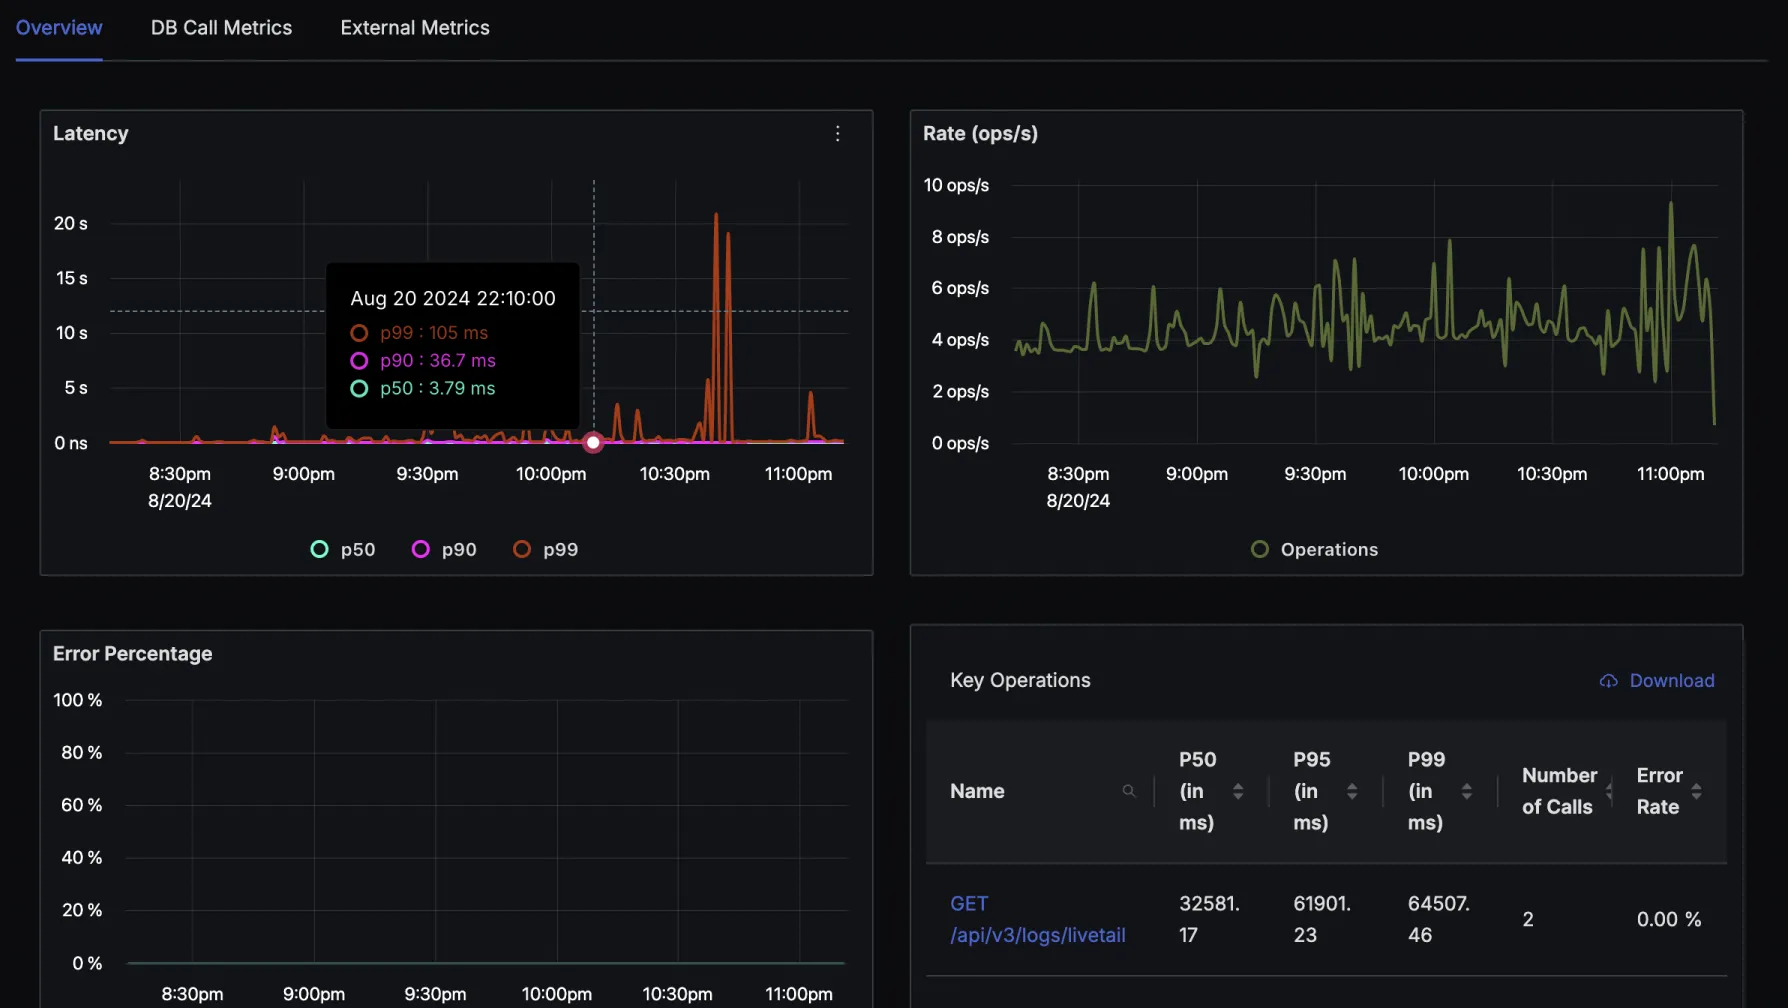
For each of your services, monitor p99, p90, p50 latencies, rate (ops/s), and error rate with out-of-the-box application metrics charts.
Apdex
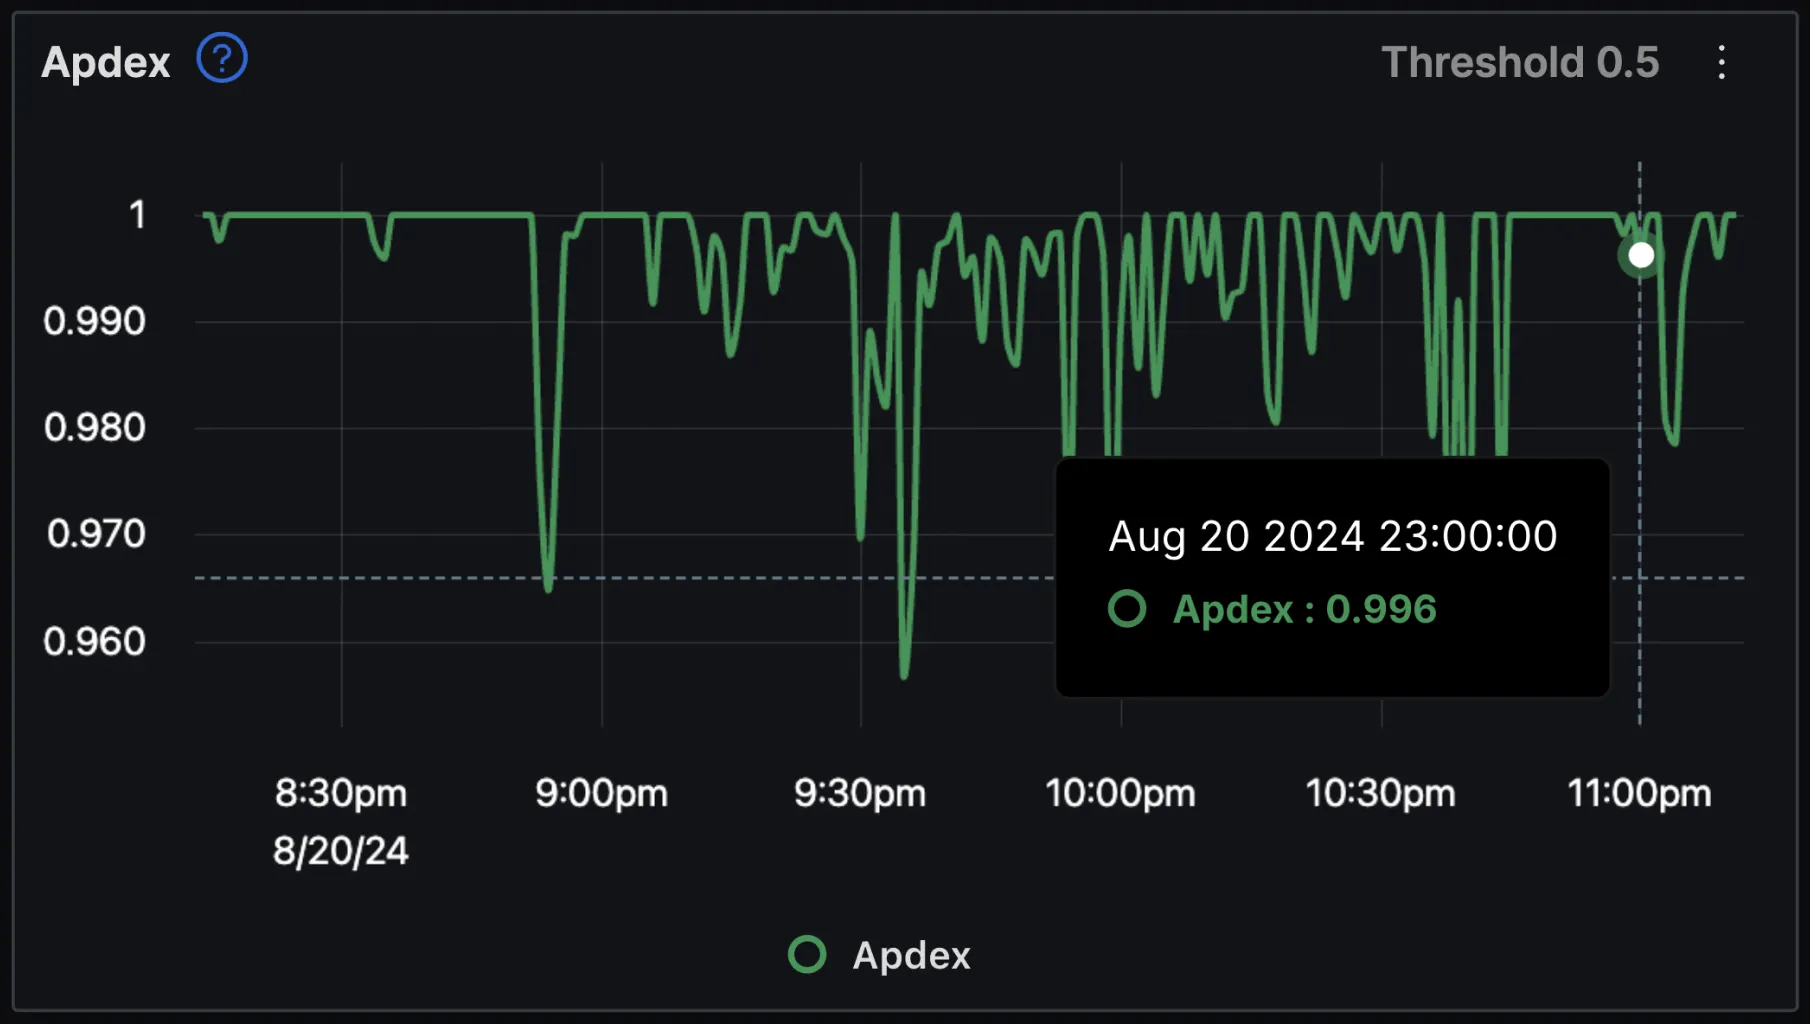
Apdex score indicates the end user’s level of satisfaction from 0(least satisfied) to 1(most satisfied) with application performance. It helps developers gauge their application's performance from the user's perspective.
Database Call Metrics
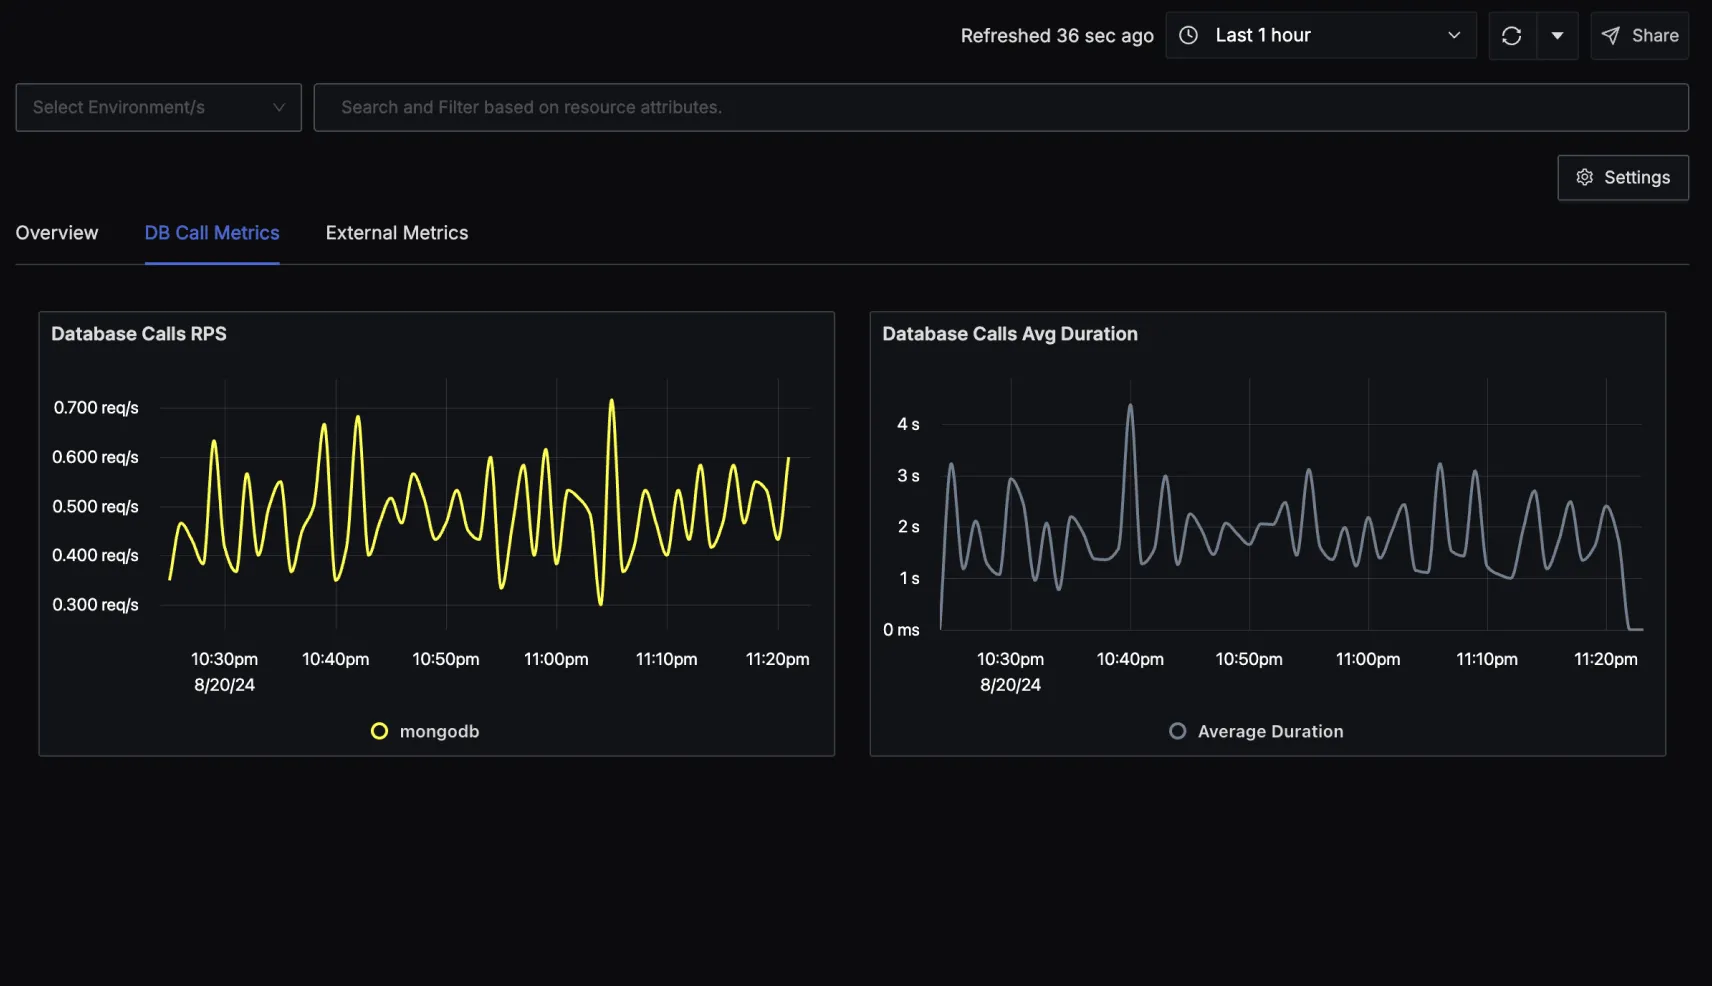
If your application makes any database calls, you can monitor them under DB Call Metrics. Monitor the number of database calls per second and their average duration.
Monitor the Top Endpoints of your service
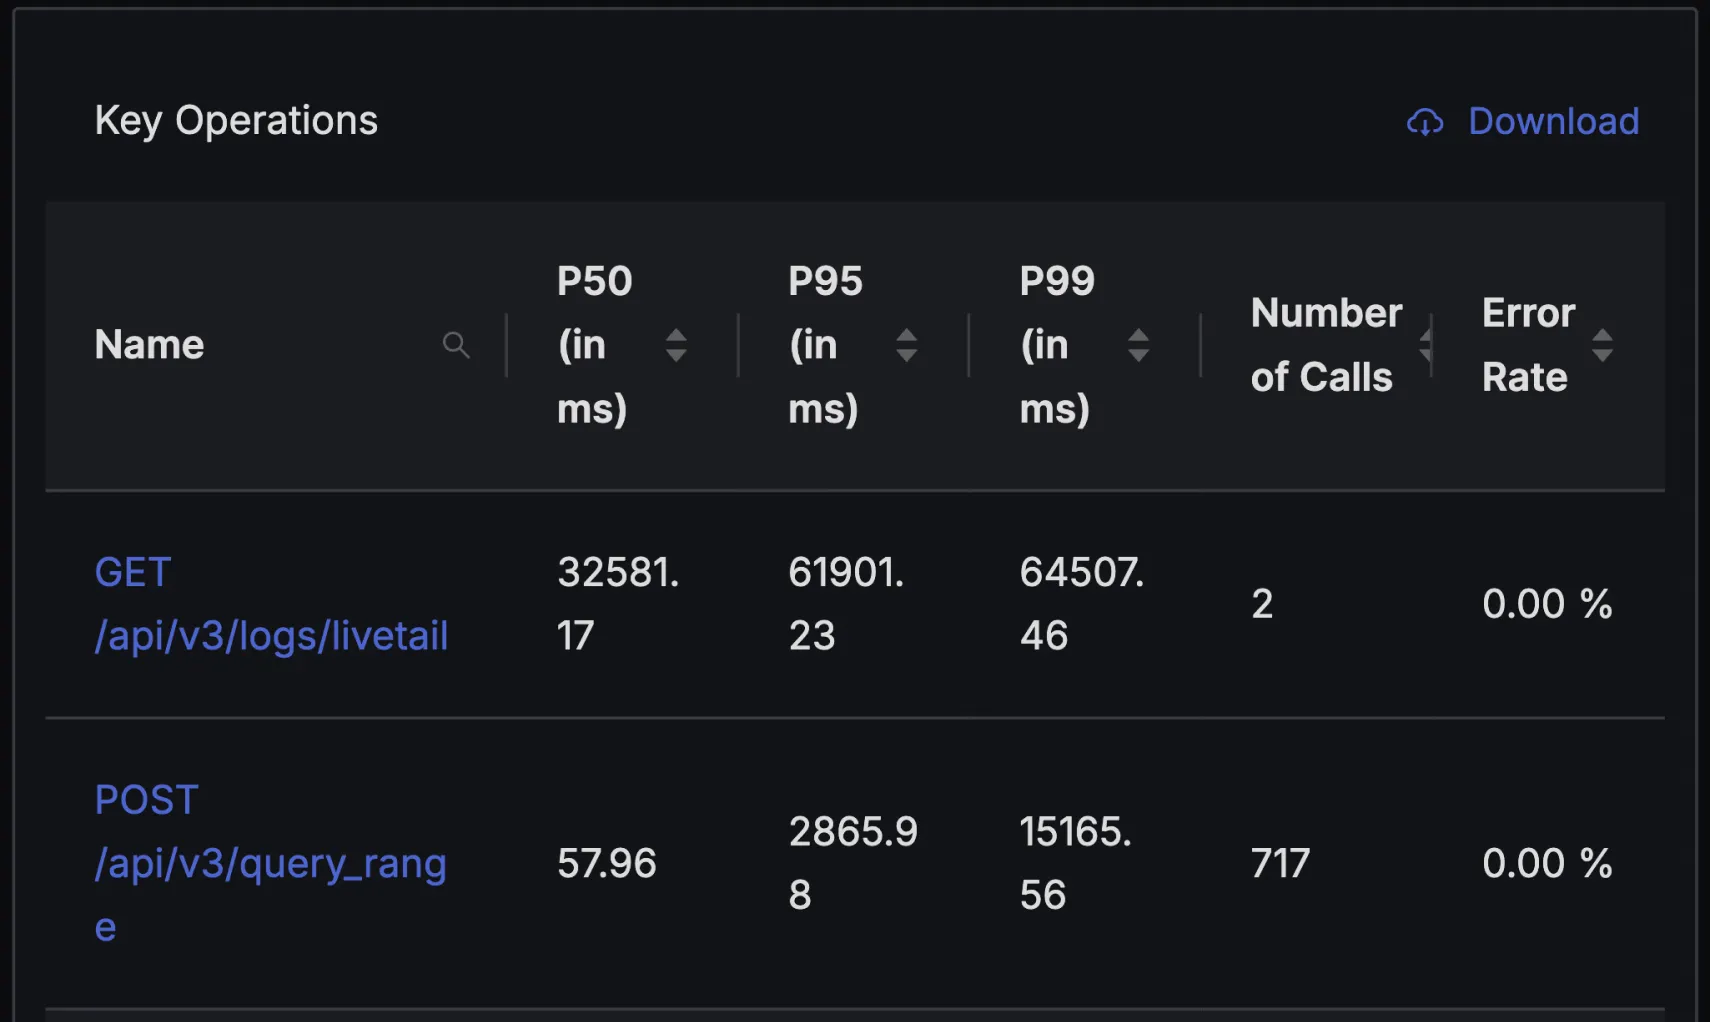
Get a list of key endpoints and important metrics about them. It helps you quickly identify slow endpoints of your application.
External Call Metrics
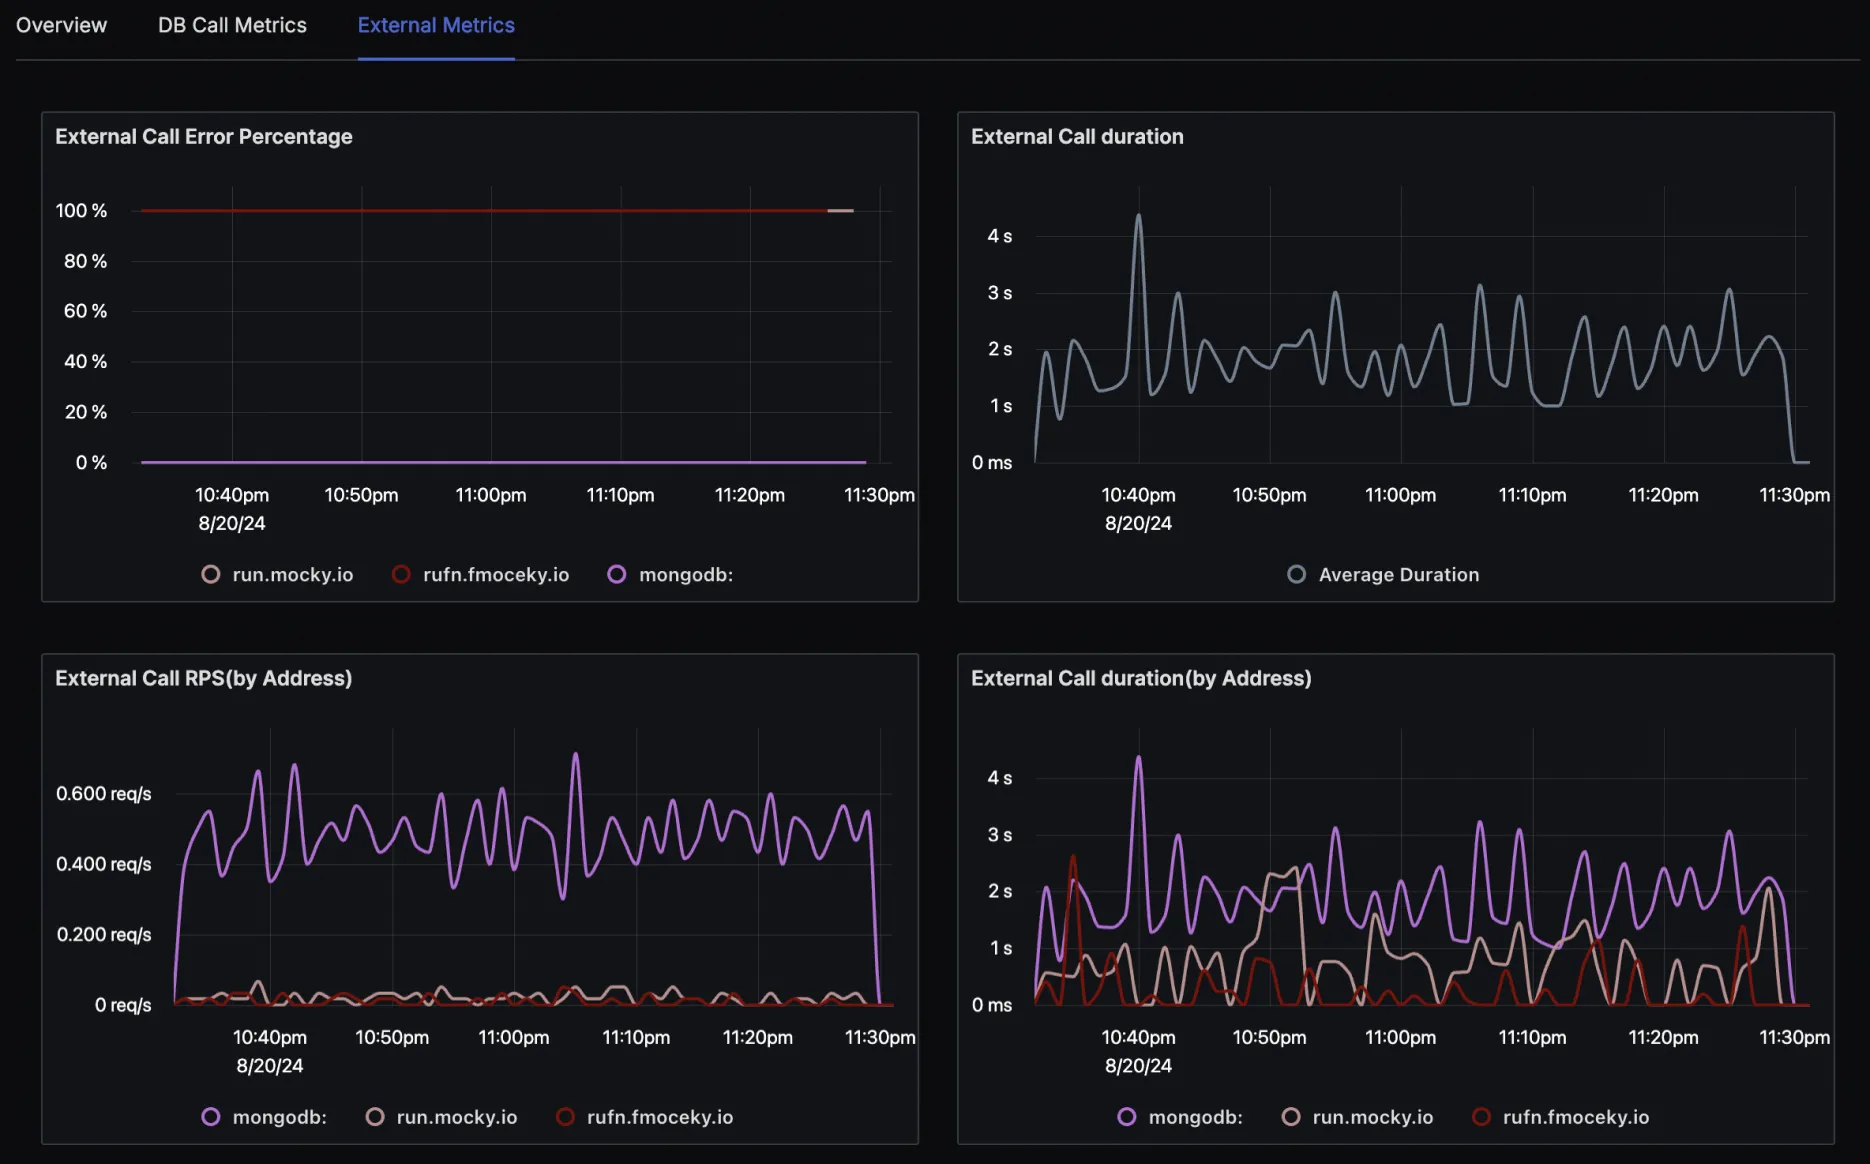
External call metrics allow you to track the external services on which your application depends. Monitor things like the percentage of external calls that resulted in errors.
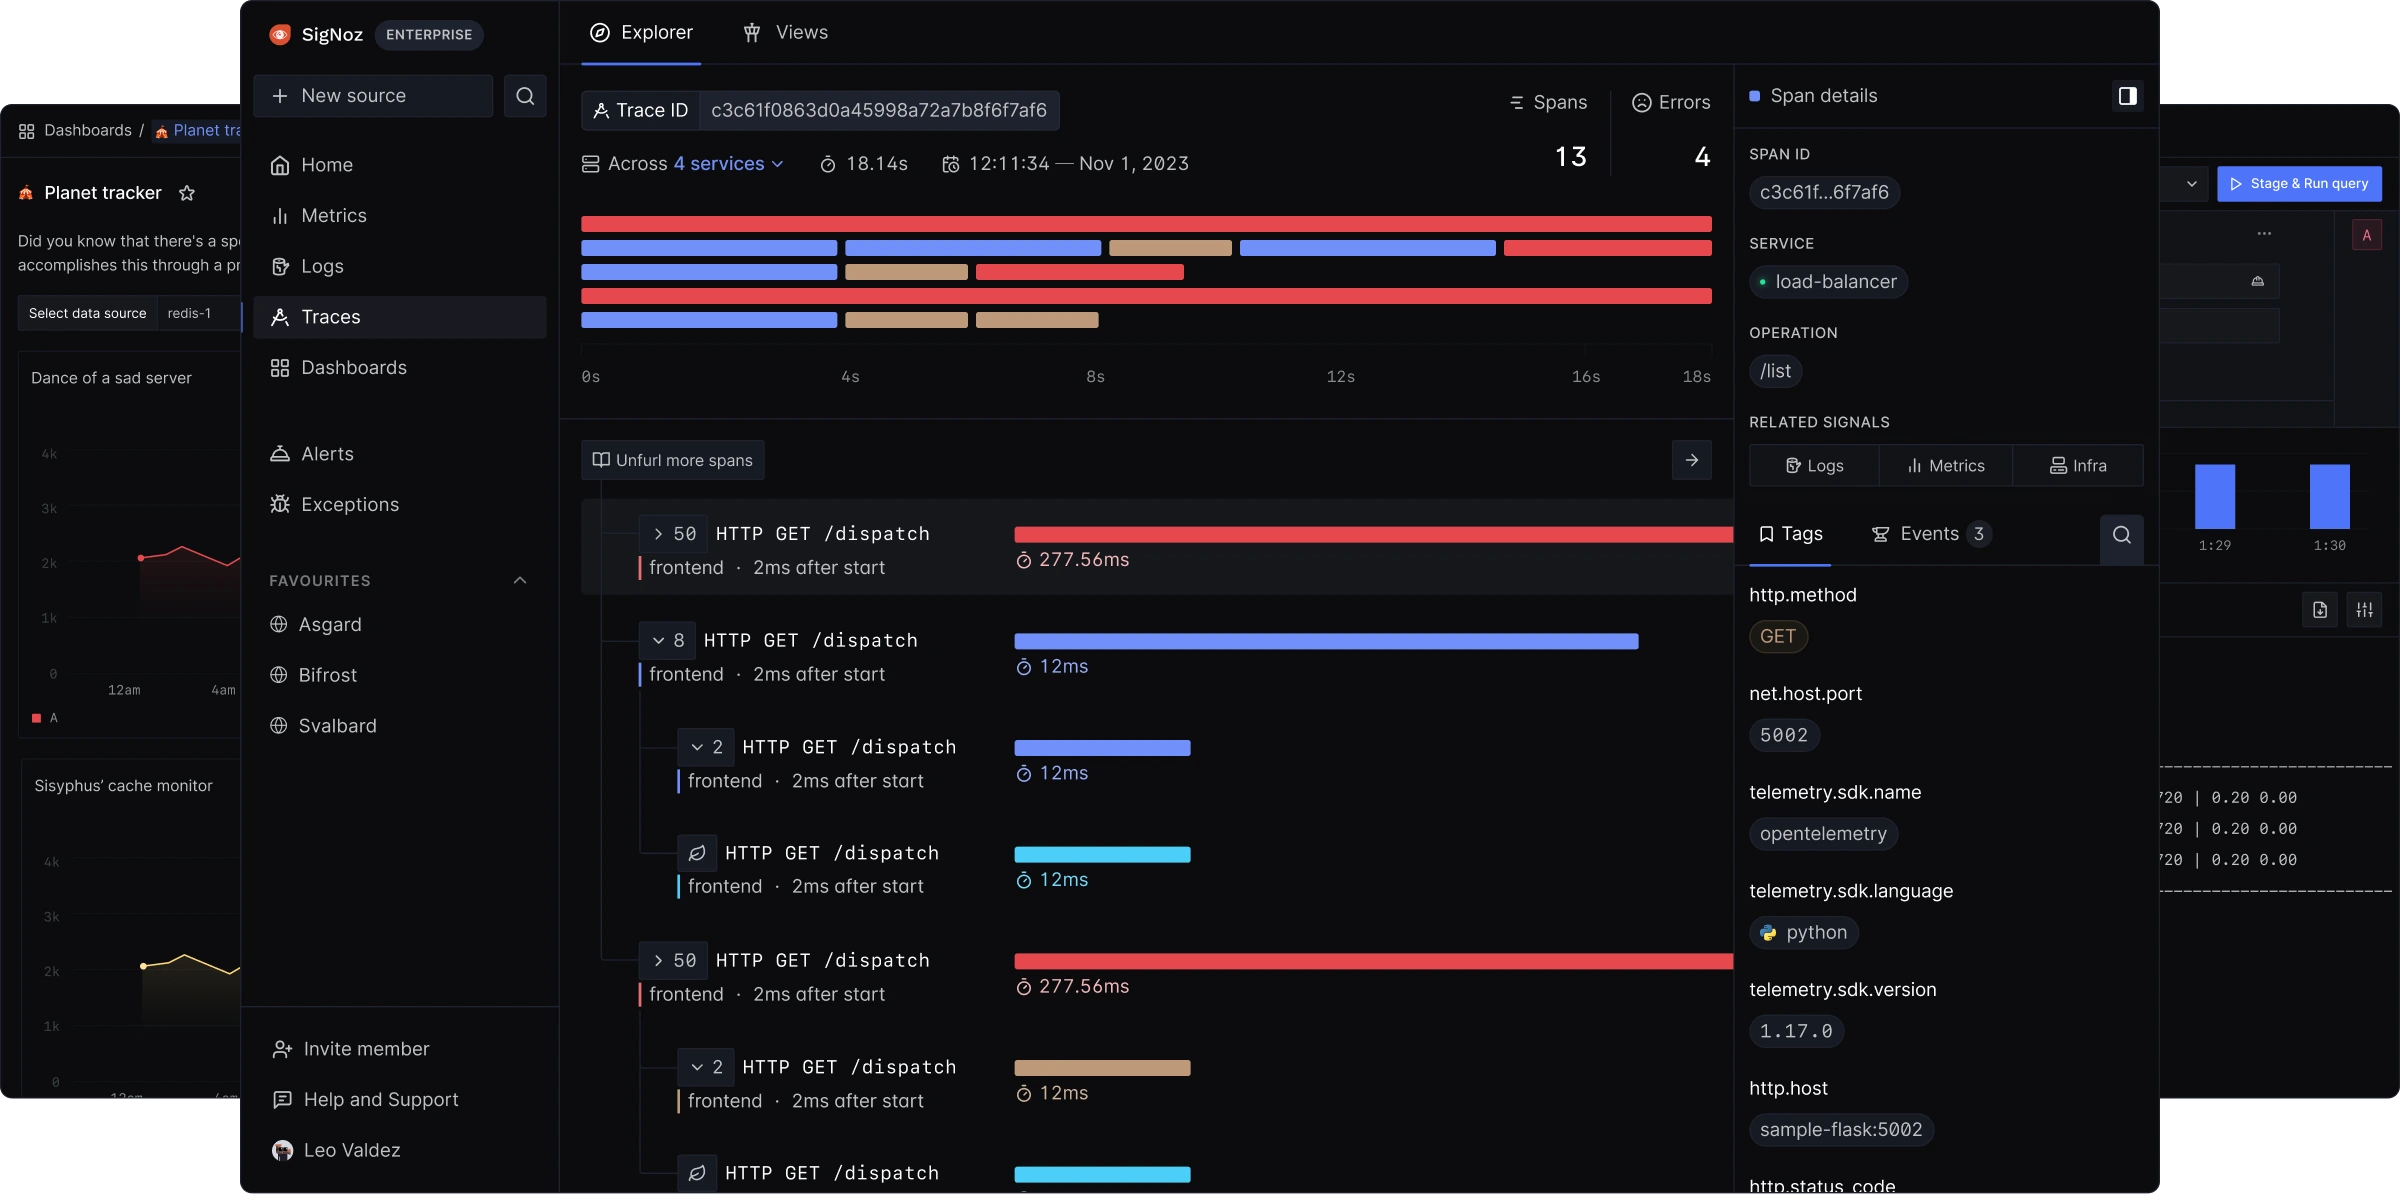
Application Metrics to Traces
SigNoz APM allows you to view your application's traces from APM charts at any time stamp. You can click on data points with high latencies to view traces around those timestamps.
Use SigNoz
APM for...
Real-Time Monitoring
Get real-time insights and alerts on application performance issues, enabling rapid response and resolution.
End-point monitoring/Transaction monitoring
Monitor top API end-points of your services for latency, number of calls, and error rate.
Database Monitoring
Monitor the performance of database queries and transactions made from your application.
External API monitoring
Track the performance and reliability of third-party APIs. Monitor the latency, error rates, and response times of external API calls.
Root Cause Analysis
Quickly identify and diagnose the root causes of performance issues and errors in applications with the ability to view traces around high latencies.
Service Dependency Mapping
Visualize service dependencies and understand how different services interact within the application architecture.
Simple
usage-based
pricing
Tired of Datadog’s unpredictable bills or New Relic’s user-based pricing?
We’re here for you.
Pay only for data you send
We don’t have any SKU-based pricing. Get access to all features in the plan selected and only pay for the data you send. Pay only $0.3 per GB of ingested traces.
Add unlimited team members
Observability should be available to every developer at your company. After all, anyone can need debugging. That’s why we don’t charge for user seats, and you can add as many team members as you want.
No Host (container or node) based pricing
For modern cloud-based applications it doesn’t make sense to charge on the basis of number of hosts or containers. You don’t need to worry about auto-scaling during peak hours. Only pay for the amount of data sent no matter the number of hosts.


Get started with
SigNoz Cloud today