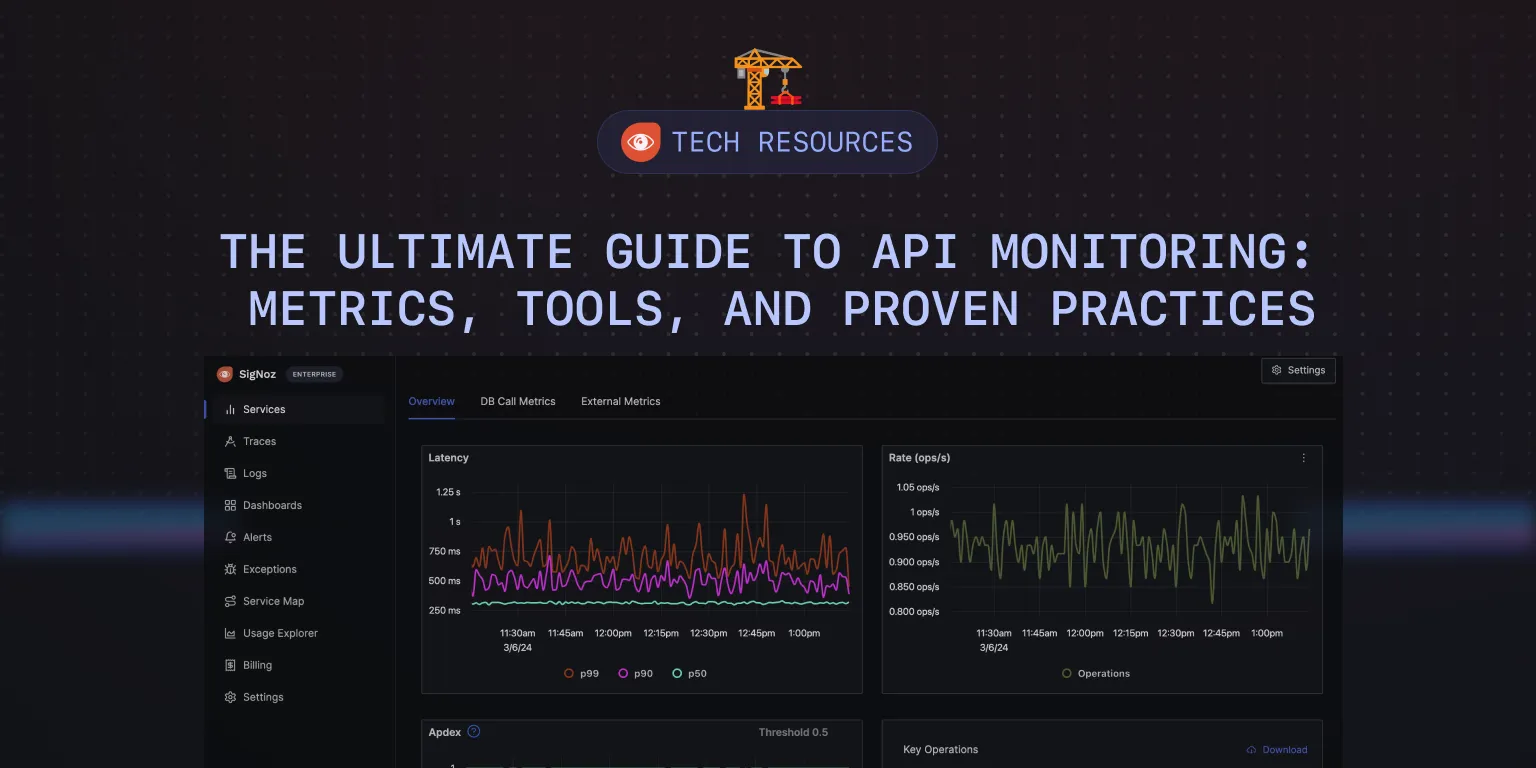
The Ultimate Guide to API Monitoring in 2026 - Metrics, Tools, and Proven Practices
According to Akamai, 83% of web traffic is through APIs. Microservices, servers, and clients constantly communicate to exchange information[1]. Even the Google search you made to reach this article involved your browser client calling Google APIs. Given APIs govern the internet, businesses rely on them heavily. API health is directly proportional to business prosperity.
This article covers everything about API monitoring, so your API infrastructure’s health is always in check ✅. We will also cover some important metrics to monitor for API health, top tools for API monitoring that you can use, best practices, and future trends.
Let’s dive in.
What is an API?
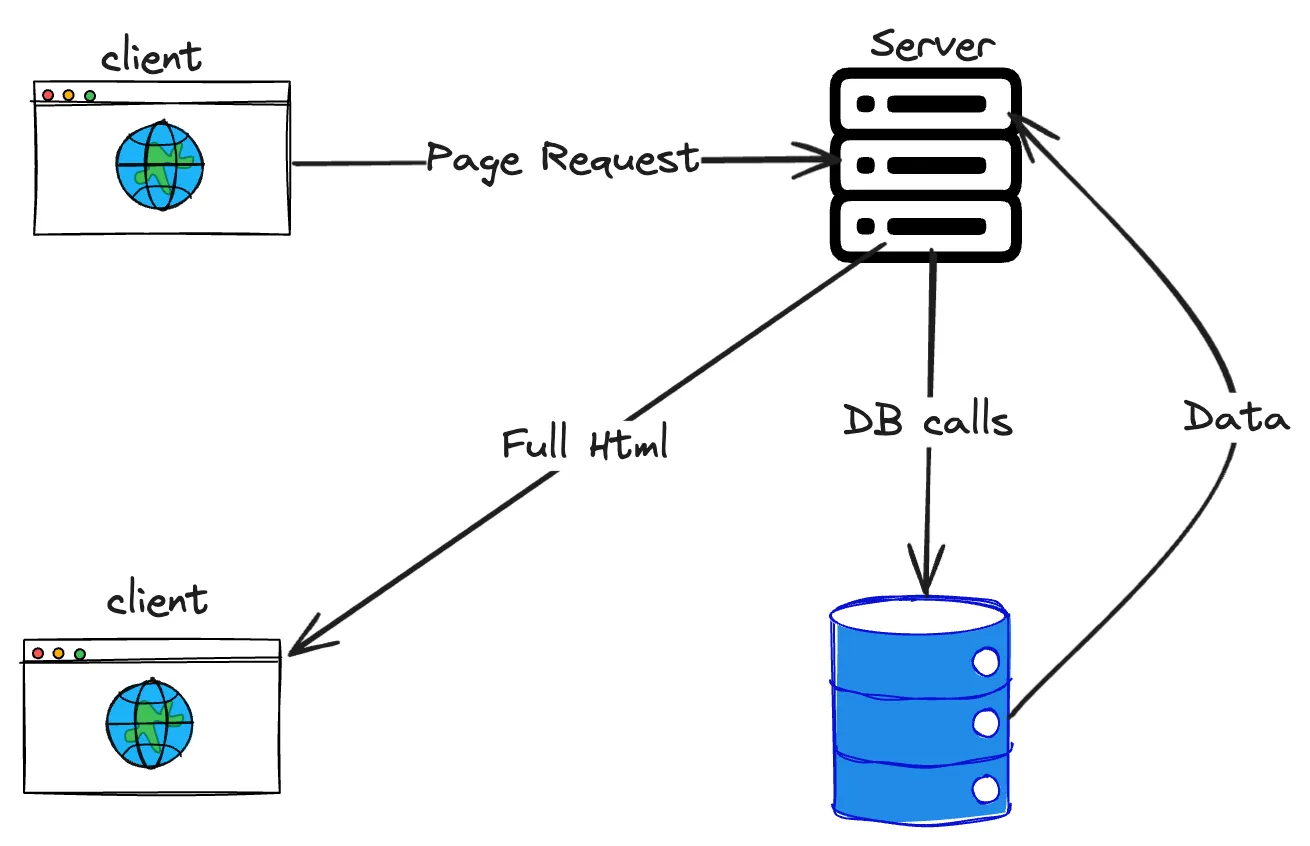
Before the evolution of JavaScript libraries, webpages were rendered using server-side rendering. When a client makes a request, the server will send a fully hydrated HTML page back to the client. Fully hydrated HTML means HTML data that is finally seen on the browser populated using the relevant information from the database. In this approach, the client and server are tightly coupled.
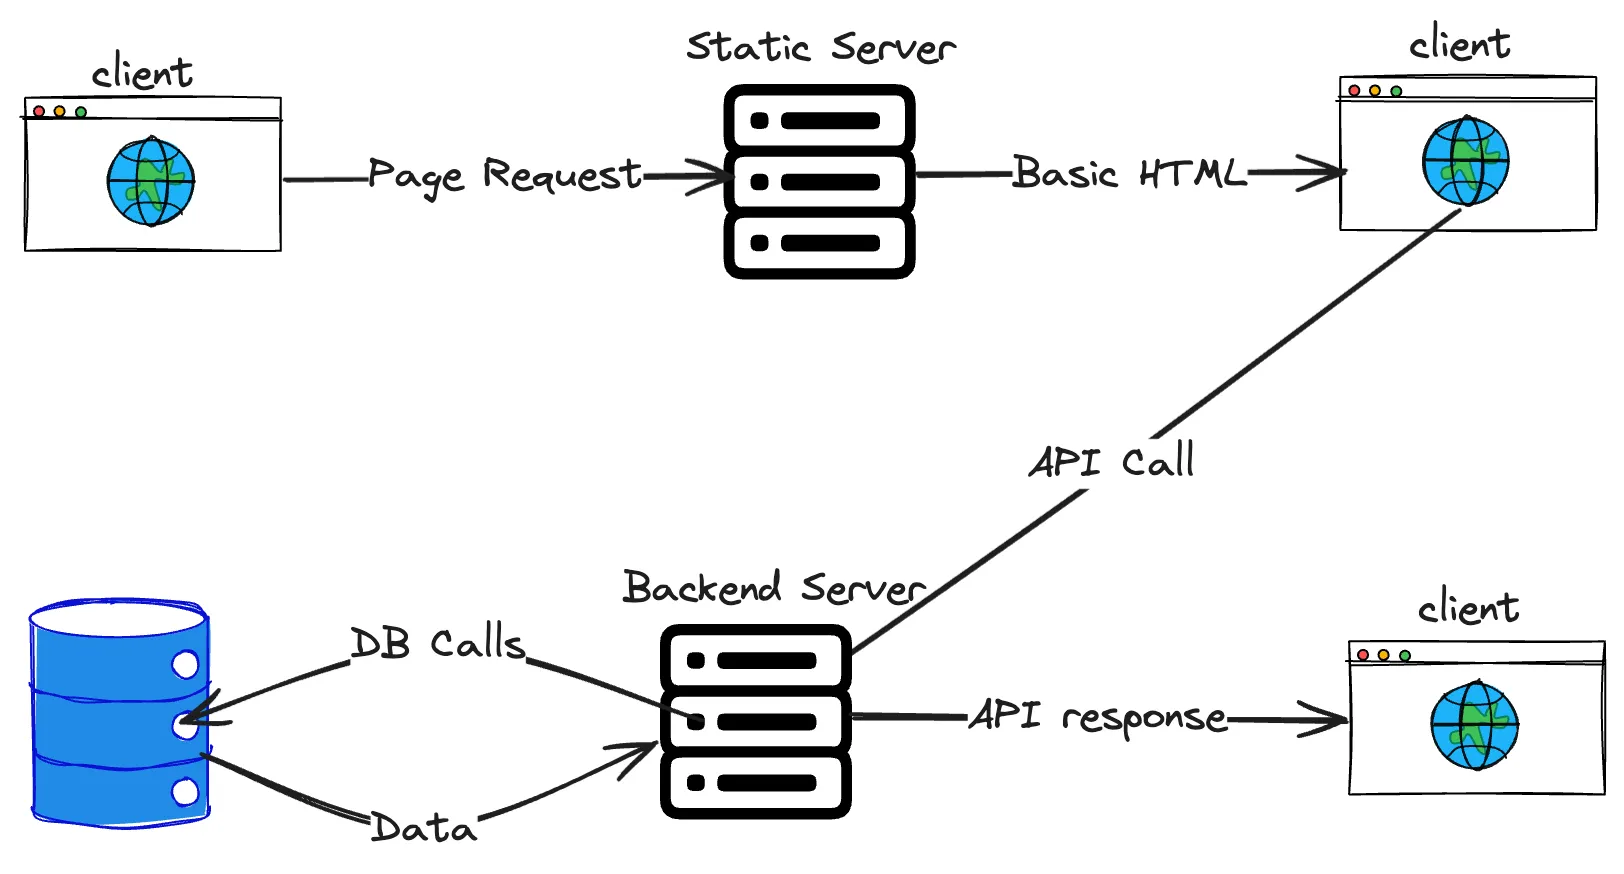
Then we have client-side rendering, which became popular recently. The client and server are independent of each other. The browser first gets the barebones HTML and JavaScript chunks to begin with. Later the client makes "API calls" to the server to fetch the data, process it, and then renders the UI.
Now one would be able to visualize where an API fits in the lifecycle of a request.
API stands for Application Programming Interface. As the acronym says, it's an interface provided by an application that other applications can integrate with. For example, Google’s backend servers expose APIs that the web client can integrate with.
Understanding API Monitoring
API monitoring is the process of continuously observing and analyzing the performance, availability, and security of application programming interfaces (APIs) to ensure they function correctly and efficiently. It involves tracking various metrics, logs, and real-time data to identify and address issues promptly, thereby maintaining optimal API health and safeguarding against potential threats or failures.
Let’s understand the different facets of API monitoring.
Monitoring for Availability
Ensuring an API's availability means checking if it is operational, capable of receiving requests, and providing the correct responses. Availability metrics determine how healthy an API is. It's vital to monitor external resources that the APIs are dependent on.
Enhancing Performance
Performance monitoring focuses on how well an API responds to requests, especially during peak traffic periods. It's not just about speed but ensuring that the API can handle the load without compromising service quality.
Maintaining Security
A healthy and performant API without security is no good. API monitoring tools can track and analyze API requests and responses in real-time. By monitoring for unusual patterns or unexpected behavior, such as a sudden increase in traffic or unusual API calls, organizations can quickly detect potential security threats or attacks, such as DDoS attacks or injection attacks.
Key Signals in API monitoring
We set up appropriate metrics that help us visualize how well an API is performing following each of the criteria. Companies usually have alerts set up on relevant metrics to detect any unexpected behaviors. For debugging, logs and traces help a lot.
Metrics
Metrics are quantitative data that measure various aspects of an API's performance and health. They serve as critical indicators, providing insights into the efficiency, availability, and security of APIs. By analyzing these metrics, companies can gauge the overall performance of their APIs and make informed decisions to enhance their functionality.
Logs
Logs are events, messages, or data points recorded during the execution of API. It involves capturing relevant information about the API, such as status, updates, errors, and warnings. API developers will find it useful while debugging any application error. Even the Infra team will use logs to diagnose any incidents.
Traces
Tracing is a technique that allows us to follow the journey of each request or transaction as it moves through a distributed system or complex software application, which may consist of interconnected microservices. This involves capturing detailed data about individual requests as they traverse various components or services within the system. By doing so, tracing offers valuable insights into the paths taken by requests and their timing, empowering developers to grasp how different elements of the system interact with each other. This visibility helps in pinpointing performance bottlenecks or issues that may arise. Tracing proves particularly beneficial in architectures employing microservices or those with multiple layers, as it facilitates comprehensive tracking and correlation of events across different system components.
Alerts
Alerting is the process of setting criteria that satisfy a condition upon which a specific action is performed. For example, an email action can be set once the CPU usage exceeds 80%. As this might eventually result in 100% and total system failure, knowing it beforehand gives the engineering team a chance to analyze and prevent failures.
With automated alerting, faster debugging using metrics, logs, and traces you can set up an efficient API monitoring. Having all of these information in a single view is a major help while preventing system failures, detect scaling issues or handle any strange patterns.
Why monitoring APIs is critical?
A ton of insights can be gathered by setting up API monitoring for different teams to track the metrics that are most useful to them. Availability and performance metrics help the development team to assess bottlenecks and build resilient software. Resource utilisation, billing alerts for DevOps & Admin team so they can take appropriate measures. RPS, Ingress and Egress bandwidth metrics allow security teams to act quick in safeguarding if they find something suspicious.
Here are a few reasons why API monitoring is critical:
-
It’s crucial for large scale systems to be monitored constantly as any failure in service request would lead to a business loss. The reputation is on the line, and failure in service could cripple it.
-
With constant monitoring and alerting, failures can be better prevented even before the issue arises.
-
Constantly monitoring APIs guarantees lower rates of failure, thereby ensuring customer retention. The reliable services has a chance to spread through word-of-mouth.
-
Monitoring APIs are helpful while debugging a service failure as well. With the help of logs, traces and metrics one can perform Root Cause Analysis(RCA) swiftly and effectively.
-
Product managers are responsible for making the API feature roadmap. By analysing trends and patterns they can make data-driven decisions about resource allocation, feature prioritisation, and product strategy.
-
Monitoring ensures API metrics are intricately connected to key performance indicators (KPIs), grounding technical achievements in business realities and driving organizational success.
-
Adoption metrics like API usage, Unique API consumers is useful for Growth/Business teams. This will help them focus on product revenue, adoption, and customer success.
Some Key Metrics for API Monitoring
Establishing a framework that clearly defines and connects API metrics with key performance indicators (KPIs) is one of the most important steps to ensure a successful API strategy.
So every organisation needs to decide on an API strategy and align their metrics with that goal on the set time frame. Each team tracks the metric that is most important to them.
Broadly there are three types of API metrics:
- Operational metrics - Purely based on the API stability, reliability, and performance.
- Adoption metrics - Data points that tell how much the end user is adopting the APIs.
- Product metrics - APIs linked to the business KPIs in accordance with the business objectives.
Operational metrics
Below are some important operation metrics for API monitoring:
-
Uptime: This is the single most important metric that determines the availability of a service. It is often tied to a service level agreement (SLA). It is calculated based on the number of minutes or hours the server is available during a selected period.
-
CPU and memory usage: Tracking resource utilization keeps us aware of when we need to scale our instances. Either vertically by adding more resources or horizontally by tweaking the throughput of each instance. It could also alert us about an anomaly that is taking up way too much CPU and memory than expected. Calculating CPU utilization involves a straightforward formula: CPU Utilization = (Total Time Spent on Non-Idle Tasks / Total Time) x 100.
-
Error Rate: Error rates, like errors per minute and error codes, can help you track down problems in individual APIs. Error codes in the 400 to 500 range can indicate problematic APIs or web service providers. It is calculated in error requests that occur per minute.
-
Requests per minute/second(RPM/RPS): Requests per minute tracks the number of incoming requests per minute. It describes the API traffic that is being received across the selected times. This is a vital metric to understand the load that is being put up on the system. The metric will also expose how well the API is scaling on increased load.
-
Response time(Latency): The total turnaround time taken since the origination of the request until the response is received by the client. Latency tells us how slow/fast the API services are responding. It is crucial for large companies to keep their latency as low as possible, or else the user experience will get deteriorated.
-
Throttling: When the network gets congested the server no longer accepts anymore new incoming requests. All new requests will be throttled, meaning they will go unhandled. This is due to the fact that the server does not have the additional concurrent bandwidth to process. It is measured in RPS, Requests per second that got throttled.
Adoption Metrics
-
Unique API consumers: Based on the time range selected, the metric measures the count of unique consumers who are using the API service. It is calculated in number of consumers. Commonly used time-ranges are DAU(Daily Active User) , MAU(Monthly Active User). These could be very helpful in understanding the user adoption of the service.
-
API usage growth: Very similar to tracking API consumers, the growth metric tracks the increase/decrease in the volume of API consumption in a given time frame.
-
Time to First Call: This metric measures how long it takes a developer to create an account, generate API credentials, and run the first API call. Enabling developers to get up and running as fast as possible is a high priority, making this metric the most important for measuring the overall API developer experience.
Product Metrics
-
Revenue: The total revenue including direct and indirect sources make up this metric. While some APIs are directly monetized, others generate revenue through third-party integrations.
-
API Usage: API consumption is grouped for each API, allowing identification of the most used or least used APIs.
-
User usage breakdown: This metric contains a user-wise breakdown of their API usage, helping offer better services/support to them.
Aligning API metrics and business KPIs is one of the principal ways to make data‑driven decisions and ensure your API strategy delivers the value your organization requires. Not only that – gaining visibility into your APIs can also empower infrastructure and application teams to measure the operational metrics that matter most to them.
Top API Monitoring Tools
Here’s a list of 5 API monitoring tools that you can use:
Signoz
Signoz is a full-stack open-source APM (Application Performance Monitoring) that can be used for effective API monitoring. It is built to support OpenTelemetry natively, which is an open-source project under the Cloud Native Computing Foundation becoming a world standard for instrumenting cloud-native applications. Signoz can be used to monitor metrics for API performance and is well-suited for monitoring APIs in applications based on microservices or serverless architecture.
Prometheus
Prometheus is an open-source metrics monitoring tool initially developed at SoundCloud in 2012 before being released as an open-source project. It was accepted into the Cloud Native Computing Foundation in 2016 and was the second project to graduate from the foundation, following Kubernetes.
You can use Prometheus to monitor your REST APIs. It is a good tool for monitoring any kind of time-series data, such as requests per second on an endpoint.
Graphite
Graphite is an open-source monitoring tool focused on storing time-series data. It has three main components: Carbon, Whisper, and Graphite. Carbon listens for time-series data, Whisper stores the time-series data, and Graphite web renders graphs.
Graphite’s UI may not be great, but it provides integration with Grafana to build better charts for visualization.
Datadog
Datadog Synthetic Monitoring allows you to create code-free tests that actively simulate user transactions on your applications and monitor key network endpoints across various layers of your systems. It detects user-facing issues with API and browser tests and jump-starts system-wide investigations to optimize performance and enhance end-user experience.
New Relic
New Relic is an application monitoring enterprise tool that provides solutions from application monitoring and infrastructure monitoring to log management.
New Relic Synthetics feature improves build quality by simulating traffic across thousands of public and private locations to proactively detect and resolve issues. It also provides alerts on API performance.

What should a good tool offer?
-
Alerting: Ability to alert when the API check fails to minimize alert fatigue and reduce false positives. Support for multiple alert strategies based on run count, time range, etc.
-
Ability to analyze response data: For effective API monitoring, it's essential to extend alert capabilities beyond simple connectivity or HTTP errors to include customizable criteria based on response headers and body content. This entails the ability to identify specific header names/values and parse standard formats like JSON to verify the correctness of field values against expected results. Such precision in monitoring allows for targeted validation of both API availability and data integrity, catering to the nuanced needs of a technical audience.
-
Response timing metrics: When monitoring an API's performance, it is crucial to dissect the overall response time into its constituent elements: DNS resolution, connection establishment, SSL/TLS negotiation, Time To First Byte (TTFB), and the data transfer phase. This granular analysis not only sheds light on the total time taken by the API to respond but also helps in pinpointing the specific segments where bottlenecks might occur. For instance, a prolonged TTFB suggests inefficiencies within the server or backend processing, whereas an extended DNS resolution time could indicate issues with the DNS service provider.
-
Pricing: The pricing model should be transparent and easy to understand, with no hidden costs.
-
Intuitive UI/UX: Beyond its extensive feature set, the tool must boast an intuitive and user-friendly UI/UX. This ensures easy navigation and understanding of functionalities.
Best Practices for API Monitoring
Some of the best practices when it comes to API monitoring are:
- Testing across multiple locations of users
- multiple time slots for activity awareness
- Define Clear Objectives: Define specific objectives and key performance indicators aligned with business goals, and update these objectives as business goals change.
- Logging and Auditing: Maintain detailed logs for auditing, compliance, and post-incident analysis.
- Integration with DevOps: Integrate API monitoring into DevOps processes for continuous testing and early issue detection.
Conclusion
In conclusion, establishing a service status website and utilizing robust API monitoring tools are essential components for ensuring the reliability and performance of your services. By implementing best practices, such as thorough testing, clear objective setting, and seamless integration with DevOps processes, companies can proactively detect issues, optimize performance, and enhance the end-user experience.
Remember, choosing a tool that offers alerting capabilities, response data inspection, response timing metrics, transparent pricing, and an intuitive UI/UX is crucial for effective API monitoring. Embracing these practices and leveraging the right tools will not only help maintain service availability but also drive continuous improvement in service delivery. Stay proactive, stay observant, and empower your organization with the right tools for successful API monitoring.
Getting Started with SigNoz
SigNoz Cloud is the easiest way to run SigNoz. Sign up for a free account and get 30 days of unlimited access to all features.

You can also install and self-host SigNoz yourself since it is open-source. With 24,000+ GitHub stars, open-source SigNoz is loved by developers. Find the instructions to self-host SigNoz.
Further Reading
