SigNoz - Open-source alternative to AppDynamics
If you're looking for an open-source alternative to AppDynamics, then you're at the right place. SigNoz is a perfect open-source alternative to AppDynamics. SigNoz provides a unified UI for metrics, traces and logs with advanced tagging and filtering capabilities.

In today's digital economy, more and more companies are shifting to cloud-native and microservice architecture to support global scale and distributed teams. But distributed systems also make it impossible for engineering teams to track how user requests perform across services. Application performance monitoring tools provide the visibility needed to resolve performance issues quickly.
AppDynamics is a great SaaS tool when it comes to application performance monitoring. But there are a few challenges when it comes to enterprise SaaS products, and it's just not a great fit for every company.
Some of the challenges with tools like Appdynamics includes:
-
Vendor lock-in
AppDynamics provides agents and controllers to collect data from your application. It is not built to natively support open-source standards. It's difficult to migrate or use different tools in such a scenario. -
Product roadmap dependency
For any small feature, you are dependent on their roadmap. We think this is an unnecessary restriction for a product which developers use. A product used by developers should be extendible. -
Costly and non-reliable pricing
Pricing plans of enterprise tools can sometimes leave you in a lurch with frequent changes.
A relatively newer concept in the field of application performance monitoring is observability. Making a system observable is the pursuit of achieving a state of proactiveness to solve unknown issues. Logs, metrics, and traces are usually considered the three pillars of observability.
Some of the key features of good observability tools are:
- Metrics, traces, and logs under a single pane of glass
- Out of the box application metrics
- Way to go from metrics to traces to find why some issues are happening
- Seamless flow between metrics, traces & logs — the three pillars of observability
- Filtering of traces based on different tags and filters
- Ability to set dynamic thresholds for alerts
- Transparency in pricing

Why choose an open source alternative to AppDynamics?
APM and observability tools are critical tools in a developer's kit. These tools improve developer efficiency, save bandwidth by resolving issues quickly, and increase developer productivity.
An open source product is always a better choice for any developer tool. Some of the key advantages of open-source developer tools are:
-
Open codebase
Developers can judge the quality of the code of the tool they want to choose and work with. -
Extensibility
If an extra feature or customization is required, developers can build on top of the open-source tool without waiting for the enterprise support team to include their request in the next product cycle. -
Community support
One of the best parts about open-source projects is the community. An example is OpenTelemetry, which is becoming the world standard for generating and managing telemetry data in distributed systems. -
Transparency
With open-source projects, you know what you're dealing with. There is no black box. -
On-prem installation
If your data privacy policies are stringent, you can use open-source tools within your infra with no fear of breaching data privacy laws like GDPR.
But most open-source projects don't provide a great user experience as SaaS products do. It takes a lot of time and effort to get them working, figuring out the long-term storage, etc.
And that's where SigNoz shines. It is very simple to get started, supports multiple tech-stack, and comes with a SaaS-like web user experience.
Key Features of SigNoz
Some of our key features which makes SigNoz vastly superior to current open-source products and a great alternative to AppDynamics are:
- Metrics, traces, and logs under a single pane of glass
- Correlation of telemetry signals
- Out of the box application metrics
- Seamless flow between metrics & traces
- Filtering based on tags
- Custom aggregates on filtered traces
- Detailed Flamegraphs & Gantt charts
- Infrastructure dashboards
- Exceptions monitoring
- Transparent usage Data
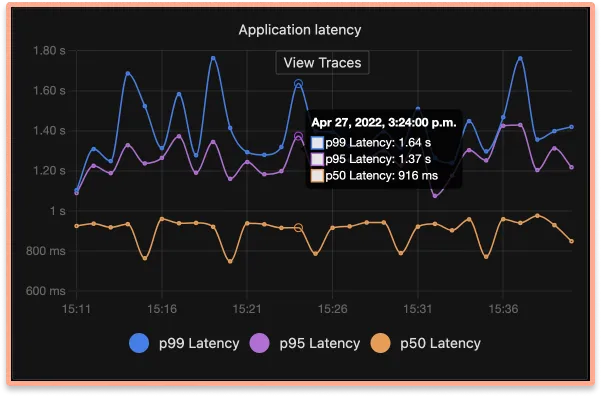
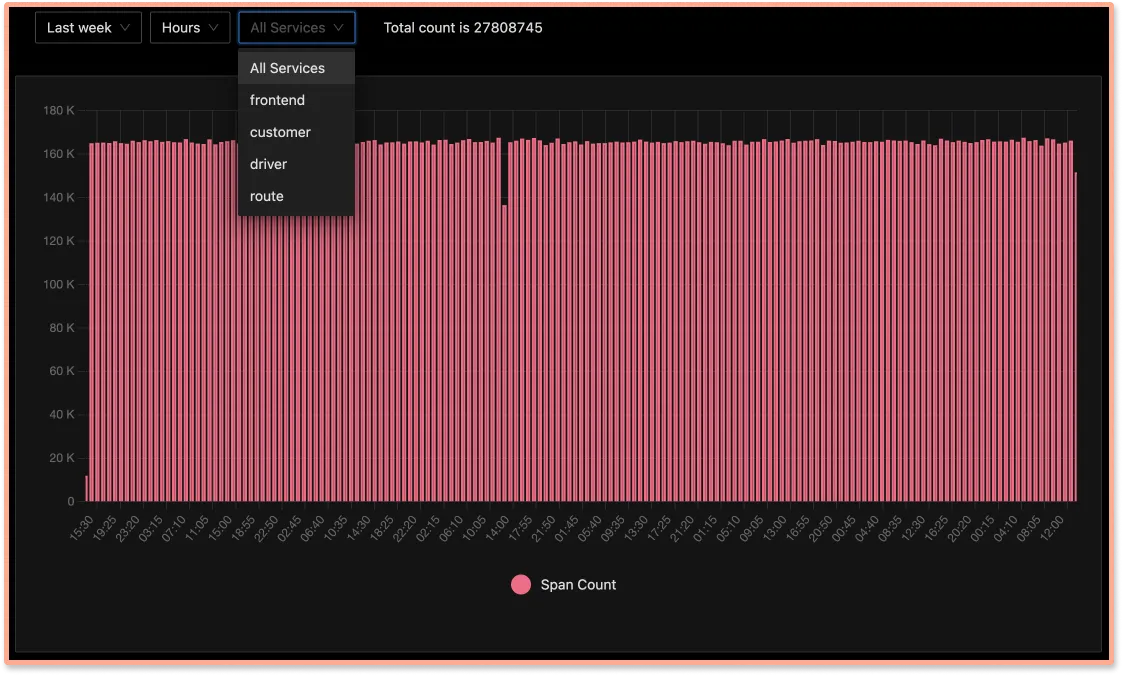
Application metrics
Get p90, p99 latencies, RPS, Error rates, and top endpoints for a service out of the box.

Seamless flow between metrics & traces
Found something suspicious in a metric, just click that point in the graph & get details of traces that may be causing the issues. Seamless, Intuitive.
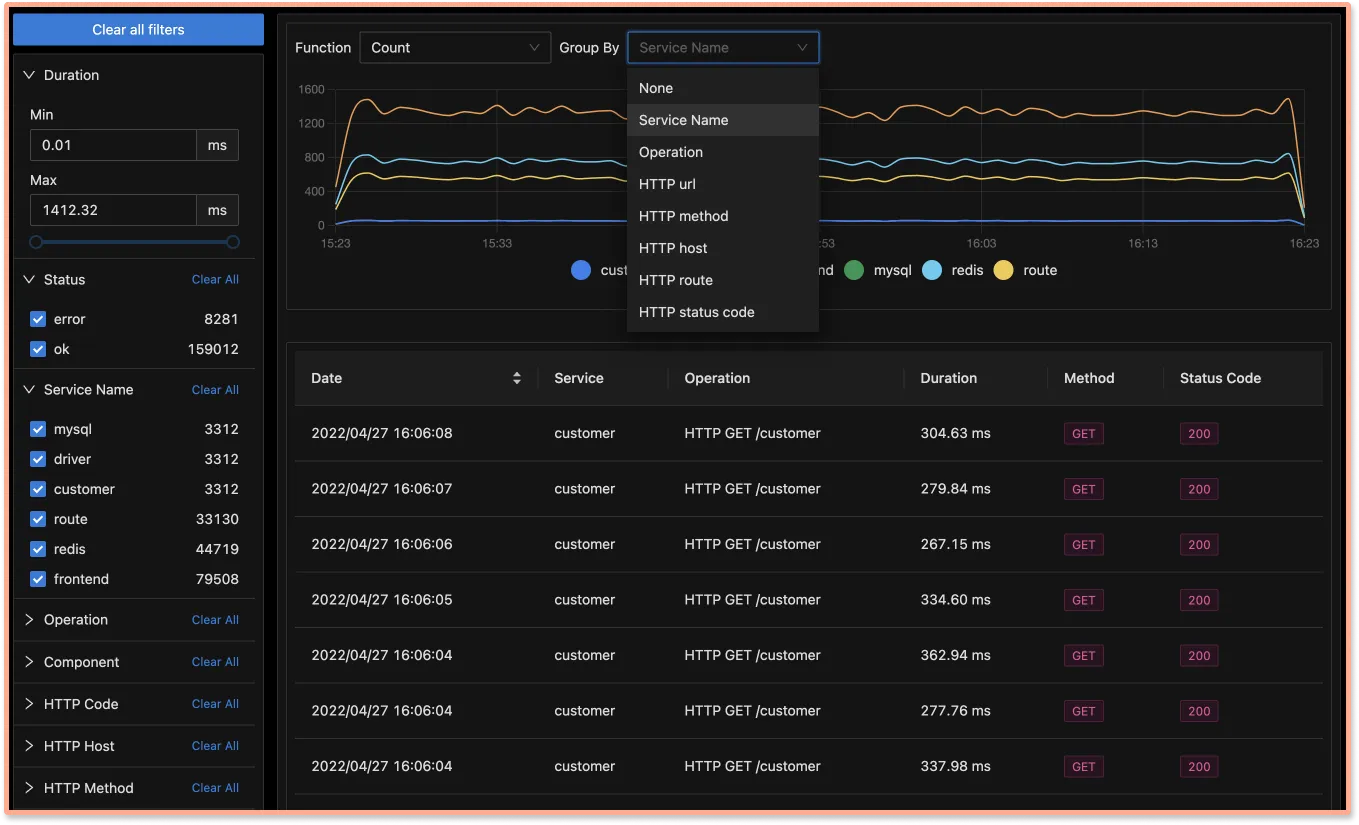
Advanced filters on trace data
Under our traces tab, you can analyze the traces data using filters based on tags, status codes, service names, operation, etc.
Using tags, you can find latency experienced by customers who have customer_type set as premium.
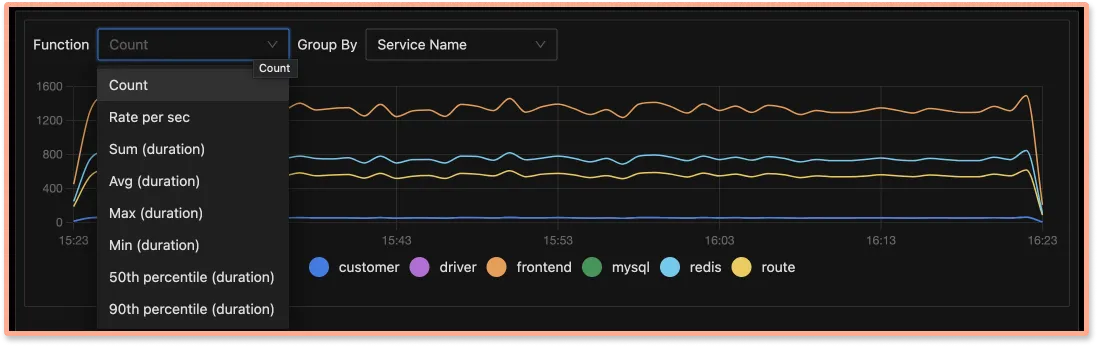
Custom aggregates
Create custom metrics from filtered traces to find metrics of any type of request. Want to find p99 latency of customer_type: premium who are seeing status_code:400. Just set the filters, and you have the graph.
Flamegraphs & Gantt charts
Detailed flamegraph & Gantt charts to find the exact cause of the issue and which underlying requests are causing the problem. Is it a SQL query gone rogue or a Redis operation is causing an issue?

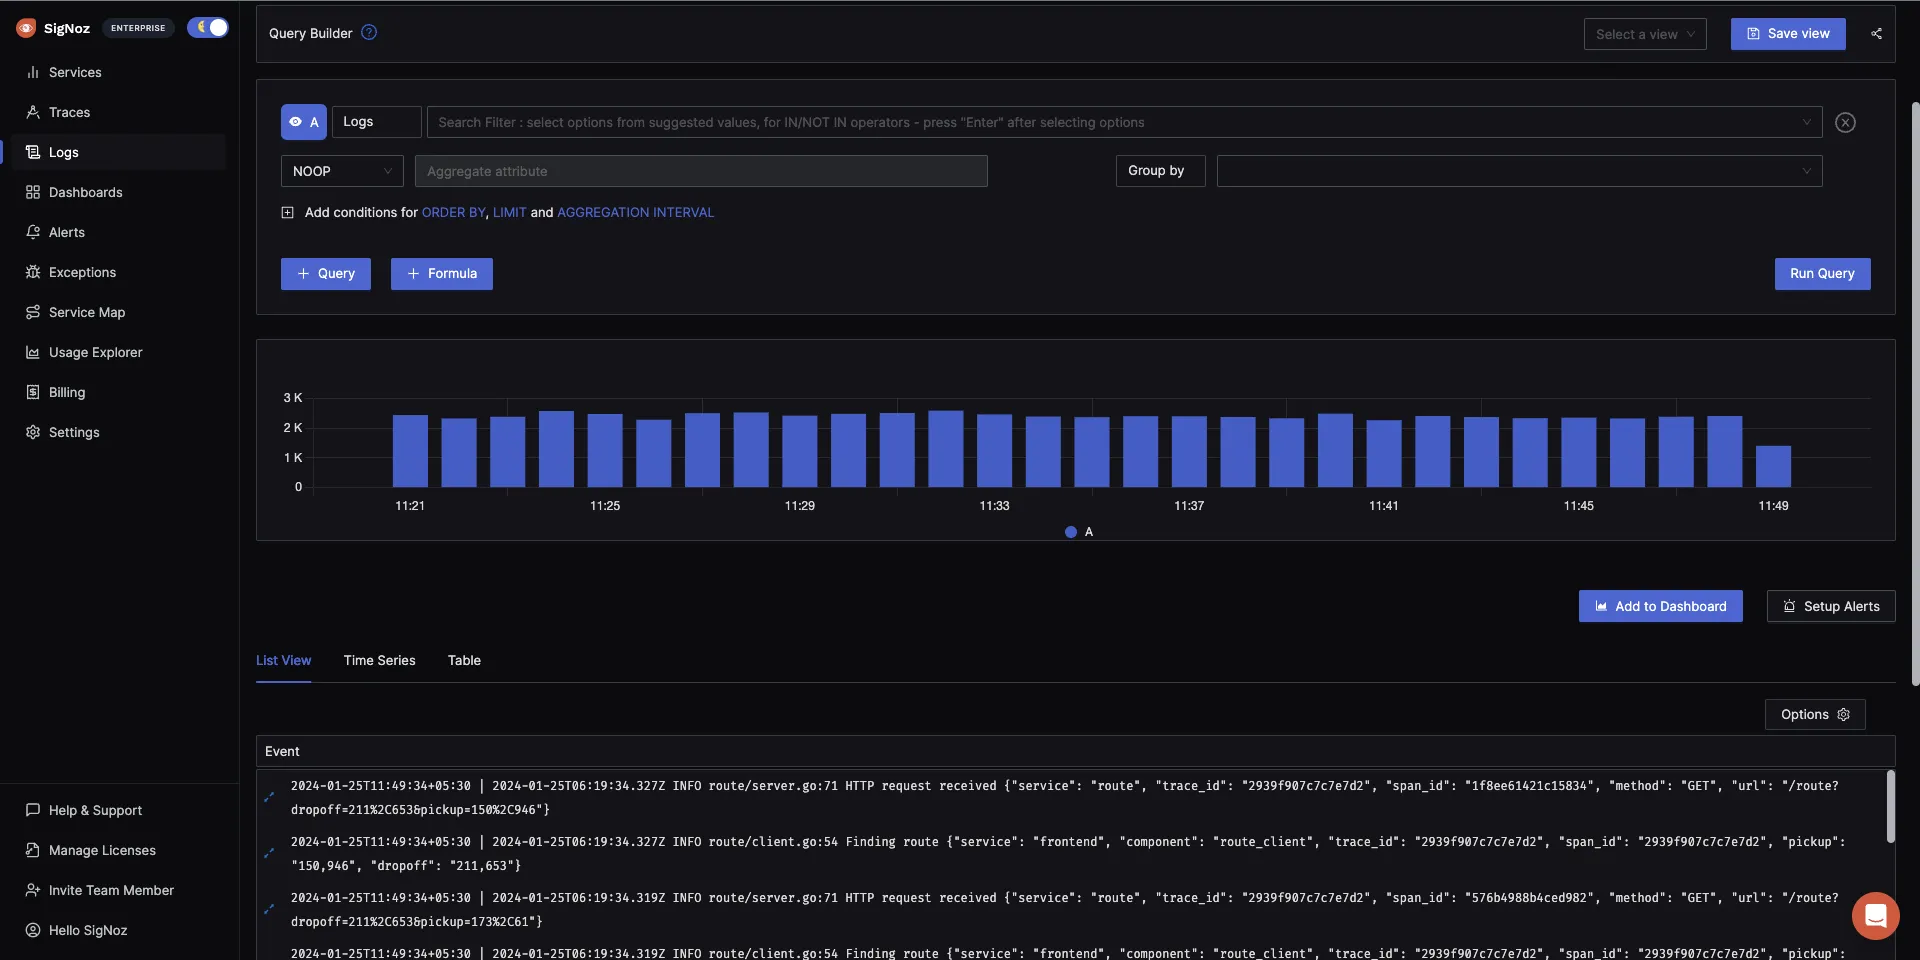
Logs Management
SigNoz provides Logs management with advanced log query builder. You can also monitor your logs in real-time using live tailing.
Transparent usage Data
You can drill down details of how many events is each application sending or at what granularity so that you can adjust your sampling rate as needed and not get a shock at the end of the month (case with SaaS vendors many times)
Native OpenTelemetry support
SigNoz is built to support OpenTelemetry natively. OpenTelemetry is becoming the world standard when it comes to generating and managing telemetry data(logs, metrics, and traces).
Some of the key advantages of using OpenTelemetry are:
- Reduces performance overhead on your application to generate and manage telemetry data
- Supports multiple popular programming languages like Java, Javascript, C++, Go, Python, etc.
- Provides libraries and agents to auto-instrument popular libraries and frameworks requiring minimal changes to your codebase
- Backed by technology giants like Google, Microsoft, and other big cloud vendors.
- No vendor lock-in. Freedom to switch to new backend analysis tools by using relevant exporters
Getting started with SigNoz
SigNoz Cloud is the easiest way to run SigNoz. Sign up for a free account and get 30 days of unlimited access to all features.

You can also install and self-host SigNoz yourself since it is open-source. With 24,000+ GitHub stars, open-source SigNoz is loved by developers. Find the instructions to self-host SigNoz.
Related Content
DataDog Alternative
New Relic Alternative
Dynatrace Alternative
