Metrics Dashboard, Scale testing upto 500K events/sec - Signal 05
A month and thousands of code lines later, we're here with our monthly product update - Signal #05. We squashed bugs, shipped custom metric dashboard along with improvisations in our frontend.
We also got featured by one of the top online analytics magazines as one of the leading Data Observability platforms. 🥳
Let's dive in to see what humans at SigNoz have been up to!
What we shipped?
We have made two big releases this month:
Release v0.4.0
LINK - Release v0.4.0
We shipped metrics ingestion through SigNoz after testing it out for corner cases. But, truth be told, we are expecting our community to find out more bugs so that we can squash them 🐞.
How does metrics ingestion in SigNoz works?
- Exporter in OTel to write to ClickHouse(our supported database)
- Supports promQL(Prometheus Query Language)
Use-cases enabled
- Infrastructure and cluster monitoring
- OpenTelemetry receivers of different components like Redis, Nginx, etc.
- Custom metrics (from the application) using Otel SDKs
- Prometheus config for metrics scraping
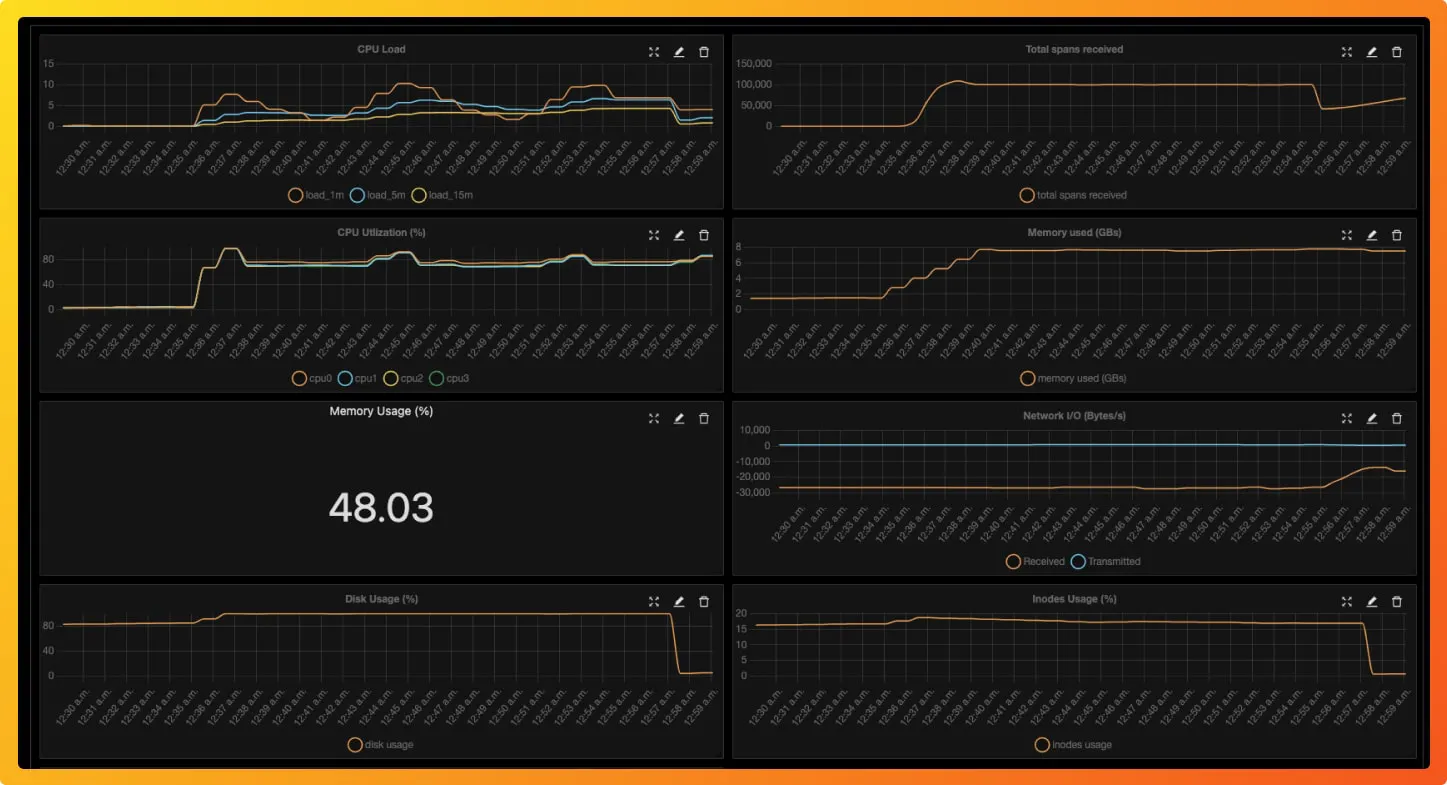
A snapshot of metrics dashboard built by a user 👇
Release v0.4.1
LINK - Release v0.4.1
SigNoz can now scale up in Docker swarm. The community requested this, and we are glad to support it. Currently, we have tested out SigNoz for up to 500k events per second, and we are working to continue improving SigNoz for handling scale.
Deploy SigNoz with Docker Swarm documentation
We also shipped lots of improvements in our web UI with a focus on the metrics dashboard. We are working towards a great user experience when it comes to our web UI. Users can do things like saving widget layouts. We will work on more customization in the coming sprints.
We also optimized our Light and Dark theme. (Secret: We are all biased towards the Dark theme 🙈).
Featured Issue
Anomaly Detection with SigNoz
Anomaly Detection can be a great feature for an APM tool. A community member has suggested incorporating anomaly detection in SigNoz by integrating open-source anomaly detection libraries.
If you have worked with anomaly detection frameworks and libraries, we would love to hear your thoughts on this.
What's upcoming?
Out of box dashboards for infra metrics
Custom metrics dashboarding has increased the scope of SigNoz as a monitoring tool manifolds. At the same time, we are also aware of the need to get started as quickly as possible. We will be working on enabling some out-of-box dashboards for infrastructure metrics.
Currently, we will support infra metrics dashboard for VMs, Kubernetes, and Docker. We would love to get some feedback on this feature. If you are interested in testing these dashboards out or have ideas on what more charts should be enabled out of the box, feel free to write to us at hello@signoz.io.
Alerts for metrics
We have mentioned earlier about alert manager in our product roadmap. Kicking off this critical feature, we will be working on alerts for metrics to enable notifications for critical issues to our users.
SigNoz News
September community call 🔈
In our monthly community call, Ankit Nayan gave a hands-on demo of custom metrics monitoring with SigNoz. We also discussed SigNoz scale performance and UI accessibility for dashboards.
You can find the full recordings of the call here 👇
Features 📸
Data pipelines are complex systems that require observability to understand why processes fail. We got featured as one of the top Data Observability platforms by Analytics India Magazine. 🎉
SigNoz at Hacktoberfest 🧑💻
October is the month of celebrating the open-source ecosystem. If you make four approved PRs in opted-in projects between October 1-31 in any time zone, you will be eligible to get some cool swag along with the recognition that comes with it.
As a open-source project, we are excited to take part in Hacktoberfest 🎉 Find some good first issues to submit PRs. Get hacking now!
From our blog
OpenTelemetry Collector
SigNoz is built to natively support OpenTelemetry. OpenTelemetry is a set of APIs, SDKs, libraries, and integrations that aims to standardize the generation, collection, and management of telemetry data(logs, metrics, and traces). Advantages of using OpenTelemetry inlcudes:
- Reduces performance overhead on application to manage telemetry data
- Vendor-neutral
- Supports multiple programming languages
We aim to educate our community about OpenTelemetry. One of the critical components of the OpenTelemetry architecture is the OpenTelemetry collector.
OpenTelemetry collector has three main functions: collect, process, and export the telemetry data collected.
Here's a complete architecture and configuration guide on OpenTelemetry collectors:
OpenTelemetry Collector - architecture and configuration guide
Custom metrics monitoring with SigNoz
Learn how to monitor custom metrics of your Nodejs application with OpenTelemetry and SigNoz 👇
Thank you for taking out the time to read this issue If you have any feedback or want any changes with the format, please create an issue.
