Crossed 5000+ GitHub stars, metrics generation from spans - SigNal 06
Welcome back to SigNal #6. Every month, SigNal from SigNoz gives you an update on what we've been building, shipping, and iterating. In the midst of sprint plannings, feature releases, and bug fixes, time just flew by, and here we are, with another monthly product update!
Also, we crossed 5000+ GitHub stars this month 🚀😎
Let's dive in to see what humans of SigNoz have been up to in October.
What we shipped?
We made two major releases last month:
Some of the key highlights of our product releases include the following:
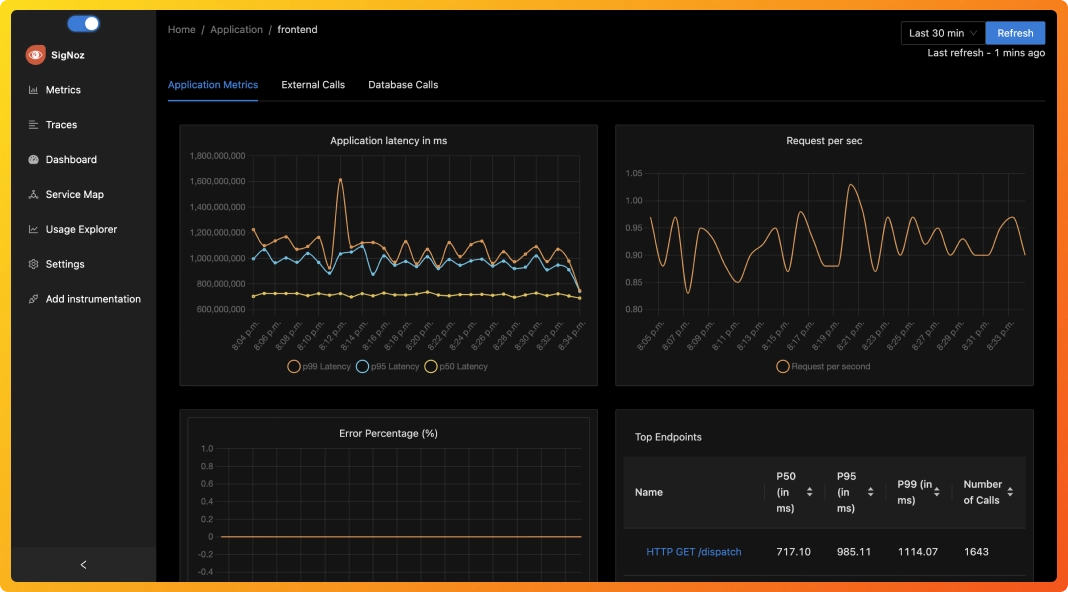
Generating metrics from spans
Our metrics dashboard reported metrics generated from trace data. At scale, crunching metrics from trace data can cause latency in reporting. In this release, we have upgraded our dashboard to report metrics from span data which can handle reporting metrics at scale (~1 mn events per second).
Cypress test cases
Test cases are an integral part of shipping robust code. We shipped Cypress test cases to make our front-end code more robust.
Refactored pages
We also refactored a major chunk of our front-end code to handle better scale and give our users a great user experience.
Featured issue
Handling specific use-cases with OpenTelemetry auto-instrumentation
This is a good issue raised by a user from the SigNoz community on handling the instrumentation of background tasks. The use-case is to trace a background task that runs periodically and calls a number of functions down the line. More functions can be added later, depending on the requirements.
The current way to add spans for methods requires annotation. Can it be easier to enable an option that lets users specify how spans can be added to trace while creating a trace?
What's upcoming?
Our team is focused on working on alerts in the upcoming sprints. It's taking more time than we anticipated. It's taking more time than we anticipated as we want to build it right. Alerts are a critical component of our observability stack, and we will be launching the v1 this month.
Our users also wanted to set the retention period of their collected telemetry data from the UI itself. So we are working on a settings page for managing the retention period.
SigNoz news
Contributors and community
We got eight new contributors this month, and they tackled some good issues for SigNoz. We are always grateful to developers who believe in the open-source ecosystem! 🥳🚀
Highlighting some key PRs by our awesome contributors:
-
Feat(FE): Add Sonar analysis to build pipeline #324 by Adam Szatyin
-
Added GET/SET endpoint for setting ttl for clickhouse #304 by Yash Sharma
We also crossed 300+ members on our slack community.🥳
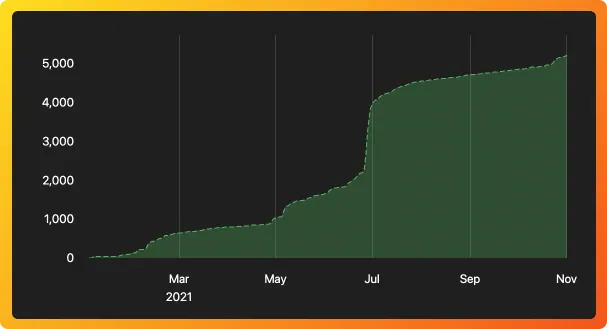
Crossed 5000+ GitHub stars
This month, we crossed 5000+ stars on GitHub 🚀 🎉 It's been an incredible journey since we started out to build the best open-source APM tool, and we couldn't have anticipated such developer interest in such a short time in our wildest dreams 🥳
Features
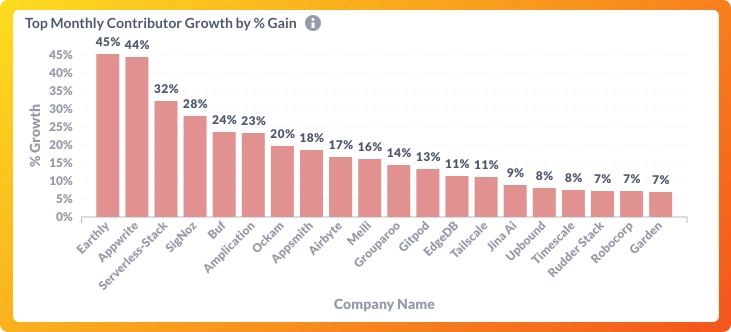
Top project by contributor growth
We got featured in Julia Schottenstein's list of top 10 open source projects by contributor growth. We are grateful to the developer community for their continued support and interest in our open-source project! 🤗
Our focus remains to make observability more accessible with open-source.
Observability Trends 2021
We also got featured in Observability Trends 2021, written by Saiyam Pathak. In his article, Saiyam talks about the upcoming trends in the observability domain.
Learn
Excited to share that we are working on a new initiative to help our community learn more about DevOps and specifically about the observability & monitoring domain. Few ideas that we have in mind, and would love to implement:
- A curation of common issues faced by users when starting out with OpenTelemetry(open-source instrumentation standard)
- List of tools to supercharge your K8s workflow
We would love to know how else we can help you learn more. Let us know what topics you find interesting or challenging around DevOps and observability. You can reach out at ankit.anand@signoz.io 🙌
As our first initiative, we have launched observability user stories.
Observability user stories
We have curated 30+ articles from top engineering blogs of companies like Netflix, Uber, Github, Lyft, Grab, and many more of how their engineering teams are pioneering observability and monitoring of mammoth distributed applications.
30+ stories on observability from top engineering blogs
From our Blog
OpenTelemetry has a very handy Java JAR agent that can be attached to any Java 8+ application for instrumenting Java applications. The Java JAR agent can detect a number of popular libraries and frameworks and instrument it right out of the box for generating telemetry data.
The OpenTelemetry Java agent enables Java applications to generate and capture telemetry data automatically. This article gives you a solid overview of the OpenTelemetry Java agent, including how it works. 👇
Everything you need to know about OpenTelemetry Java agent
Thank you for taking out the time to read this issue :) If you have any feedback or want any changes with the format, please create an issue.
