1000+ Community Members, Async APIs for retention settings & improved UI - SigNal 13
Perseverance is not a long race; it is many short races one after the other. > Walter Elliot
Every month, our team works on two major fronts: shipping new features asked by users and iterating on shipped features to make them better for existing users. Last month, our team worked closely with users to ship a lot of product improvements both in UI and backend performance. Alongside that, we have been working on metrics builder and log management, two major feature upgrades to SigNoz.

We are solving some hard engineering problems at SigNoz and building a thriving community of developers who believe in our vision of open-source observability. So, we’re very excited to share that we crossed 1000+ developers in our slack community.
Let’s see what humans at SigNoz were up to in the month of May 2022!
What we shipped?
Last month, we worked closely with our active users to improve the user experience of our dashboards. Here’s a link to our latest release:
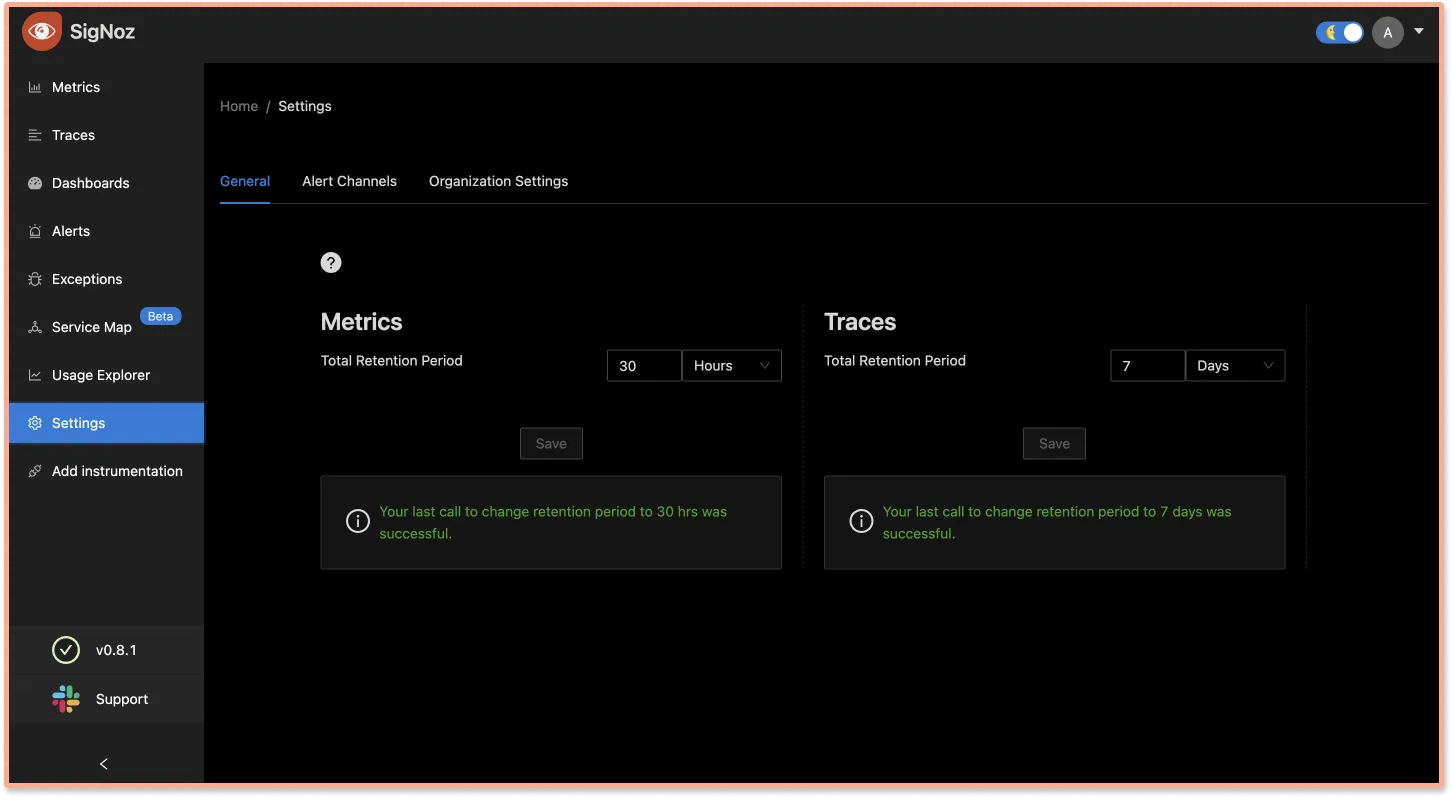
Improved our Retention settings
As an observability backend, we deal with large amounts of telemetry data. We have built async APIs to manage the retention period of metrics and traces with ease. Being able to set up retention period granularly is an important need for our users and using async calls to set them makes the process more robust.
You can access it under the Settings tab of SigNoz. Depending on the company's use case, you can set the retention period of metrics and traces, respectively.
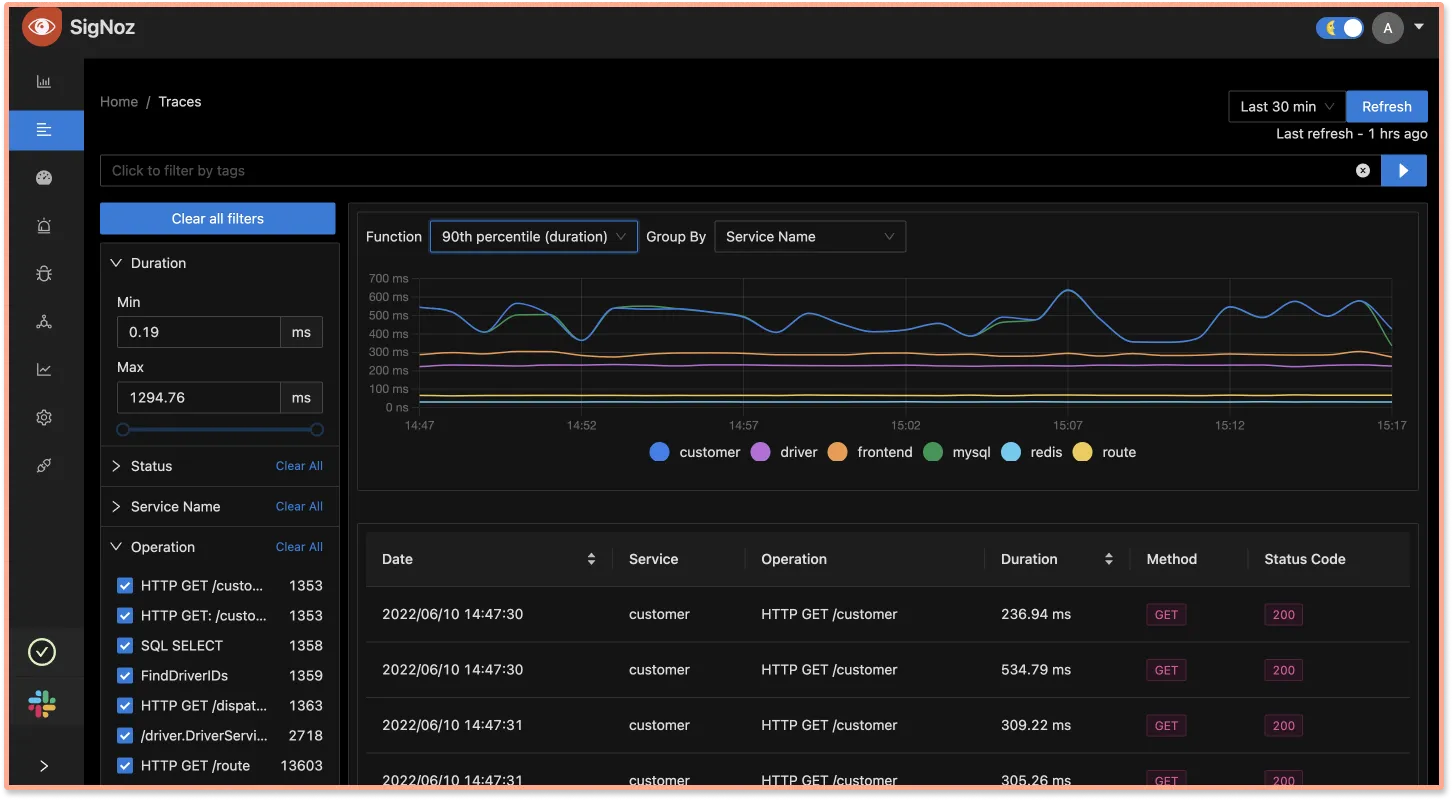
Improved Dashboard UI for better user experience
Our team worked on lots of UI improvements to make the user experience of our dashboards more frictionless. For example, we added pagination for tables and better handling of long service names and operation names on the trace filter page.
Added Playwright for testing
Playwright is a cross-browser tool for automated testing of web apps. We have integrated Playwright in this release to make our testing process more robust. We continuously strive to improve the quality of SigNoz and make it robust for all types of users. Playwright will help us achieve this.
What’s upcoming?
Our team has made good progress in building the first version of metrics builder and log management. Using the metrics builder, users will be able to visualize their metrics data easily.
Here’s a sneak peek of our metrics builder tool 👇
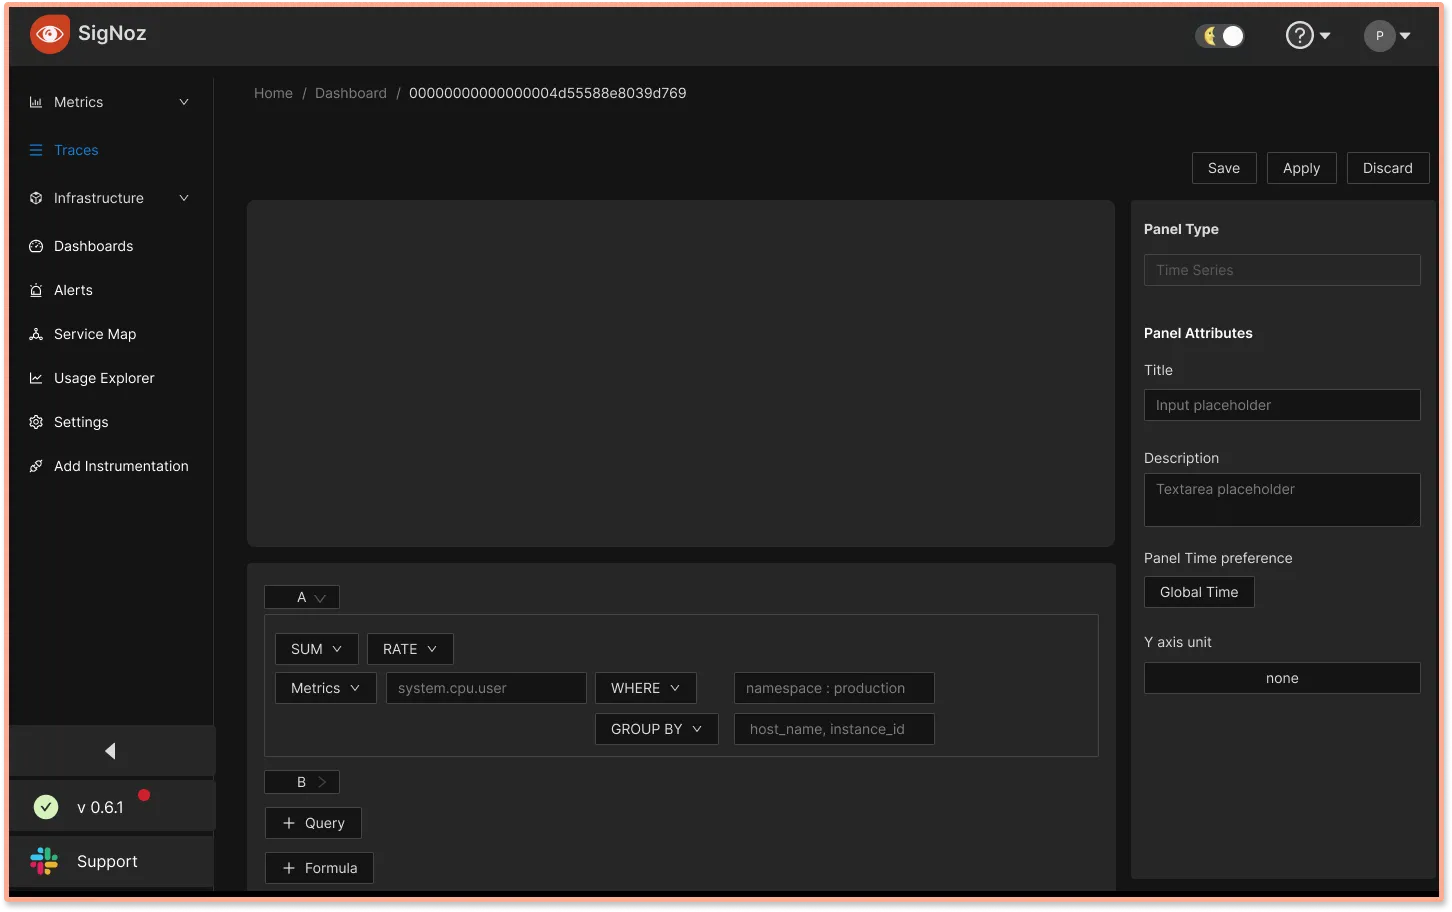
Our team is also working on shipping log management as a major upgrade to our observability capabilities. Adding logs to SigNoz will help our users have a central dashboard that can answer most of their questions regarding application performance issues.
Featured Issue
Enable searching of services and operation names
We want to make it easier for our users to use our dashboards. Microservices-based applications can have hundreds or even thousands of services. As such, we will be working on enabling search across our services and operations filers on the Trace filter page.
If you have worked with dashboards that works with huge datasets and want to share any suggestions, feel free to comment on this GitHub issue.
Educating the ecosystem about OpenTelemetry
At SigNoz, we believe OpenTelemetry will be ubiquitous in instrumenting cloud-native applications. It's already becoming the preferred choice for generating telemetry data by companies of all sizes. It has a huge community and ecosystem behind it.
As part of our efforts to educate the community about OpenTelemetry, we have created sample apps in different languages along with examples of how to instrument the sample apps with OpenTelemetry.
Below are some of the recent tutorials that we have written on OpenTelemetry:
- Rust application instrumentation with OpenTelemetry
- Elixir application instrumentation with OpenTelemetry
- PHP application instrumentation with OpenTelemetry
- .NET application instrumentation with OpenTelemetry
SigNoz News
1000+ members on our Slack Community
Community is the cornerstone of an open-source project. We are elated to share that we’ve crossed 1000+ members in our slack community. We have developers from all across the globe participating in discussions around open-source, OpenTelemetry, and of course, SigNoz.
We hope to build a healthy and thriving community where people can discuss all things monitoring, observability, and open-source.
If you’re a developer interested in open-source software, observability, and APM tools, then we would love to host you there.

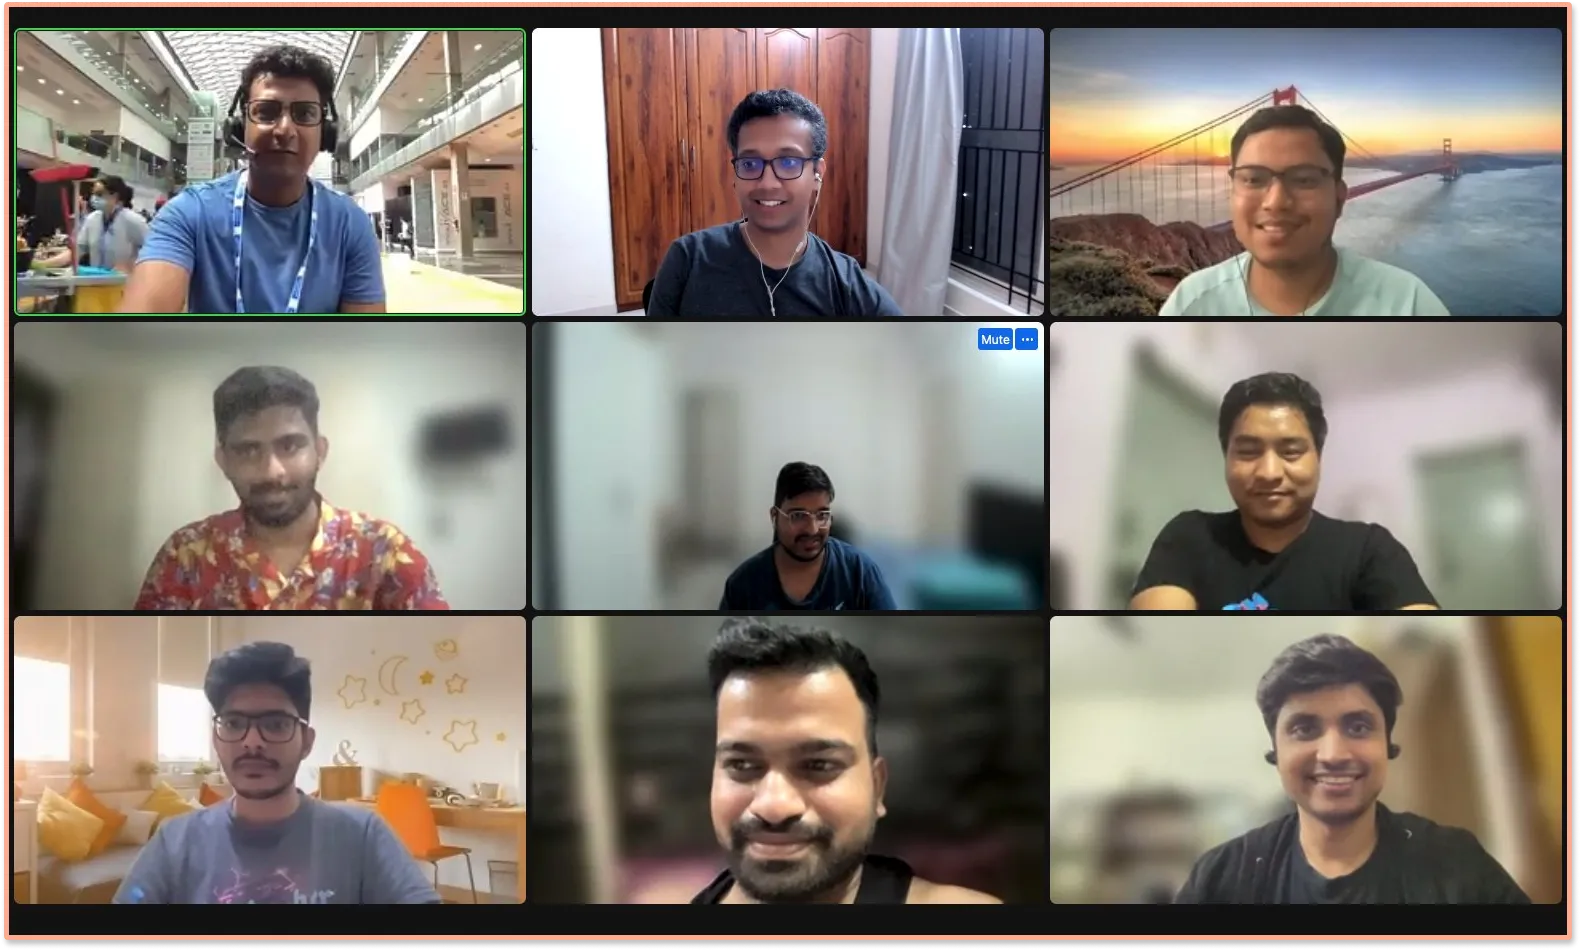
We visited Kubecon, Europe!
Last month, our co-founder and CTO, Ankit Nayan packed his bags to explore the cloud-native community at Kubecon, Europe. Though we didn’t present this time, it was a great experience interacting with the global community.
Open-source and cloud-native technologies have changed the way the world builds software. At SigNoz, we are building at an interesting cross-section of both open-source and cloud-native. Ankit even made sure that the team attends the Kubecon virtually 🙂
Contributor Spotlight
We want to thank our two new contributors who made significant contributions in the latest releases of SigNoz. 🤗

India

India

India
From our Blog
Modern application architecture using cloud-native, containerization, and microservices is a very complex distributed system. A typical web-search example can illustrate some of the challenges such a system needs to address. While debugging such distributed applications, developers need context. And that’s where distributed tracing comes into the picture!
Distributed tracing gives insights into how a particular service is performing as part of the whole in a distributed software system. It involves passing a trace context with each user request which is then passed across hosts, services, and protocols to track the user request.
In this tutorial, learn how to implement distributed tracing in a golang application with three microservices.
Distributed Tracing in Golang applications
Thank you for taking out the time to read this issue :) If you have any feedback or want any changes to the format, please create an issue.
Feel free to join our slack community and say hi! 👋
