Logs Management made available in the latest release, podcasts, office hours & more - SigNal 16
"In my book, experience outranks everything."
Welcome back to our monthly product updates - SigNal! The latest release of SigNoz is now available with Logs management. You can use SigNoz as your one-stop open source observability solution with logs, metrics, and traces under a single pane of glass.

We also participated in podcasts, held office hours, and got featured as one of the top promising startups in the DevOps ecosystem.
Let’s see what humans at SigNoz were up to in the month of August 2022!
What we shipped?
Last month, our team released Logs management for all users. Here’s the link to the latest release:
Logs Management
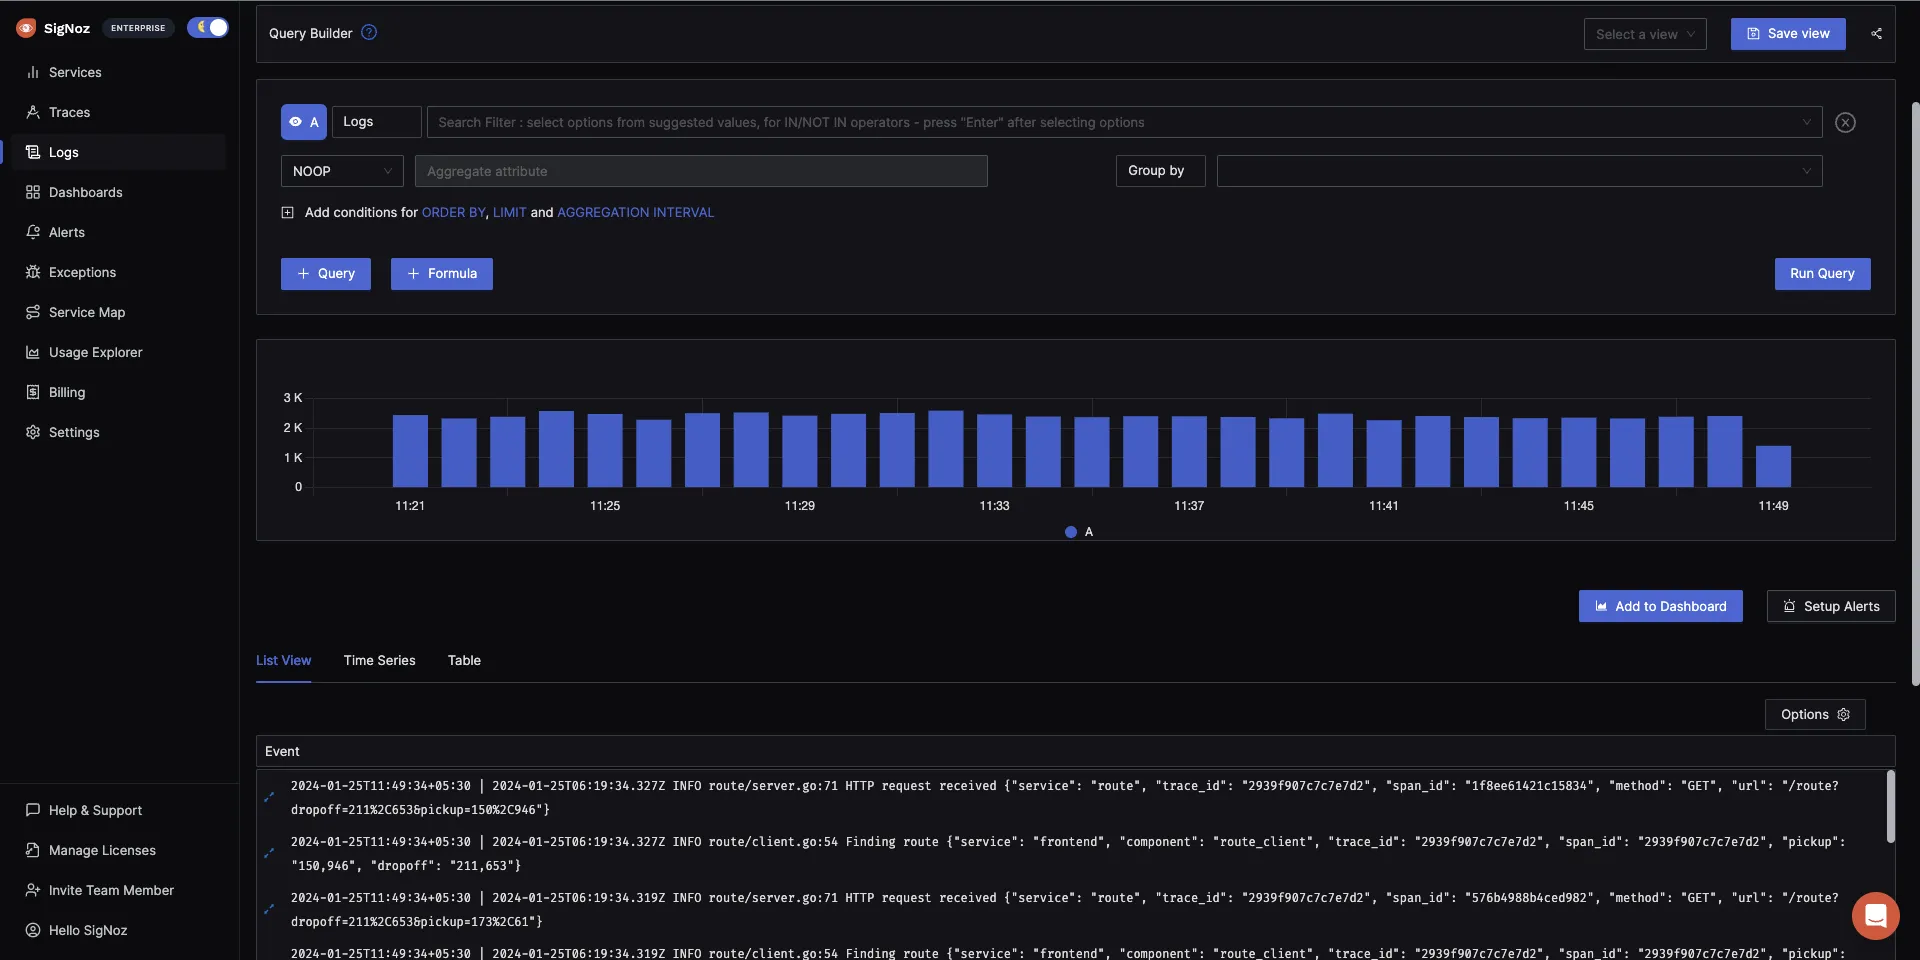
We are elated to share that Logs management is now available for all users in the latest release of SigNoz. With logs, metrics, and traces available under a single pane of glass, you can use SigNoz as your one-stop observability solution.

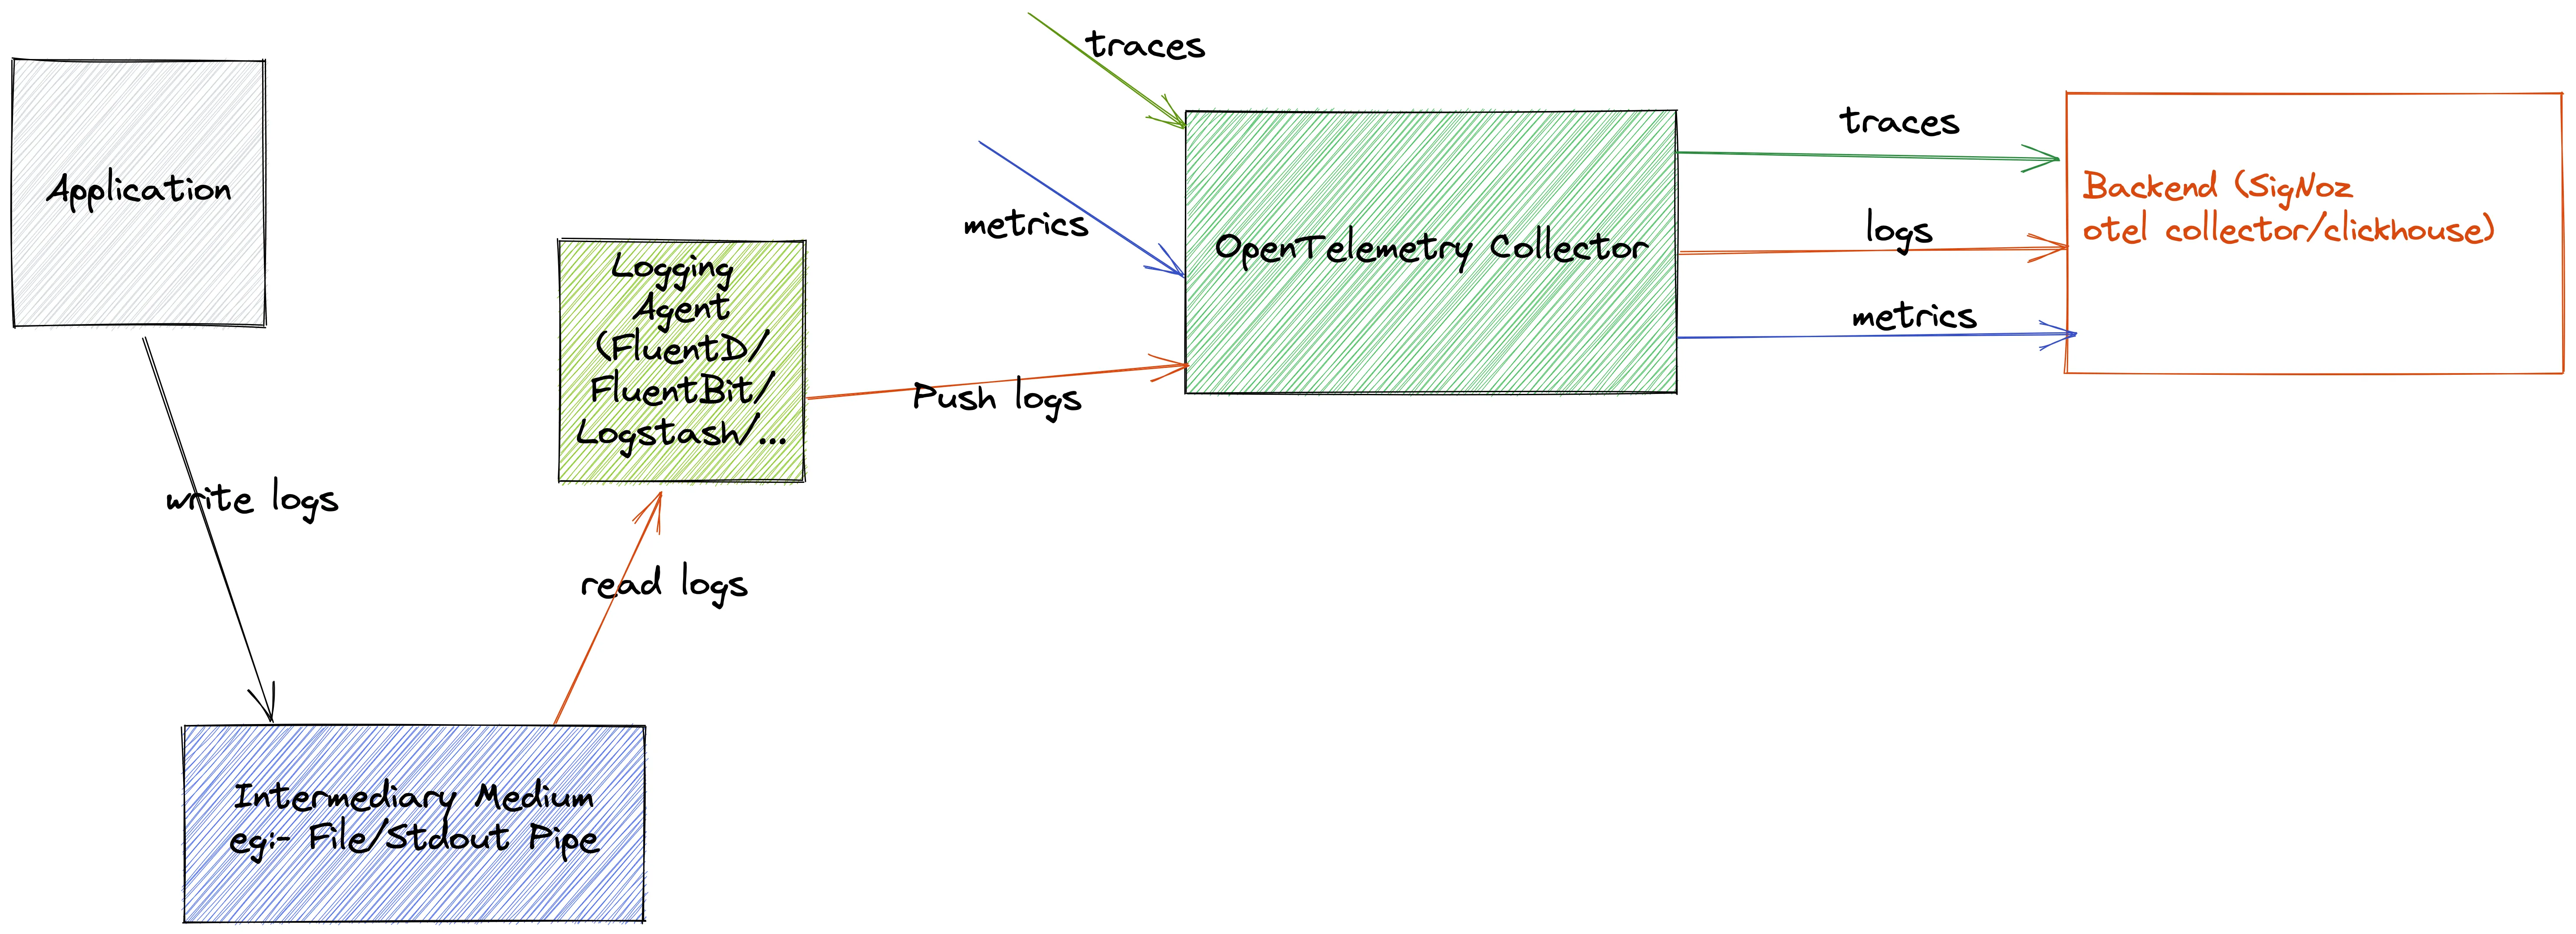
SigNoz uses OpenTelemetry to collect logs. Of all telemetry signals, logs have probably the biggest legacy. Most programming languages have built-in logging capabilities or well-known and widely used logging libraries.
OpenTelemetry aims to support legacy logs and logging libraries as well as provide improvements and better integration with the rest of the telemetry signals for a robust observability framework.
With this in mind, our aim is to provide support to your existing logs pipeline and make the transition seamless.

You can read more about logs collection from our documentation.
Other Improvements
We also made significant improvements to other tabs in our dashboards. Some of the improvements we made are as follows:
- You can now search by service name on the services list page(#1520)
- Support for legend in the query builder formulae(#1530)
- Improvements in the alerts page
What’s upcoming?
Our team is now working on shipping enterprise features. Our enterprise features will enable teams to use SigNoz for better collaboration and deeper insights. For example, we are planning to launch features around trace aggregates that would enable teams to drive deeper and faster insights into performance issues.
Our current set of upcoming enterprise features include:
Support for SSO and SAML SAML and SSO support are essential for our enterprise users to enable smooth team collaboration while having a secure authentication process in place.
Trace ID based filtering on
Tracestab Some of our users have traces with a large number of spans. We want to provide them with an easier way to filter and analyze spans based on a specific trace ID.Deeper insights from trace aggregates Our team is working on enabling teams to derive deeper insights from trace aggregates. Tracing is a powerful tool for understanding modern distributed applications. For example, trace aggregates can help users to identify the slowest DB queries quickly.
Featured Issue
Horizontal scaling of OpenTelemetry Collector and ClickHouse
In the observability domain, handling data at scale is one of the key features of APM tools. With our community adoption increasing, and our users using SigNoz for a deeper understanding of their application, the scale of data we’re seeing is humungous. So our team has started working on making SigNoz more scalable by allowing horizontal pod autoscaling of OTel collector and ClickHouse.
If you have any ideas or context about scaling products to handle huge datasets, feel free to share your experience on this GitHub issue.
SigNoz News
We participated in podcasts, did multiple office hours, and got featured. Here’s a rundown of things we did last month.
OpenObservability Podcast with Jonah Kowall
Pranay, our co-founder, was invited by Jonah Kowall, CTO at Logz.io to participate in OpenObservability podcast, where Pranay talked about the journey of building SigNoz. Pranay shared how SigNoz evolved as a product and what major decisions the team took for greater community adoption and usage.
You can listen to the entire talk here 👇
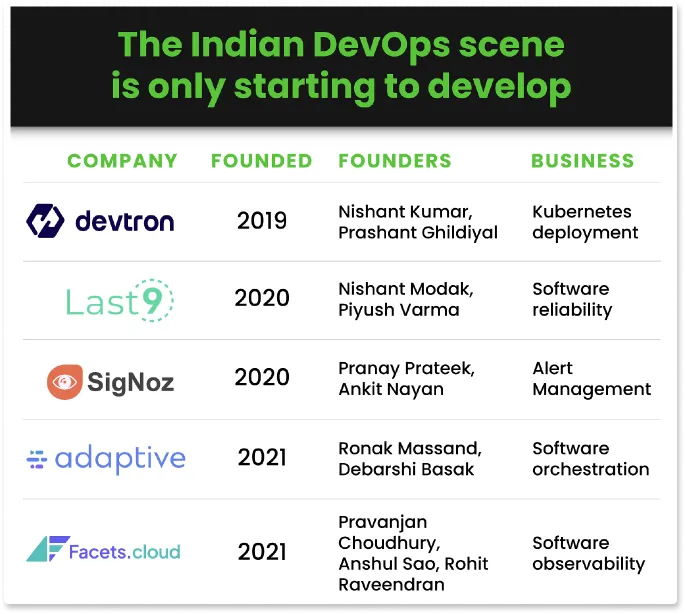
Featured as one of the promising Indian DevOps SaaS Startups
We were featured as one of the promising startups building SaaS in the DevOps space by Captable. India has always been a hot hub for consumer tech startups, but things are changing now. A handful of builders from India are now building solutions to serve the global developer community.

India is home to one of the largest populations of developers, and we believe we have the right talent and understanding to address some of the burning problems in the DevOps ecosystem. You can check out the article here.
RED Metrics Calculation Office Hours
We have recently started having SigNoz office hours. The idea is to share more with our community members and invite their ideas and feedback. Srikanth Chekuri, our backend engineer, conducted office hours on RED metrics calculation in SigNoz. He talked about the following:
- How are RED metrics calculated in SigNoz?
- The case of missing spans
- Showing real-time metrics in the service dependency graph
Catch Srikanth as he takes you through the above concepts 👇
Logs Management demo Office Hours
We conducted office hours on the newly released Logs Management. Nitya, our engineer who worked on Logs management, gave a live demo of the Logs tab in SigNoz and also took questions from the community about using the logs feature effectively.
Catch the full video of Logs management office hours here 👇
Contributors
One of the best parts of building an open source project is the contributions from the community. Last month, a lot of our contributors helped to make SigNoz better. We want to thank the following contributors for making significant contributions to SigNoz 🤗
From our blog
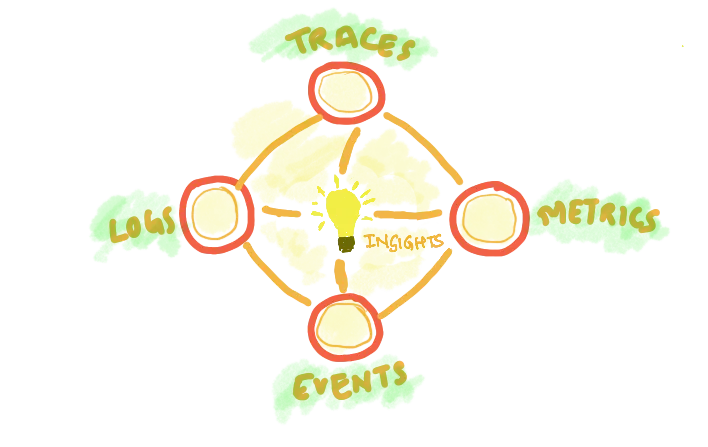
Logs, metrics, and traces are often touted as three pillars of observability. But does it really matter to the end user while they are trying to solve customer issues? Modern engineering systems are complex and involve many moving components. Finding where things are going wrong is non-trivial. And in our view, solving such complex problems need correlation across different signals.

At SigNoz, we don’t believe in pillars and silos. There are just different signals which you want to see in a correlated way and in context to figure out what's the problem quickly. Read about what we think of telemetry signals and how they fit together to create an observability mesh.
Not 3 pillars but a single whole to help customers solve issues faster
Thank you for taking out the time to read this issue :) If you have any feedback or want any changes to the format, please create an issue.
Feel free to join our slack community and say hi! 👋

