“There is only one thing that makes a dream impossible to achieve: the fear of failure.”
- Paulo Coelho
Welcome to the last monthly product newsletter from the year 2022. The month of December ended on a high note for the team at SigNoz. An amazing team workation in Goa was all we could ask for to end the year in which we shipped consistently and made SigNoz better with constant user inputs.

Our latest release comes equipped with better scaling capabilities and improved user experience. Let’s dive in to see what humans at SigNoz were up to in the month of December 2022.
What we shipped?
We have shipped some much-awaited features over our latest releases. You can now handle more scale with SigNoz, while having a better user experience.
Distributed ClickHouse Support
Modern-day software systems emit huge amounts of observability data. We have made it easier for our users to handle the scale of their observability data with the release of distributed ClickHouse support.
From SigNoz v0.12, you can use ClickHouse shard instance to manage your observability data. Check out our docs on how to set up distributed ClickHouse for SigNoz.
Google Auth implementation for SSO
We have shipped Google auth support for Single Sign-On. SSO and SAML are important features for our enterprise customers. The support for Google Auth expands on our goal to provide smoother collaboration for bigger teams while maintaining a secure authentication process.
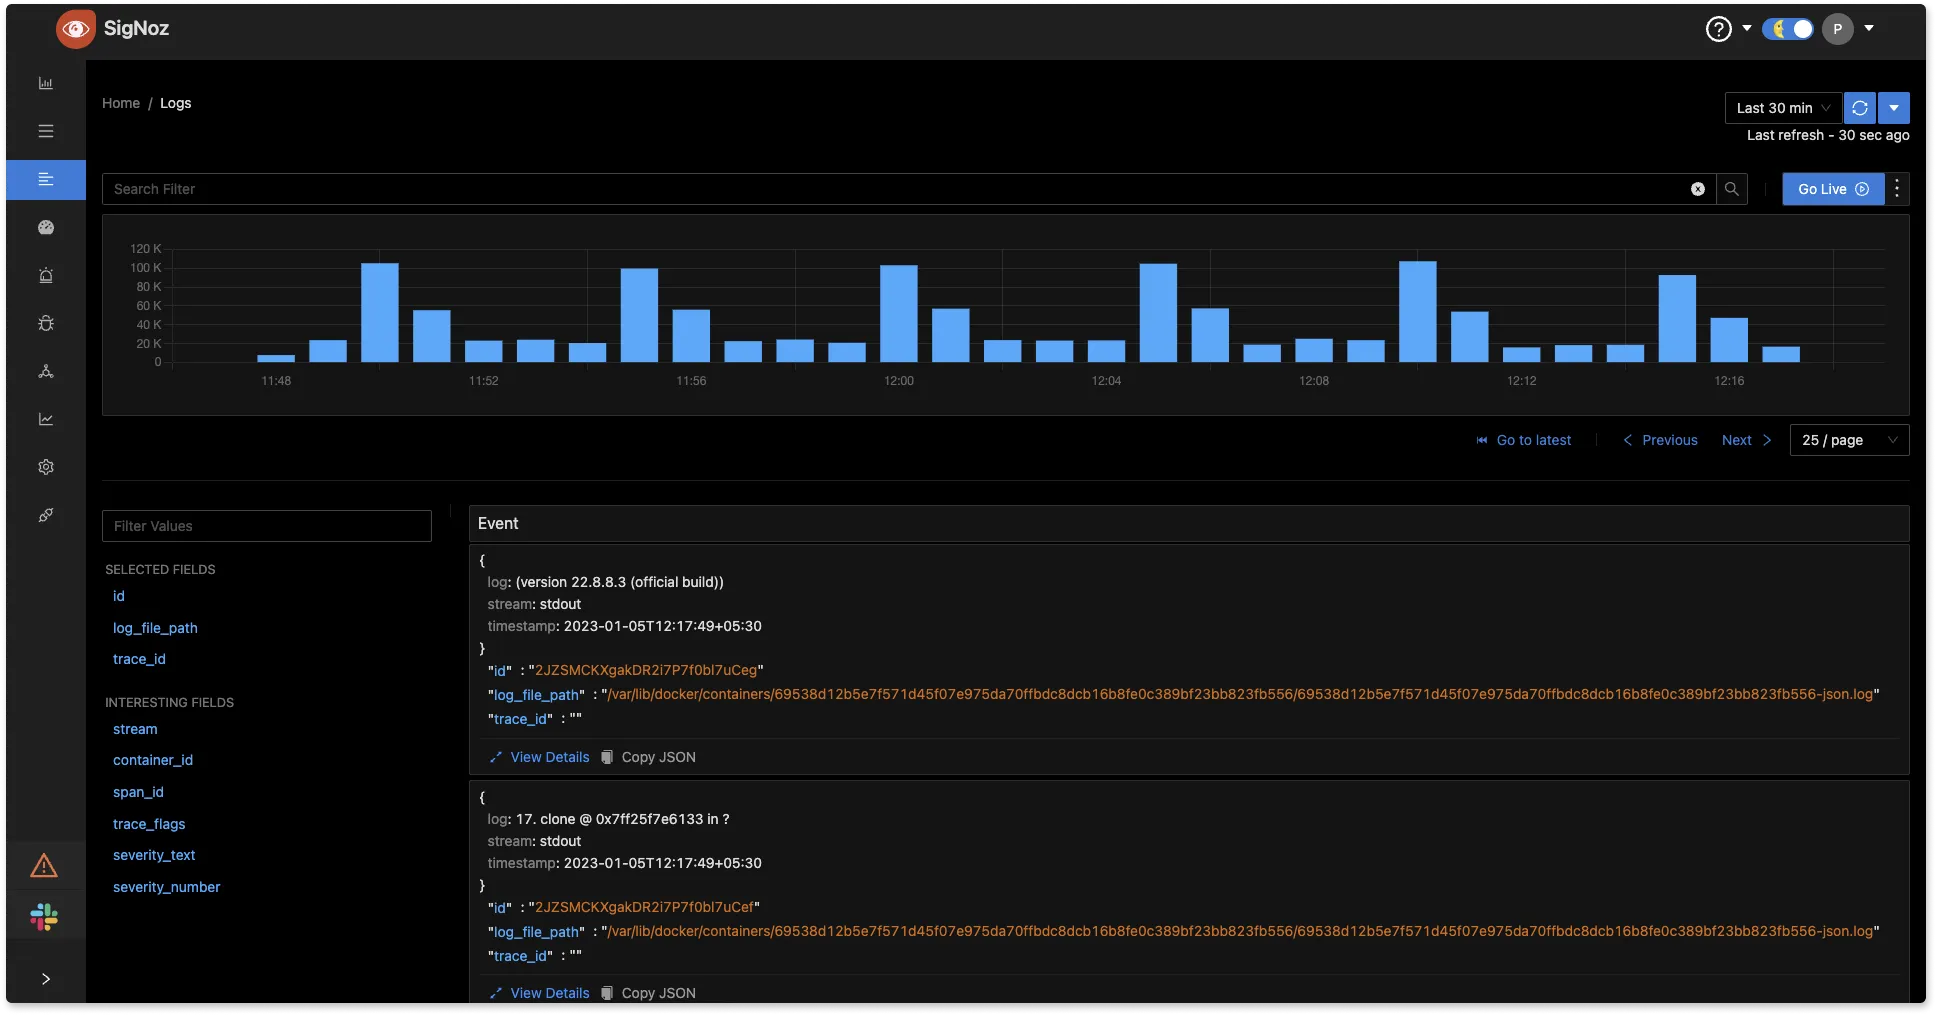
Improved performance of Logs Management
Since we released log management in SigNoz, we have been working closely with our users to improve it. Our latest release consists of considerable improvements in our logs management experience. The logs tab should feel much snappier now. If you are on an older version of SigNoz, we suggest you upgrade to the latest version.
Other Improvements
We have simplified our password checks by removing unnecessary complexity. With the new update, our password checks adhere to the newest version of NIST password guidelines.
We have also introduced filters on our exceptions page. Now, you can use filtering based on the service name on the Exceptions page. Users can quickly deep dive to see the exceptions happening in their particular services.
What’s upcoming?
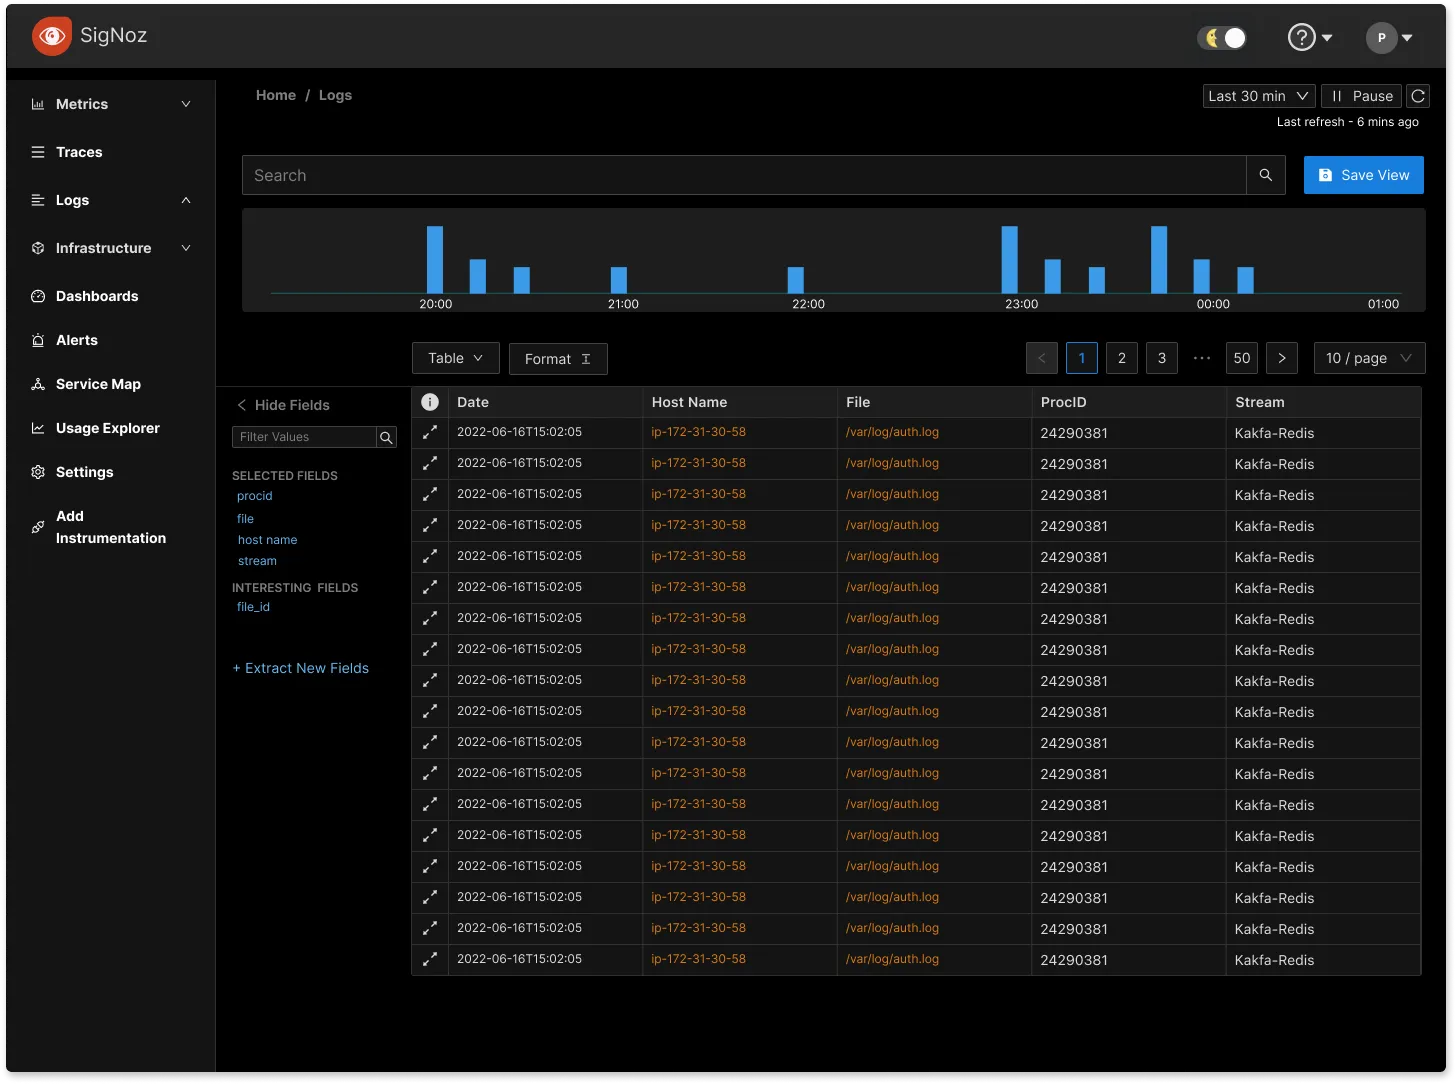
Table and Raw Views in Logs Tab
We are working on creating more compact views in our logs tab so that it’s easier for our users to analyze logs quickly. We are currently iterating on solutions based on user feedback. Feel free to open up a GitHub discussion if you have ideas or feedback to share.
Logs Parser
Log parsing is an important step in creating meaningful log data. It is critical to parse log files to extract meaningful information from logs. Our team is working on making it easier for our users to parse logs quickly.
The plan is to create a UI-based logs parser where users can specify how to parse logs being sent to SigNoz easily. Users can decide which field to extract, and what attributes to keep with a few simple clicks.
Dashboards
We want to make it quite easy for our users to get value from SigNoz. We are working on enabling default dashboards based on the user’s application environment. Some out-of-the-box dashboards that we have planned are:
- Host metrics
- Kubernetes cluster metrics
- OTel Collector metrics
- ClickHouse metrics
If you have any ideas on dashboards that we should enable out of the box, feel free to comment on this GitHub issue .
Featured Issue
Default dashboards for applications based on language/framework used
We want to make it easier for our users to get started with SigNoz. One of the initiatives that we want to work on is having default dashboards for common use cases of monitoring a particular application stack. For example, you might want to monitor JVM memory consumption if you have a Java application.
If you have some requirements based on application frameworks you use in your stack, feel free to comment on this GitHub issue .
Customer Stories
Our vision of open source observability under a single pane of glass is solving the pain points of great engineering teams out there. We sat down with two of our users to understand how they are using SigNoz to build more robust and resilient applications.
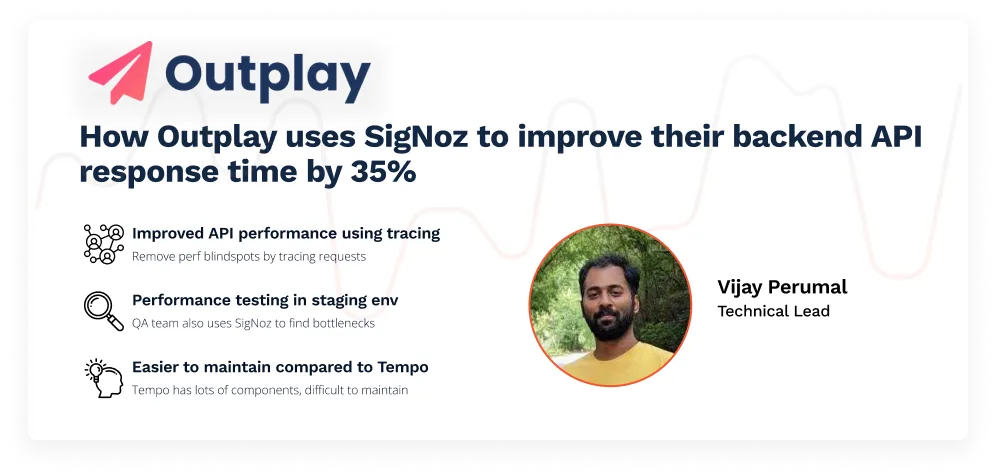
Outplay, a sales engagement and sales automation platform uses SigNoz to monitor their APM metrics. The Outplay team has used SigNoz to optimize their APIs after migrating their entire workload from EC2 to Kubernetes. Check out the full story here.
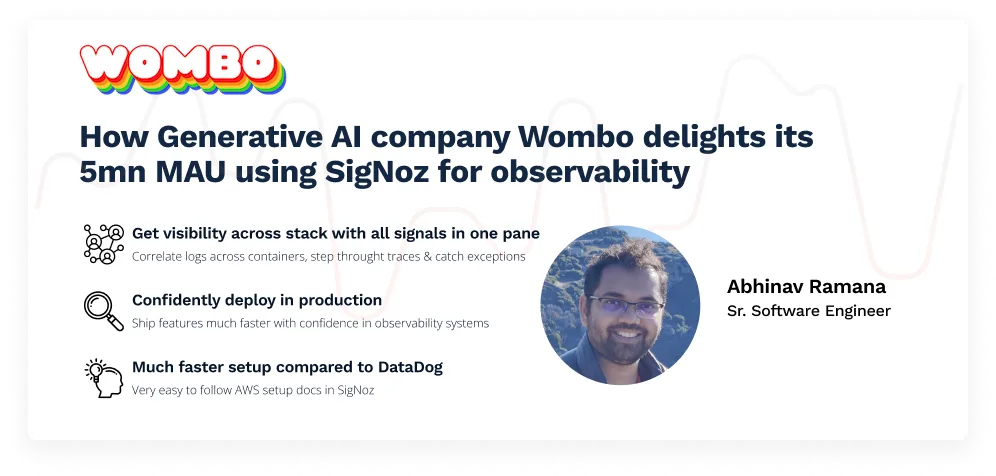
Wombo, an AI-powered content generator, uses SigNoz to make the user experience smooth for more than 5 million monthly active users. They have used SigNoz to optimize their key user experience metrics and to identify the root cause of application performance issues. Check out the full story here.
SigNoz News
A fun-filled Team Workation
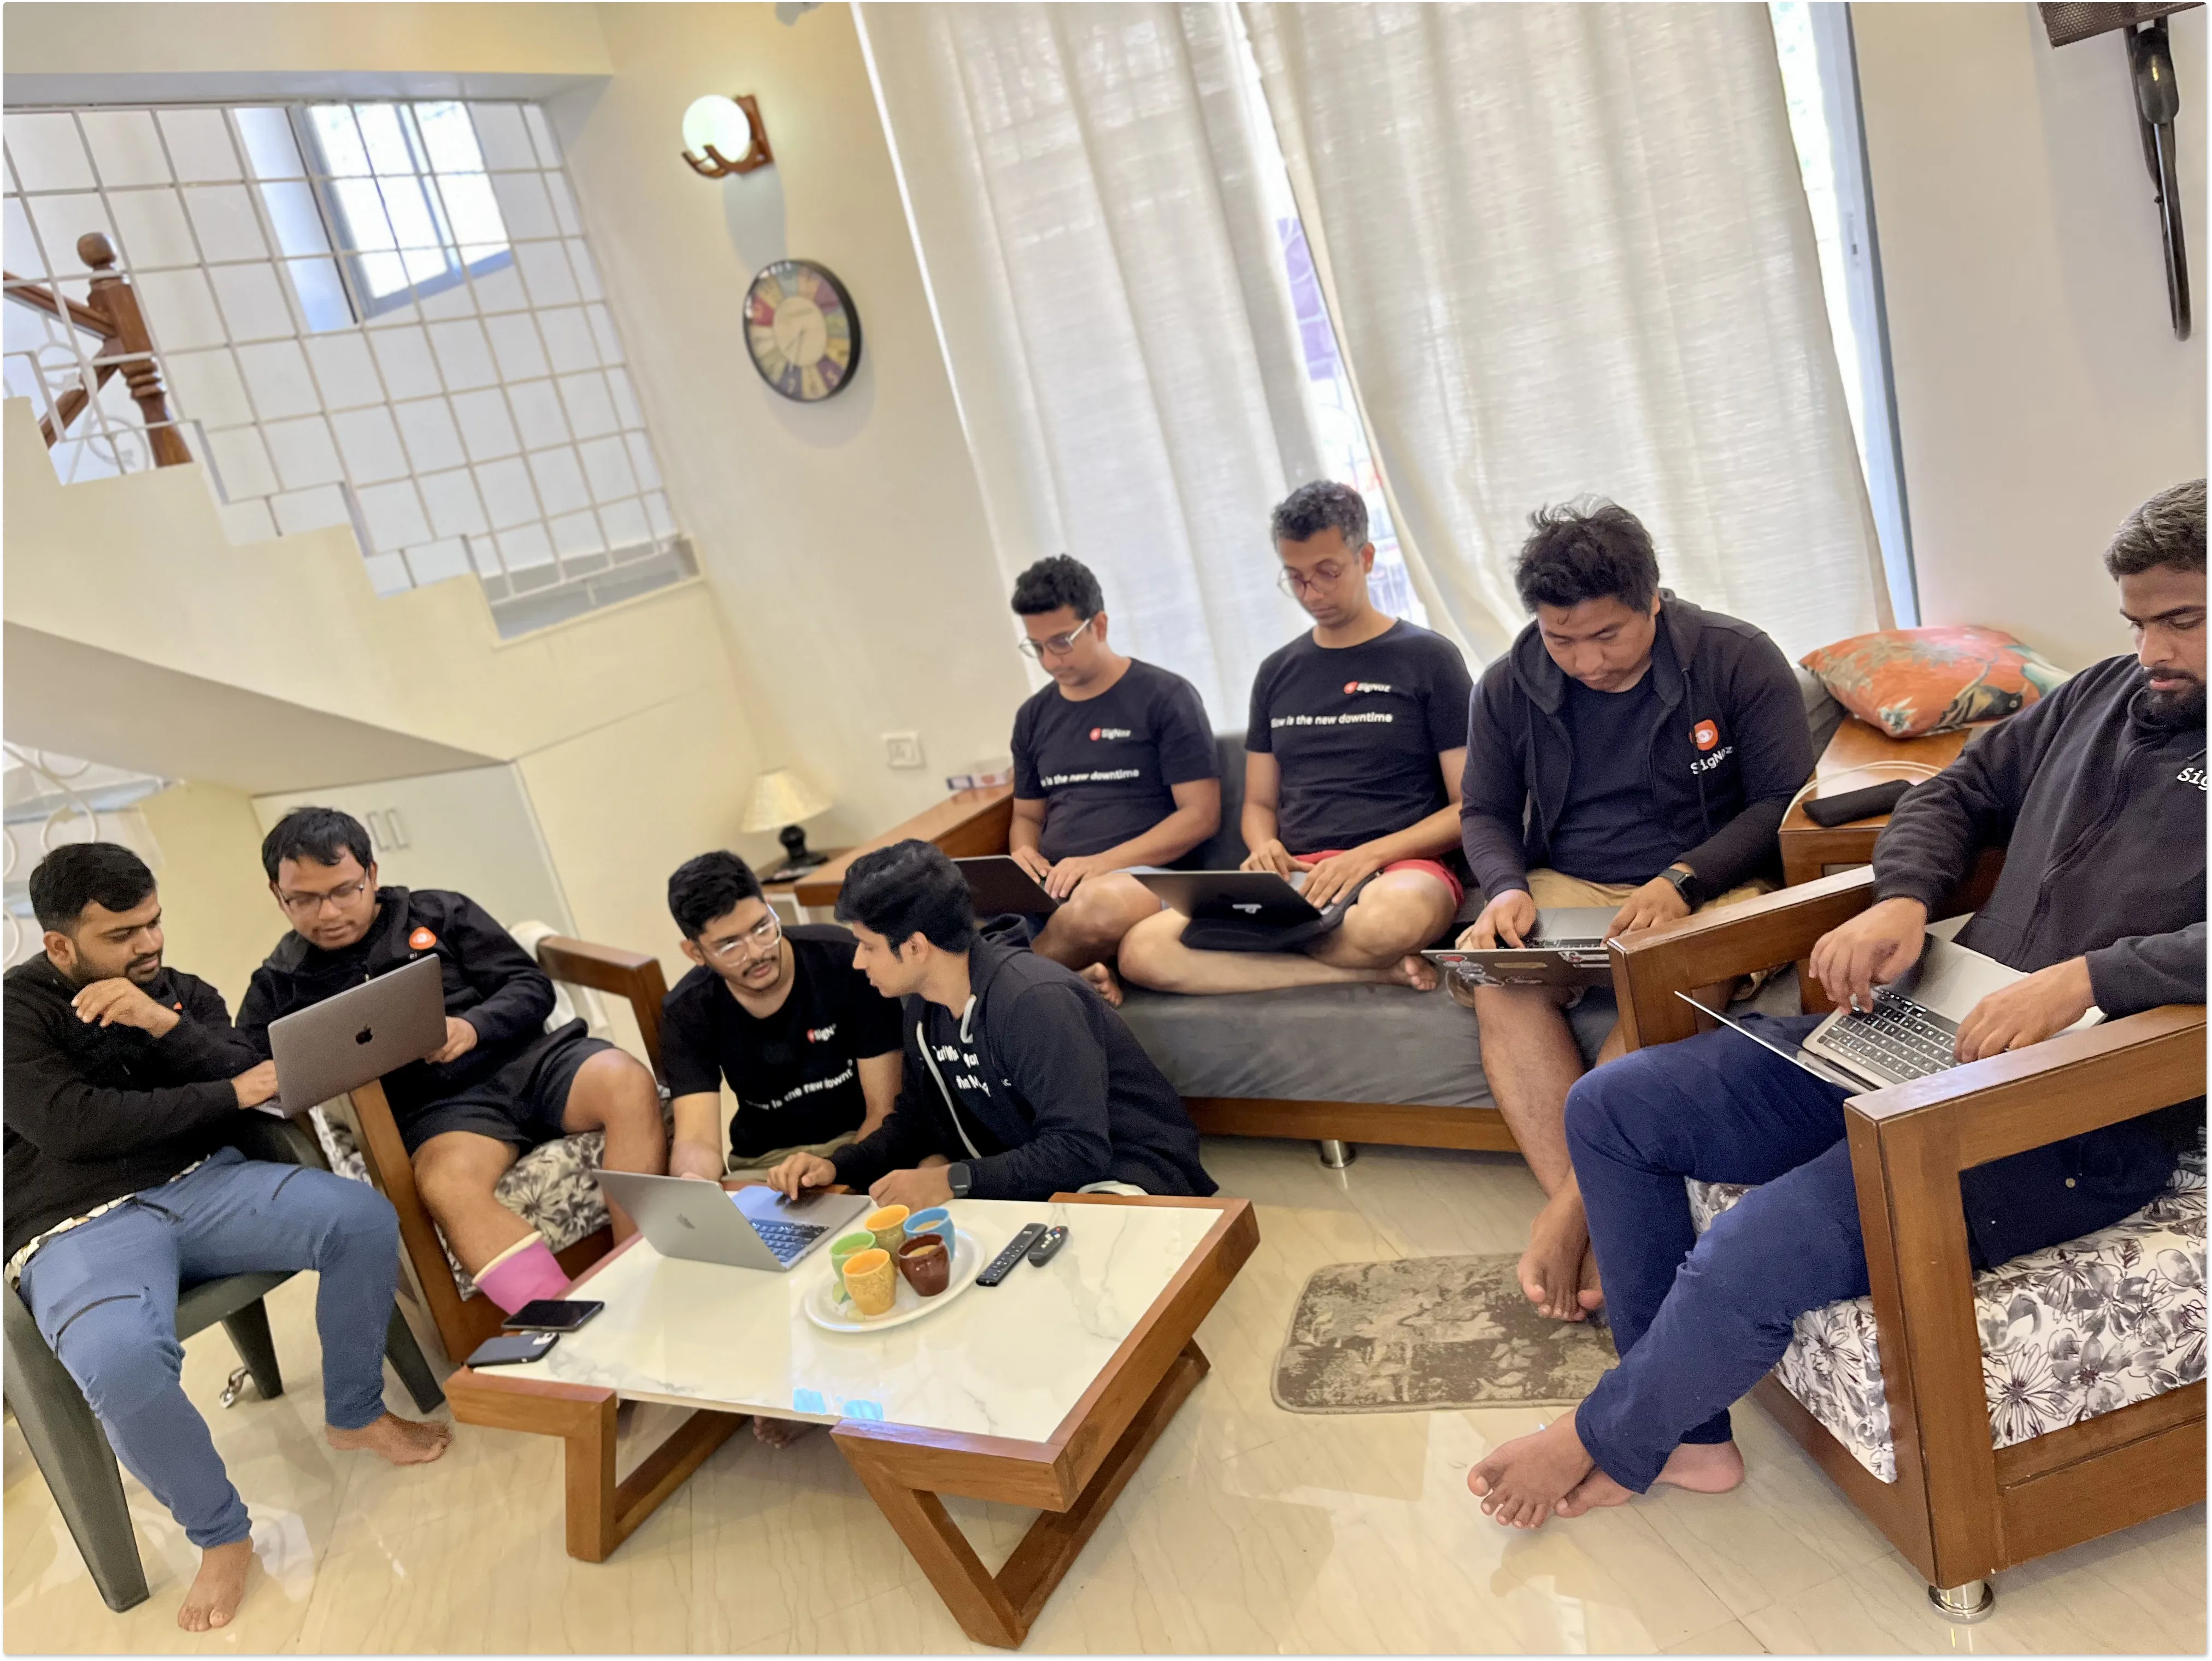
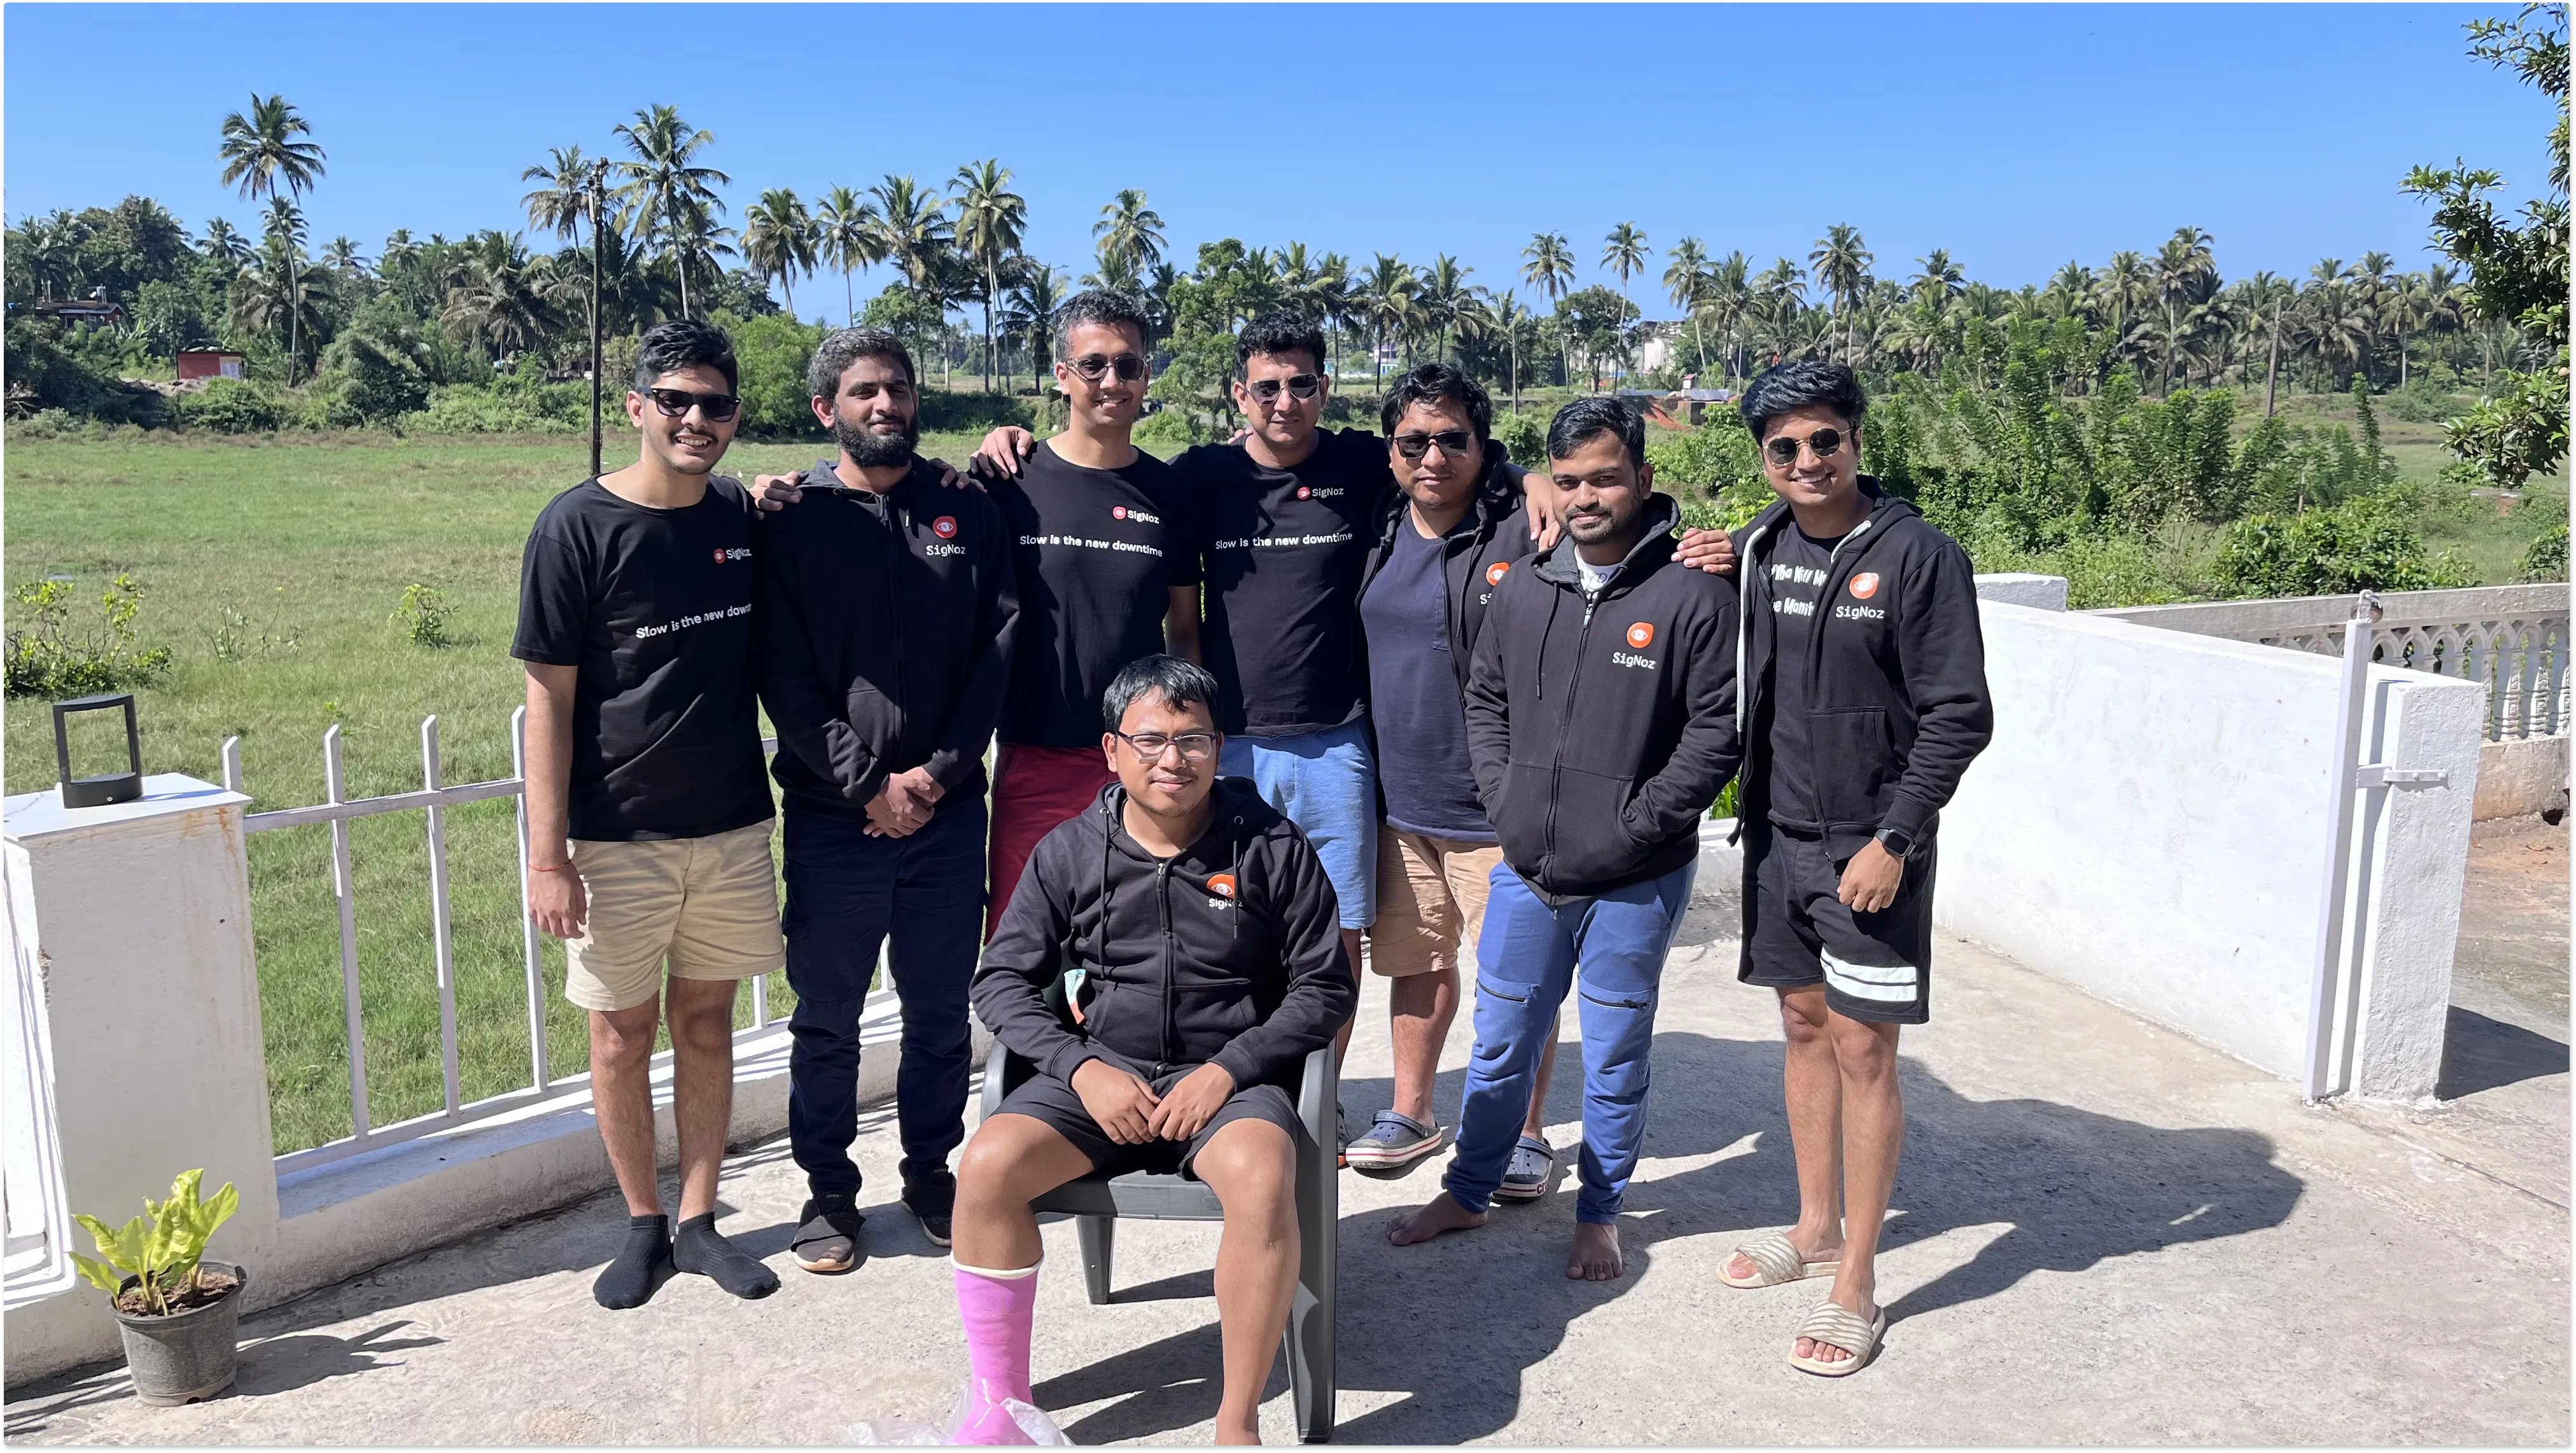
We ended the year 2022 on an exciting note - a team workation in Goa. 🏝 We have built and shipped some great stuff together, shipping features consistently in a short span of time. Our company culture has fostered a strong sense of trust and autonomy among our team members, which makes our remote-first culture work. And at times, when we meet in person, the camaraderie is palpable.
The week in Goa was so much fun that we are already making plans for our next get-together. We explored beaches and waterfalls and had some great team bonding sessions.
Here are some amazing snapshots from our trip 👇
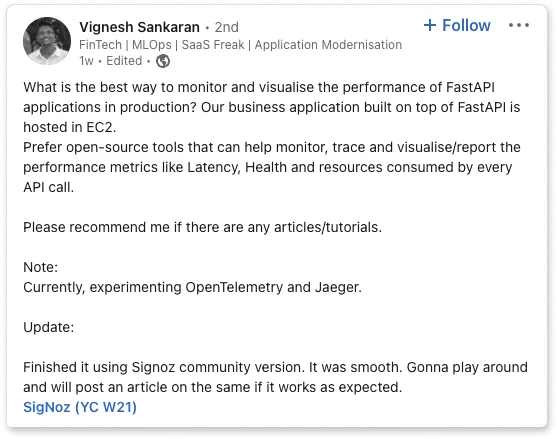
User Shoutout
It’s always great to see shoutouts from the community about SigNoz solving their needs. Here are some that made our day.
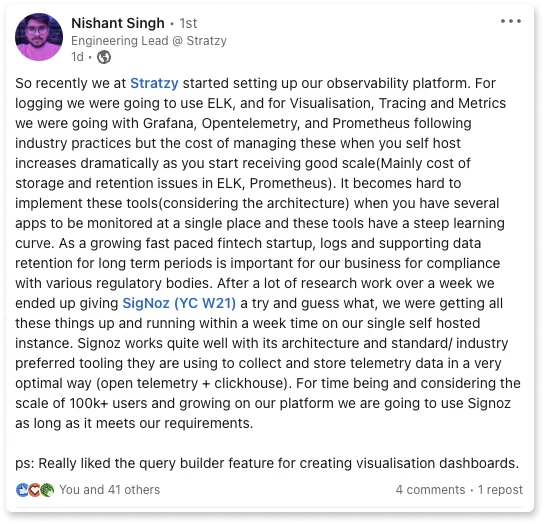
Having a smooth onboarding process is something we are focused on, and it’s great to see users finding it easy to get started with SigNoz.
Contributor Highlight
We can not thank our open source contributors enough. Open source is one of the rare ecosystems where collaboration happens across international borders and language barriers. We say internally - code unites all!
We want to thank the following contributors who made contributions to SigNoz last month 🤗


From the Blog
NGINX is a prominent web server, reverse proxy server, and mail proxy utilized by many websites and applications to serve content to their users. One important aspect of managing a web server is logging, which refers to the process of recording information about the server's activity and performance.
Learn how to set up and configure error and access logs in NGINX. Once you have configured your logs, you can send them to SigNoz for storage and analysis.
NGINX Logging | Configuring Error and Access Logs, Sending Nginx Logs to Syslog & more
Thank you for taking out the time to read this issue :) If you have any feedback or want any changes to the format, please create an issue. Feel free to join our slack community and say hi! 👋