Advanced filtering capabilities, Logs performance benchmark, and front page of HN - SigNal 21
“Think with a very long time horizon, act with great short-term urgency and effectiveness, success guaranteed.”
Sam Altman
Welcome to our first monthly product newsletter of 2023, SigNal - 21!
Last month, we worked closely with our users to ship some advanced features which will enable our users to take advantage of their observability data more effectively. We were also trending on the front page of hacker news and got featured as one of the fastest-growing open source startups.
Let’s dive in to see what humans at SigNoz were up to in the month of January 2023.
What we shipped?
Being able to dive deeper into your observability data with views that can drive insights faster can make a huge difference in debugging your applications faster. We have shipped features that will help you slice and dice data with more granular control. With ability to filter based on specific attributes, you can now create views with deeper analytical queries.
Latest Release v0.15.0Advanced filtering capabilities with trace attributes
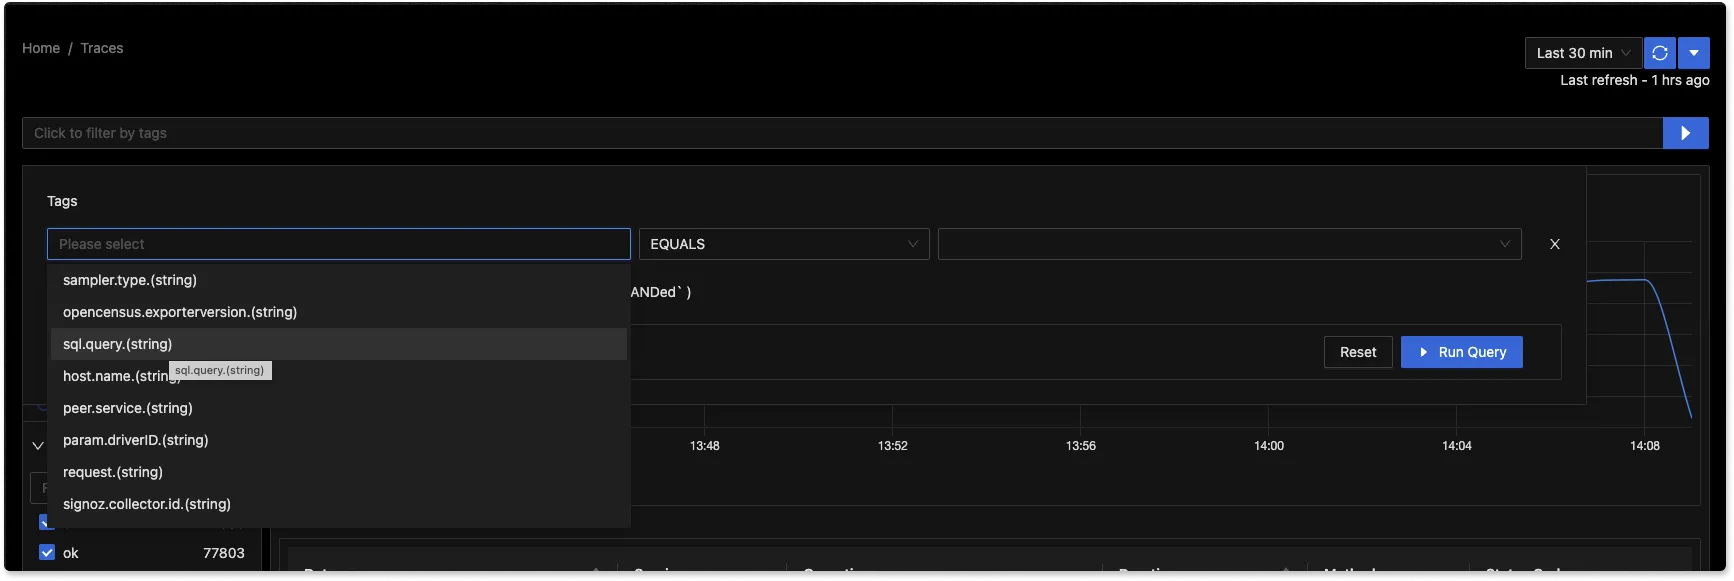
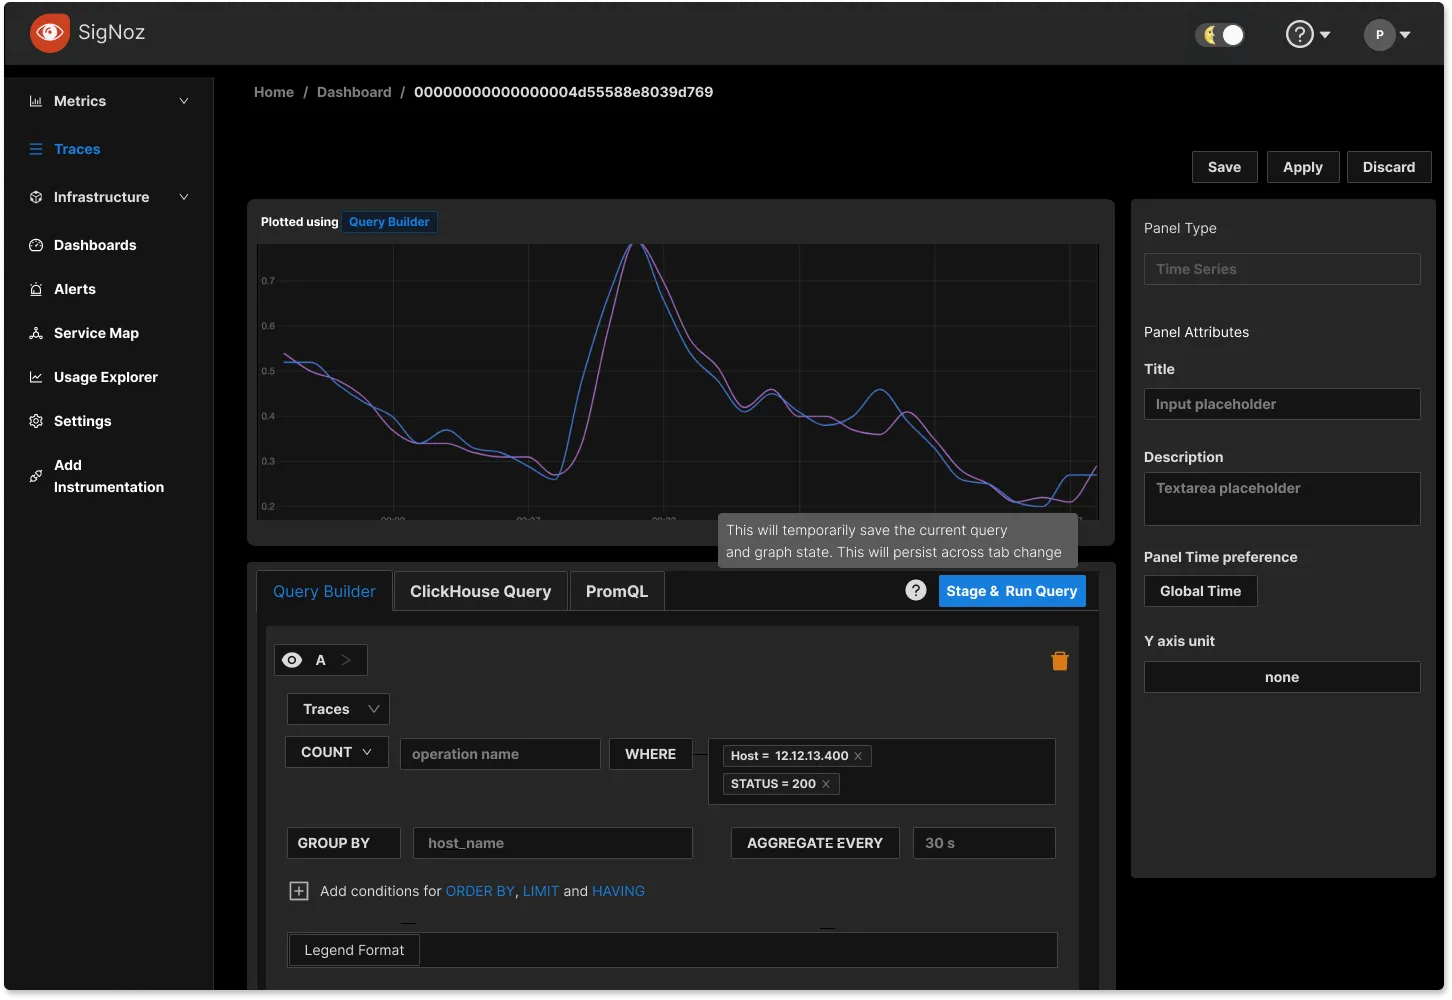
Contextual insights are necessary to solve application performance issues quickly. We have enabled advanced filtering capabilities based on trace attributes and tags to quickly monitor trace data across different granularities.
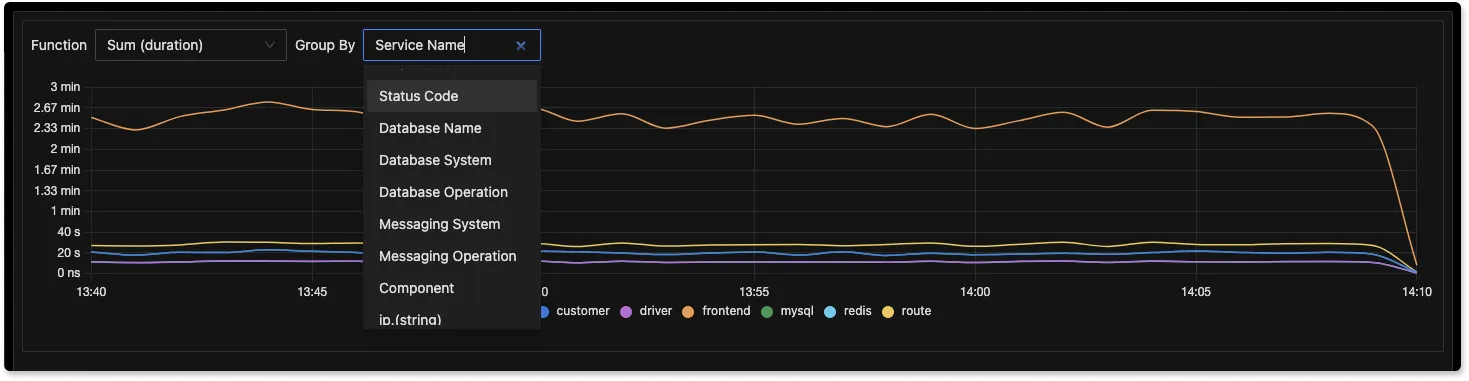
You can also create advanced charts across different dimensions with our newly enhanced Group By filters.
Zoom in to charts with simple click-and-drag
We have enabled a simple click-and-drag feature to zoom into any specific parts of charts for a better user experience.
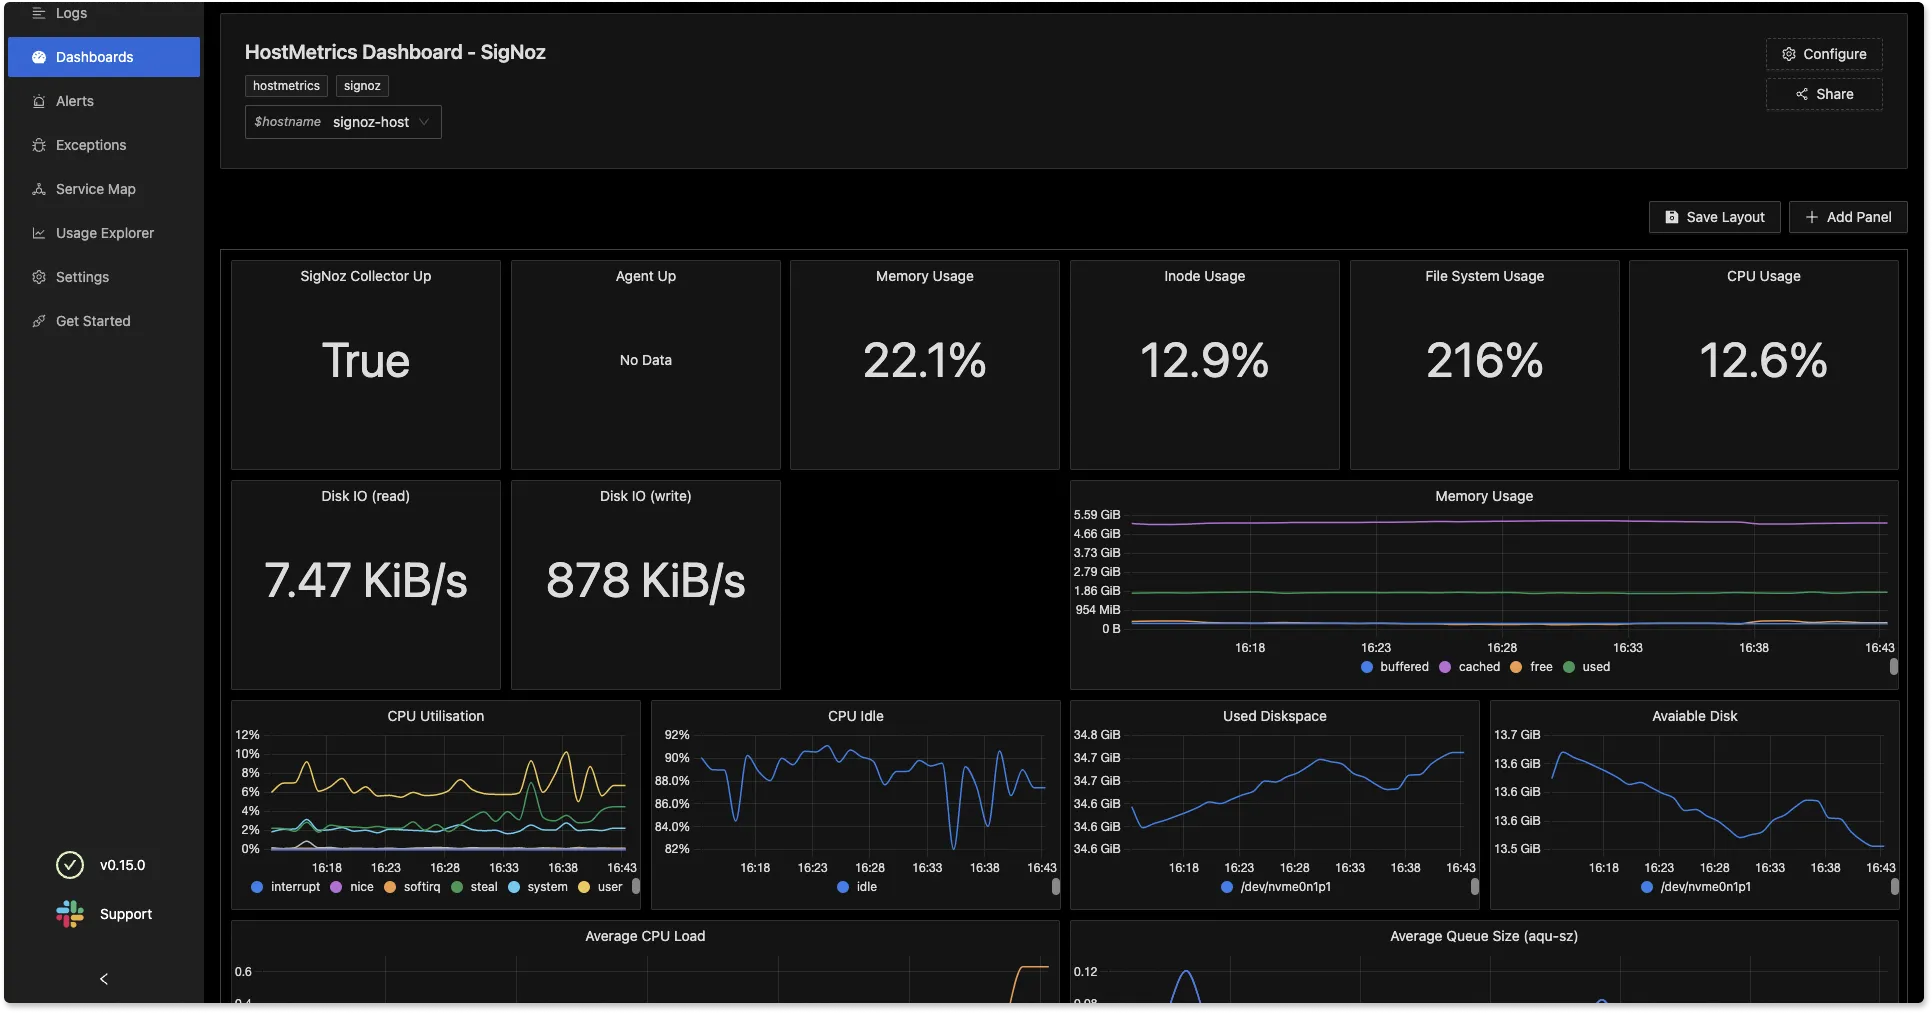
Improved Dashboard performance
The Dashboards tab enables you to have a customized set of charts to monitor specific components of your software system. We have enabled lazy loading in our Dashboards tab to make the user experience faster.
Variable chaining in Dashboards
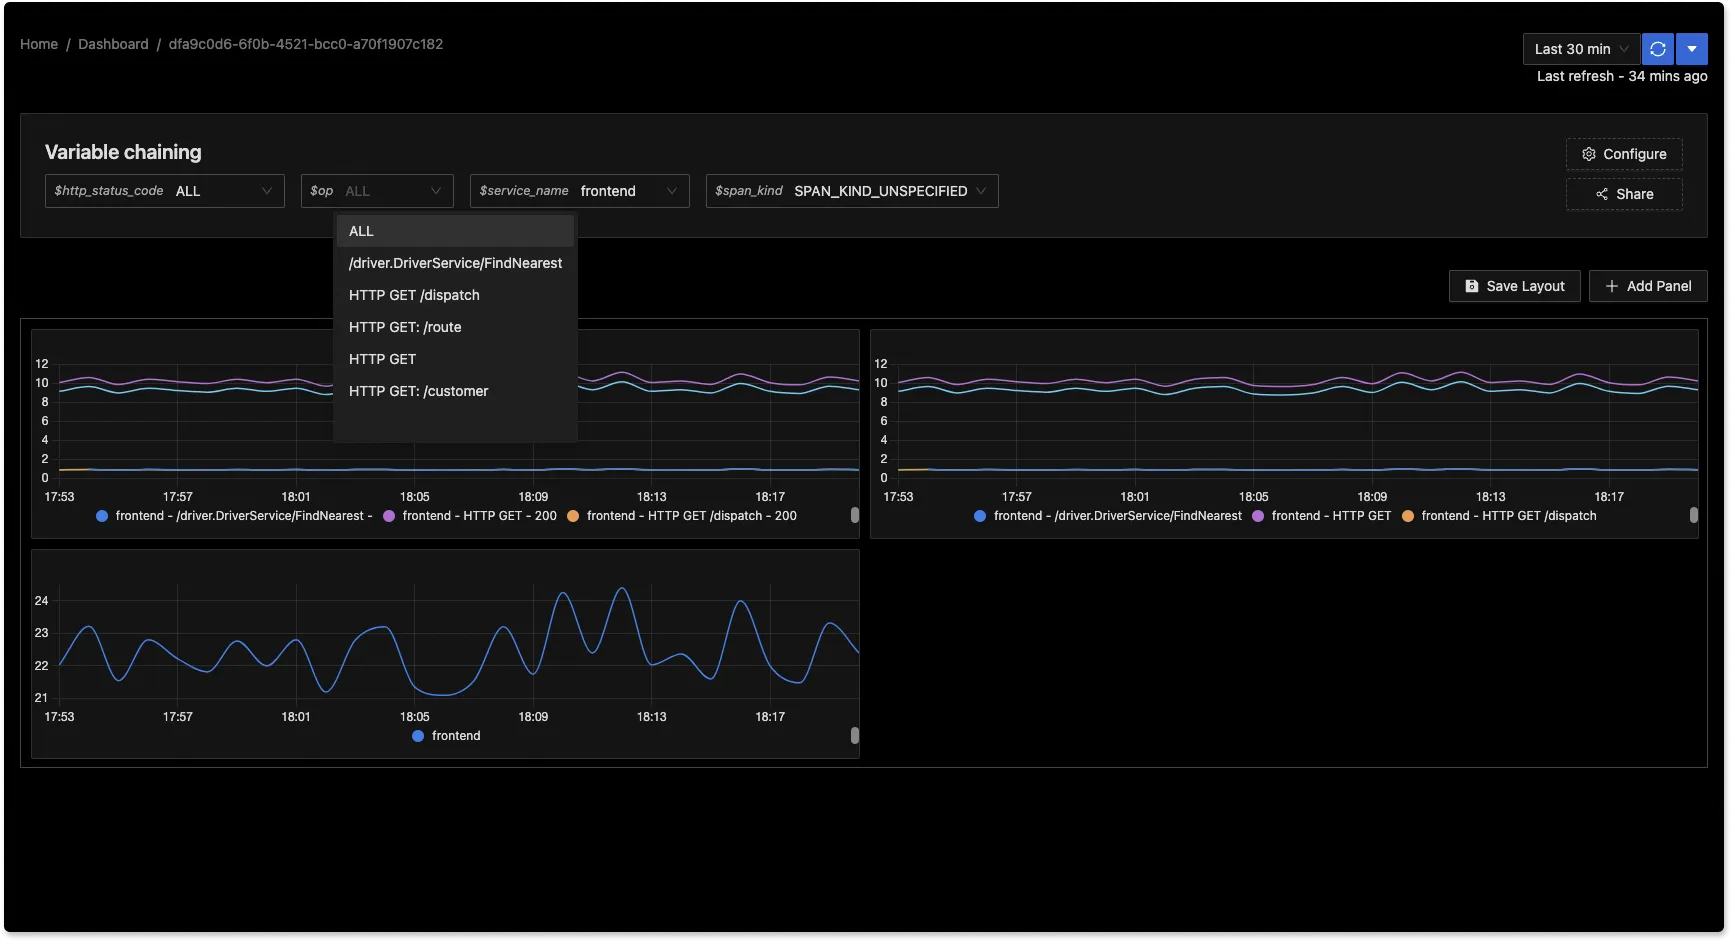
We have introduced variable chaining in the Dashboards tab to enable more granular controls over the filtering of charts. In production environments, there might be n number of scenarios that users might want to investigate.
With variable chaining, you can filter out specific views for your dashboards quickly. In the below snapshot, you can apply variables for status_code, operations, service_name, and span_kind to see charts based on selected variables.
Here is a quick demo on how to set up variable chaining.
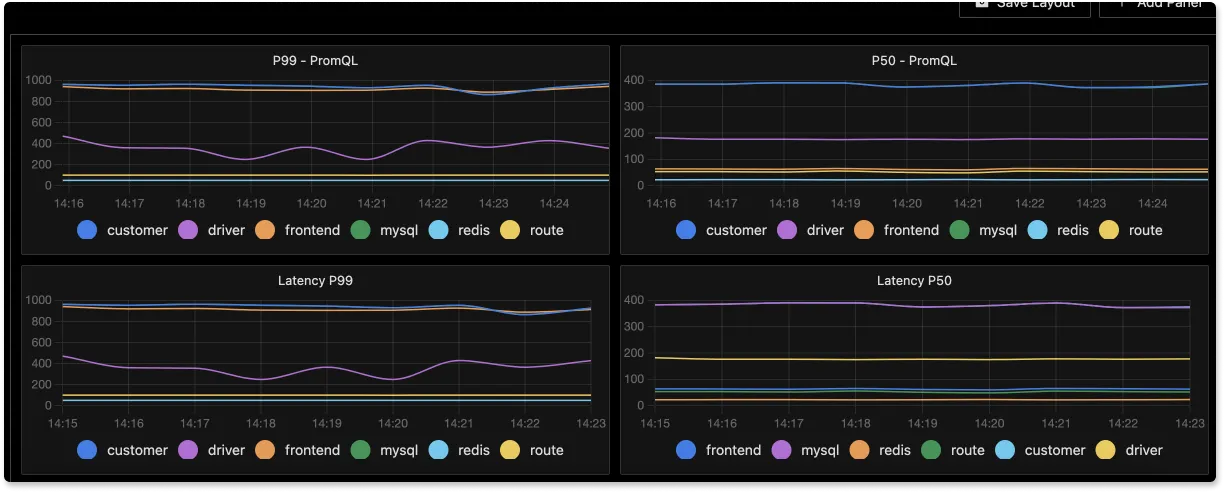
Support for Histogram Quantiles
We have added support for histogram quantiles. With this enabled, users can now plot application latency percentiles using the query builder.
The below snapshot shows application latency percentiles like p99 and p50 plotted using PromQl and our query builder.
What’s upcoming?
Integrated Query Builder
We are working on building an integrated query builder that will let you create dashboards from each of the three telemetry signals (logs, metrics, and traces) tabs using our Query Builder UI. You can also use the query builder to create alerts easily.
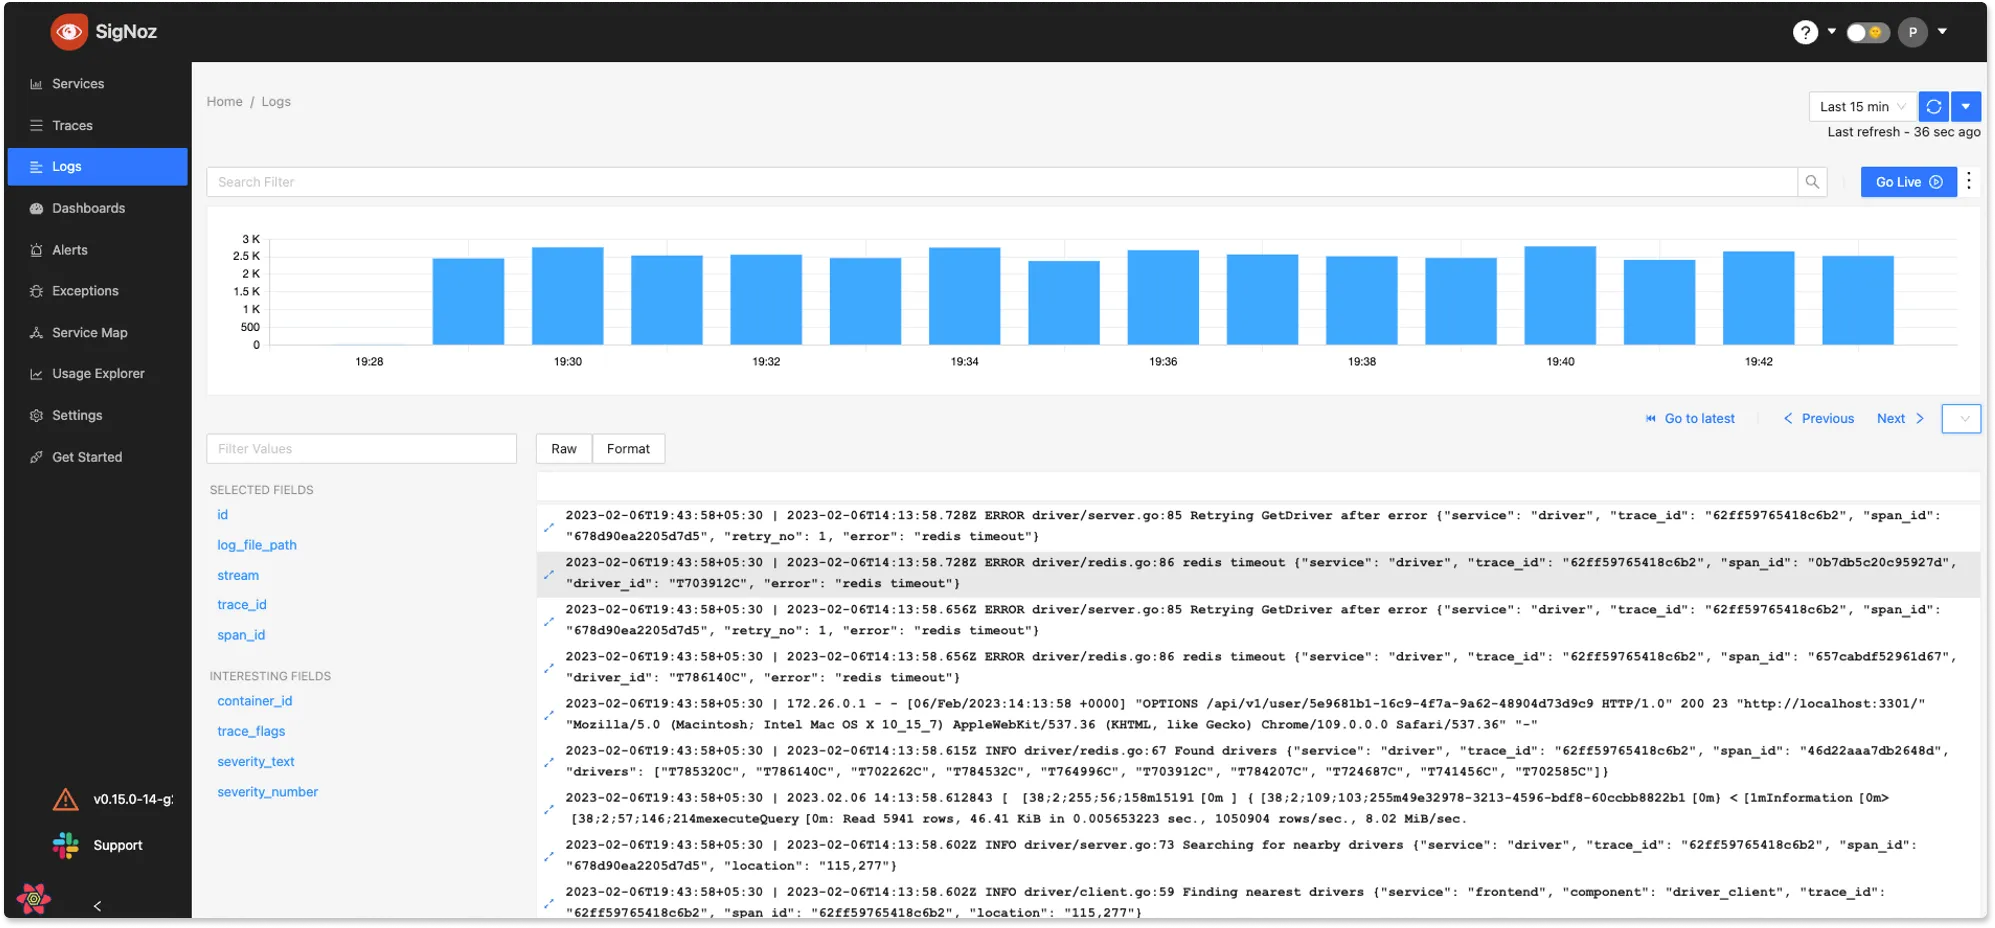
Enhancement in Logs Management Tab
We are working on building an intuitive logs parser for our logs management tab. With the logs parser UI, users will be able to parse their logs easily without writing complicated and cumbersome regex. The logs parser will enable users to decide which field to extract, and what attributes to keep with a few simple clicks.
We are also working on shipping table and raw views for logs which will help our users analyze logs quickly.
Logs Performance Benchmark
Logs are an integral part of any system that helps you get information about the application state and how it handles its operations. We recently published a logs performance benchmark comparing SigNoz with Elasticsearch (ELK stack) and Loki (PLG stack) on three parameters: ingestion, query, and storage.
Below are the key findings:
- For ingestion, we found SigNoz to be 2.5x faster than ELK and consumed 50% less resources.
- For querying benchmarks, we tested out different types of commonly used queries. While ELK was better at performing queries like COUNT, SigNoz is 13x faster than ELK for aggregate queries.
- Storage used by SigNoz for the same amount of logs is about half of what ELK uses.
- Loki doesn’t perform well if you want to index and query high-cardinality data. In our setup for Loki, we were not able to push it to ingest high cardinality labels/indexes.
Read on to find out more about benchmark results from this blog.
Featured issue
Deployment patterns of OpenTelemetry CollectorOpenTelemetry collector is at the core of our observability stack. It is a versatile tool that can fit many use cases. We want to explore different deployment patterns of the collector to make recommendations to our users.
If you have ideas on possible deployment patterns, feel free to comment on this GitHub issue.
SigNoz News
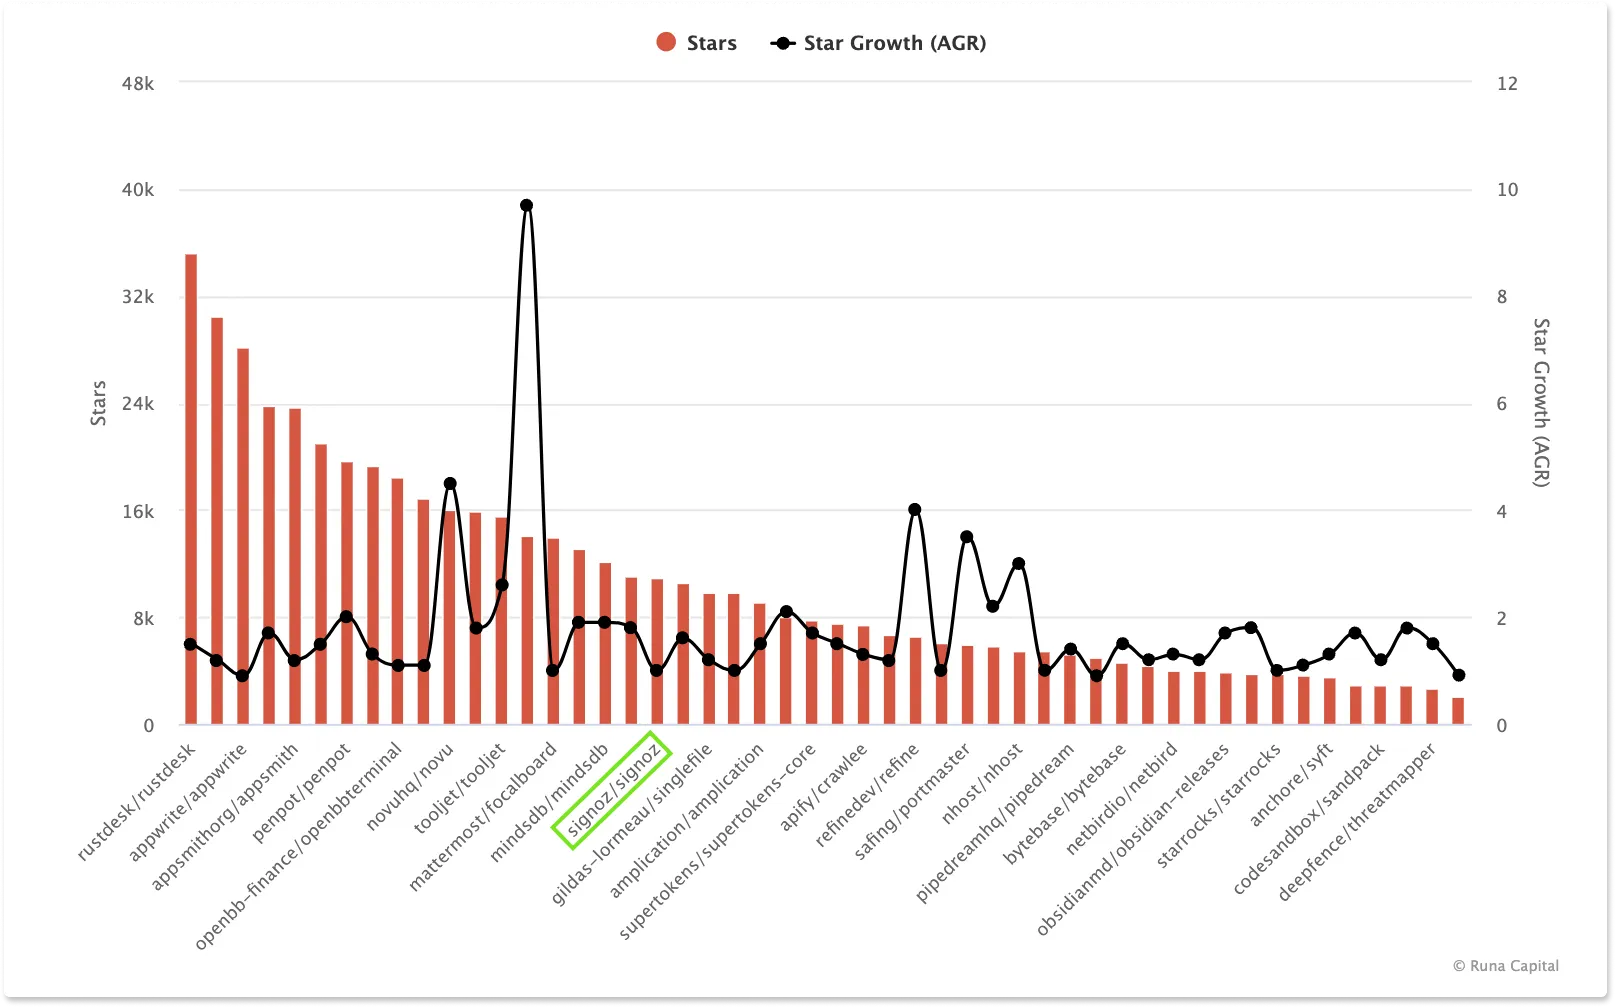
Featured in ROSS Index Fastest-Growing Open Source Startups
ROSS index is a regularly updated ranking of the fastest-growing open source startups. We are elated to share that we have been featured on the list of top 20 open-source startups by GitHub stars count and the top 50 in overall rankings.
We are on a mission to democratize observability for developer teams of all sizes, and our growth is a testimonial to the need for a robust open-source observability platform.
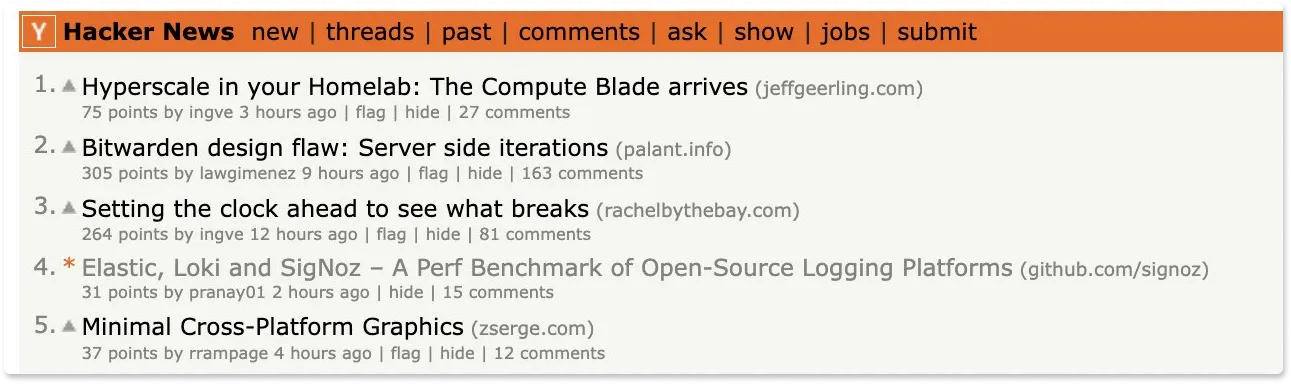
Trending on the Front Page of Hacker News
Our logs performance benchmark was trending on the first page of Hacker News. It was great to see the interest of the community in the approach we have taken to solve log management at scale.
For robust observability, it is critical to have the three important telemetry signals: logs, metrics, and traces under a single pane of glass. Observability data is often huge, and a good solution needs to solve for ingestion, query, and storage.
We are continuously working to improve our users’ experience in managing each of these telemetry signals while also enabling a seamless correlation between them to drive contextual insights faster.
Contributor Highlight
Every month, contributors from our community help make SigNoz better. We want to thank the following contributors who made contributions to SigNoz last month 🤗


From the Blog
Distributed tracing is the method of tracking application requests as they flow from front-end devices to back-end services and databases in a distributed system. In modern-day software systems, the number of moving components in a distributed microservices architecture is huge.
Distributed tracing is a critical technology for performance monitoring of microservices-based architecture. Learn more about distributed tracing and how to implement it with OpenTelemetry from our guide.
Complete Guide to Distributed Tracing with OpenTelemetry - Part I
Complete Guide to Distributed Tracing with OpenTelemetry - Part II
Thank you for taking out the time to read this issue :) If you have any feedback or want any changes to the format, please create an issue.
Feel free to join our slack community and say hi! 👋