Making SigNoz the Most Powerful Open Source Distributed Trace Product - SigNal 27
"You cannot cross the sea merely by standing and staring at the water.” Ravindranath Tagore
Welcome to the 27th edition of our monthly product newsletter - SigNal 27! Our team shipped the much anticipated Trace and Logs Explorer. With the new Trace Explorer page, SigNoz is the most powerful open-source distributed trace product out there.

Let’s dive in to see what humans at SigNoz were up to in the month of July 2023.
What we shipped?
We shipped important upgrades to SigNoz, improving the UX and adding important features demanded by our users.
Latest release - v0.24.0
Earlier Releases - v0.23.1, v0.23.0
The most important upgrade is the new explorer pages for traces and logs.
At top-level, the explorer pages let you filter data based on certain attributes, apply aggregate operations, and group your results by attributes like service name, container ID, trace ID, span ID, etc.
Trace Explorer Page
We have shipped a new Trace Explorer page. It comes with a powerful query builder and different visualization options.
The query builder will help you build advanced queries on your trace data with the help of filter, group by, and various aggregate options. You can also add multiple queries and create formulas to find exactly what you want.
It also comes with multiple views - List View, Traces, Time series, and Table.
List View - List view shows the list of spans in a simple tabular format with options for customizing columns.
Traces - The traces tab shows you a list of root spans and the number of spans it has. A root span is a span that does not have a parent span.
Time series - The time series tab helps you visualize your trace data through charts. You can then add this chart as a panel into any of your existing or new dashboards.
Table - See things like the total number of spans in the table view.
Here’s a quick demo of the new Trace Explorer page.
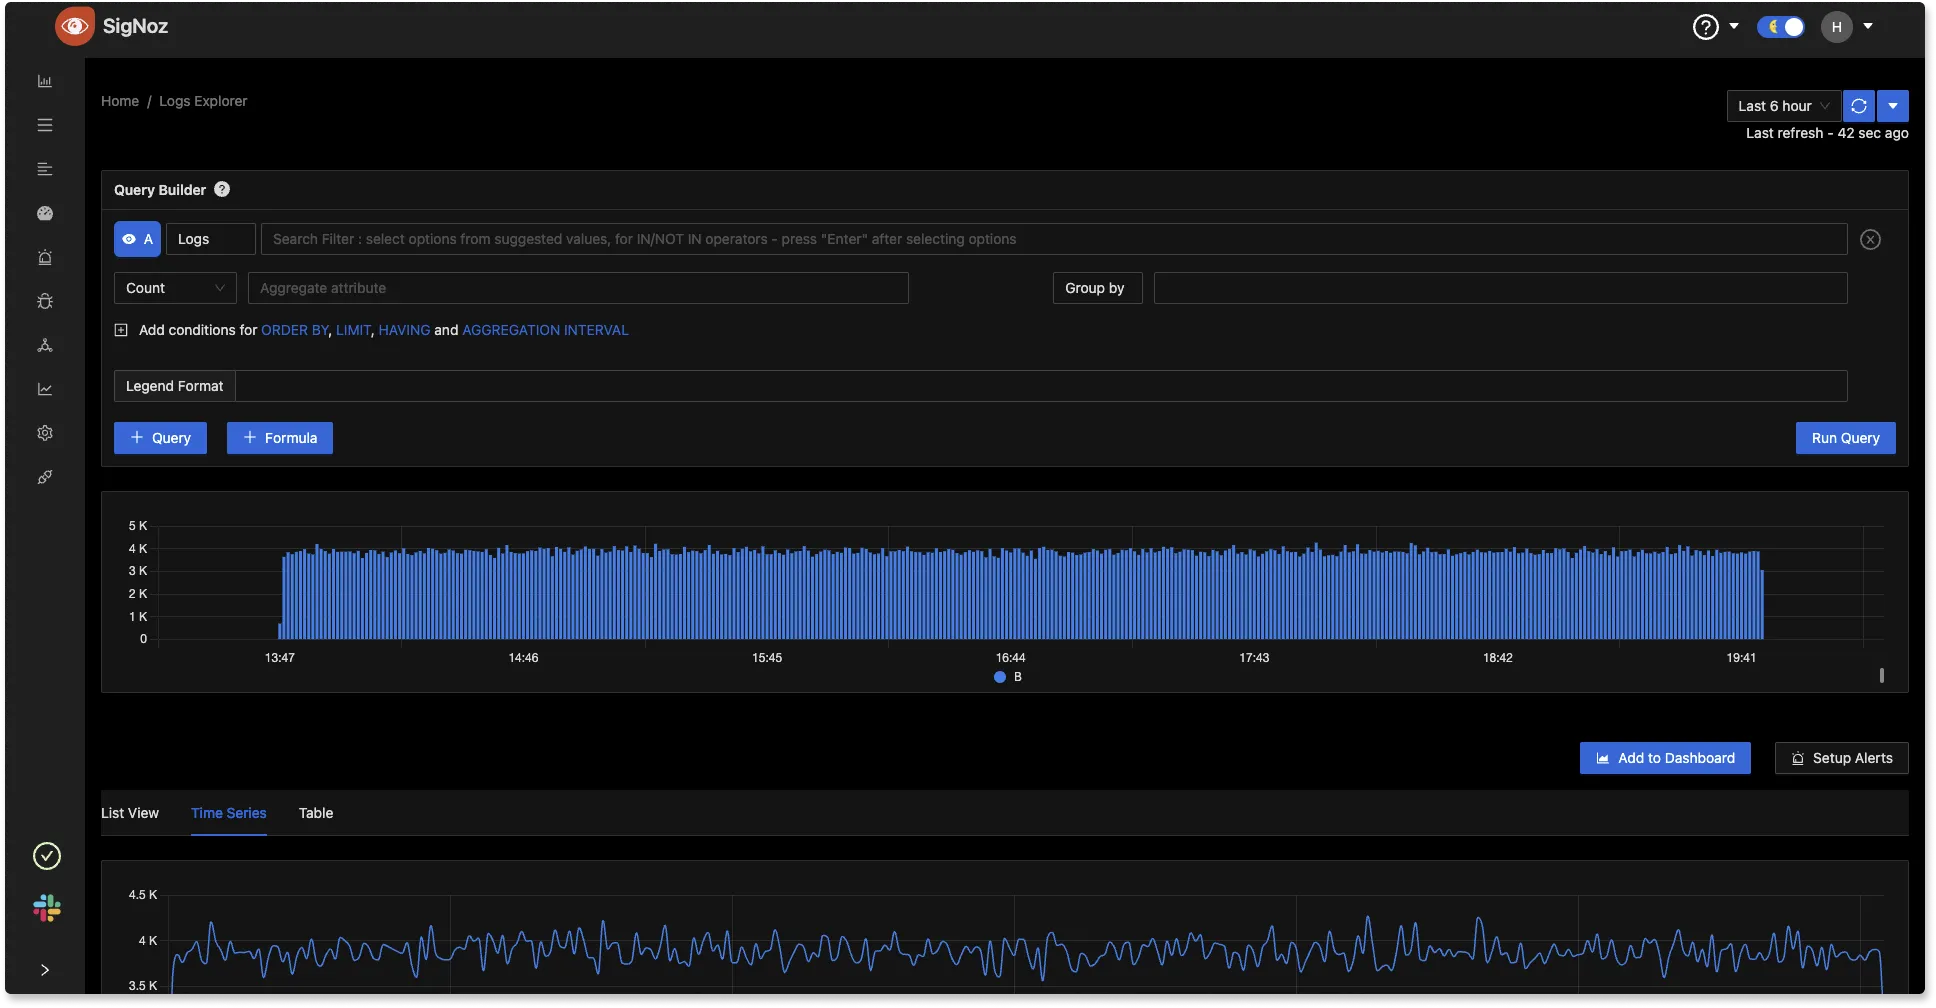
Logs Explorer Page
Similarly, the newly shipped Logs Explorer page will help you build powerful queries on your logs data. It comes with three views - List View, Time Series, and Table.
The charts can be directly added to any existing or new dashboards. You can also set up alerts directly from the logs explorer page.
Support for cumulative and delta metrics
We now support both cumulative and delta metrics from OpenTelemetry data in SigNoz. In a delta metric, a value measures the change in a time interval. In a cumulative metric, the value constantly increases over time.
Delta metrics are more efficient than cumulative metrics in certain use cases. Support for both cumulative and delta metrics will enable our users to cover more use cases from their observability data.
You can read more about it from the PR.
Improved User Experience
We also shipped other important upgrades to improve the user experience. Some noteworthy PRs are:
What’s upcoming?
Apdex Score in SigNoz APM
The Apdex methodology helps in reporting user satisfaction for application response times. Users can use the Apdex score to evaluate their application performance which will be available in SigNoz APM charts.
You can read more about Apdex here.
In-context logs and shareable link for a log line
You will be able to share links to individual log lines in our upcoming releases. We want to make it easier for our users to collaborate. The shareable link will also help users gather more context by making logs in the same time range accessible.
Enable Sampling without affecting APM metrics
Observability data is often huge, and it might get costly. Sampling plays an important role in controlling observability costs. We are working on enabling sampling for OpenTelemetry trace data without affecting the APM metrics like request rate, latency, error rates, etc.
Before the trace data is sampled, we will calculate the APM metrics and store it.
SigNoz News
SigNoz at Kubernetes Community Days Bengaluru
We attended Kubernetes Community Days held in Bengaluru. Pranay presented a talk on “Automatic logs, metrics, and traces in K8s using OpenTelemetry and SigNoz”.
OpenTelemetry offers a Kubernetes operator that manages OpenTelemetry Collector and auto-instrumentation of applications deployed using k8s. It helps you get started with observability with minimal code changes.
Watch the full talk here. 👇
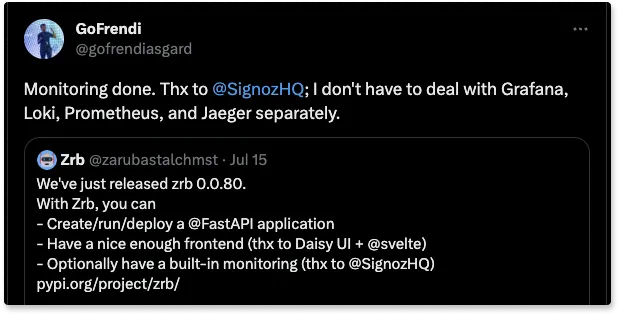
Community adoption of SigNoz as the built-in monitoring tool
It’s great to see the community adopting SigNoz as a built-in monitoring tool. Check out how a user integrated SigNoz to fulfill monitoring requirements in a FastAPI application starter pack.
OpenTelemetry End-user Group Discussion
The team at SigNoz facilitates the monthly OpenTelemetry End-user group discussions for the APAC region. The OTel end-user group discussion is a place where you can discuss challenges related to OpenTelemetry implementations and learn from other OpenTelemetry users in a vendor-neutral space.
In our July session, we discussed the advantages of using auto-instrumentation while getting started with OpenTelemetry. We also discussed things to keep in mind before starting with OpenTelemetry.
If you wish to participate in the next APAC end-user session, please register on our website.
We’re Hiring!
We’re hiring the next set of rockstars to take SigNoz to the next level. You can look at open roles here.
If you know someone in your network who will be a good fit for SigNoz, please refer them.
From the Blog
In observability, there is always a debate about building your observability stack against using a SaaS tool. OpenTelemetry is a free, open-source standard that lets you generate and collect telemetry signals like logs, metrics, and traces. Once the data is collected, should you send it to your own database or a SaaS tool?
In this blog, Nica talks about whether it’s a good idea to DIY your OpenTelemetry monitoring.
Should you DIY your Opentelemetry Monitoring? | SigNoz
Thank you for taking out the time to read this issue :) If you have any feedback or want any changes to the format, please create an issue
Feel free to join our Slack community and say hi! 👋