Improved Dashboard Performance, Better Trace View UX & New Logs Processors - SigNal 32
"You can knock me down, but I get up twice as strong.”
-Lewis Hamilton
Welcome to the last SigNal of 2023! 12 months of building and shipping things to make open-source observability available to teams of all sizes. What a great journey it has been for Team SigNoz in the year 2023.
We crossed some great milestones - raised $6.5MN to supercharge our growth, more than 15,000 Github stars, and 8.6 million Docker downloads. And the best part of our journey has been building with our community. It’s been great to see community members taking SigNoz to places that we never imagined, and it’s great to see the impact SigNoz is having on engineering teams.
Let’s see what the humans of SigNoz did in the month of December 2023.
What we shipped?
Latest release - v0.36.0
Previous Releases - v0.35.1, v0.35.0, v0.34.4
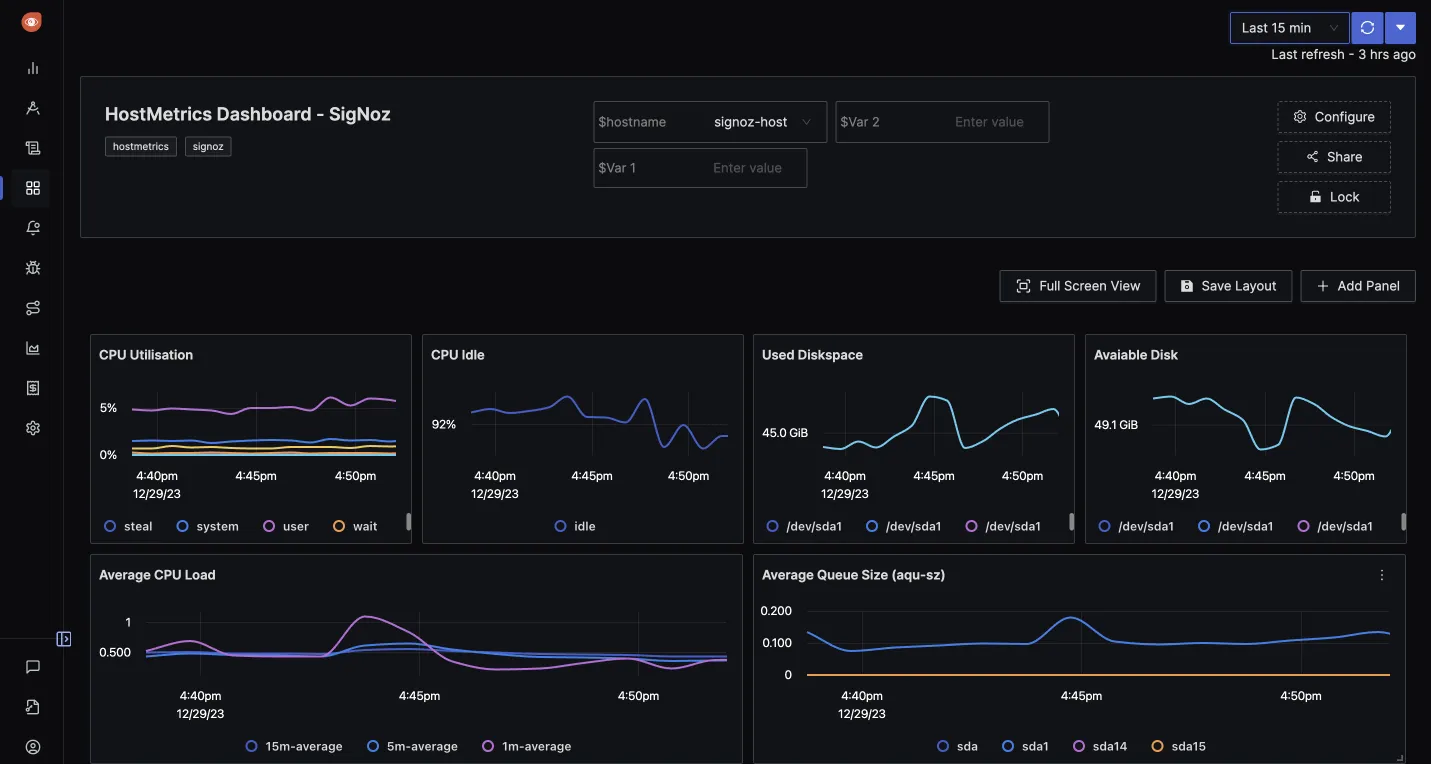
Improved Dashboard and Charts Performance
Our team has shipped multiple improvements to improve dashboard and chart performance in SigNoz. Users can expect faster render times and an improved overall user experience. Our dashboard section handles a lot of data in the UI, and we want our users to have a seamless experience while analyzing this data across different time ranges.
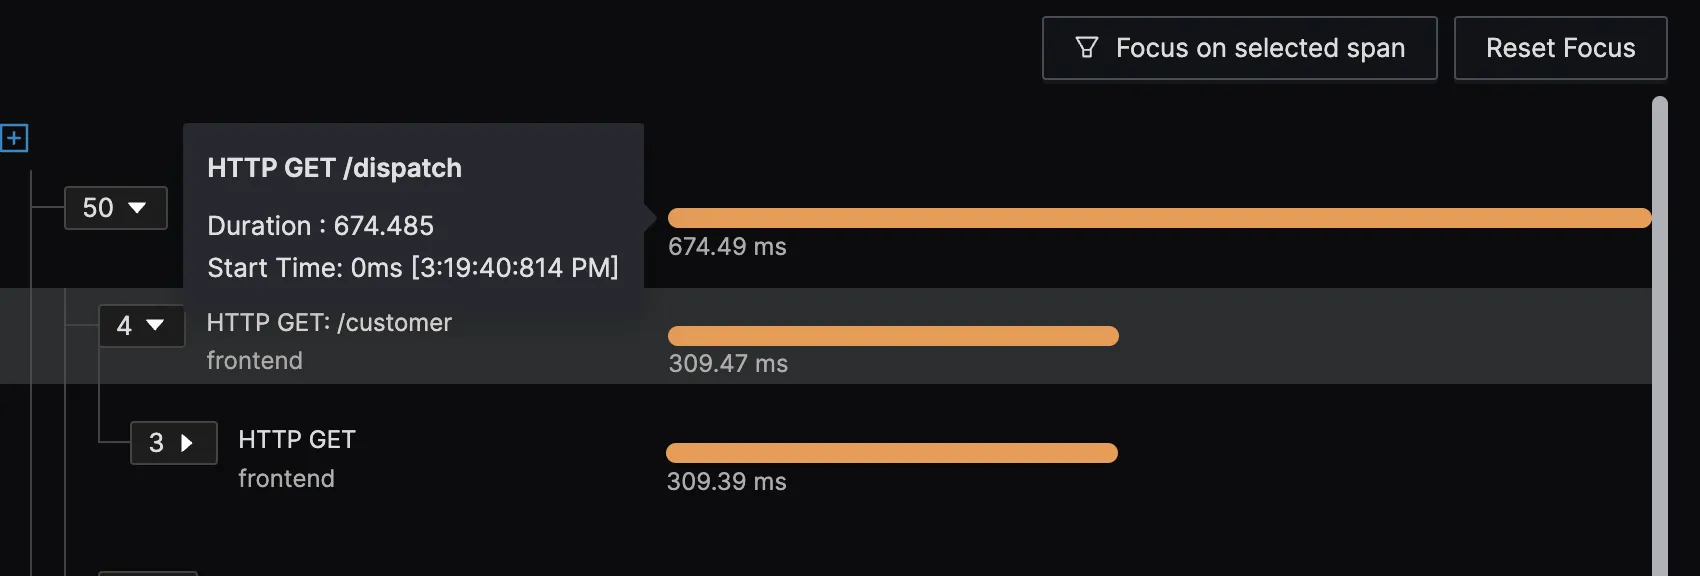
Improved User Experience in Trace View
We have shipped multiple improvements to make the user experience in Trace View better. You can now see details like the duration and start time of a single span by hovering above it. This will help users analyze flamegraphs better.
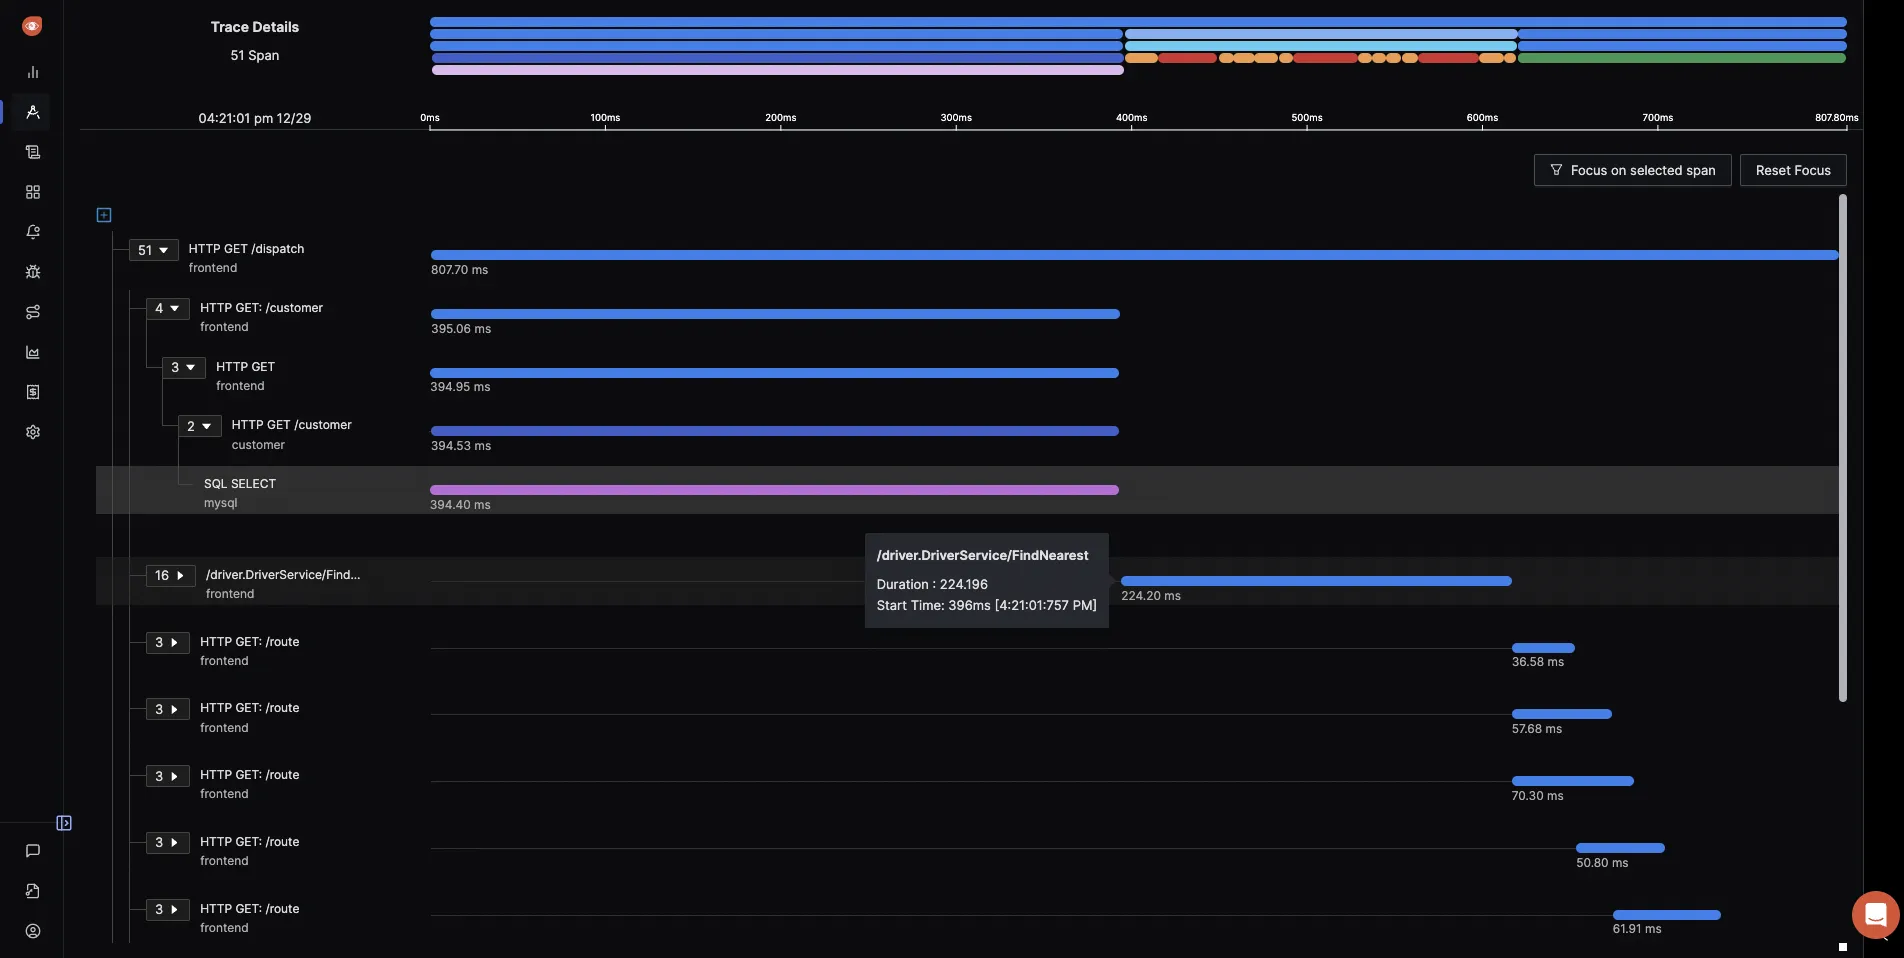
You can also now see flamegraphs in full view by collapsing the left-hand side menu bar and right-hand side attributes panel.
We have also improved the user experience of switching between the table view of spans and the flamegraphs view by introducing persistence of sorting and page. Now, when you switch between these views, the table view will be maintained if you have applied some sorting or you’re on a particular page.
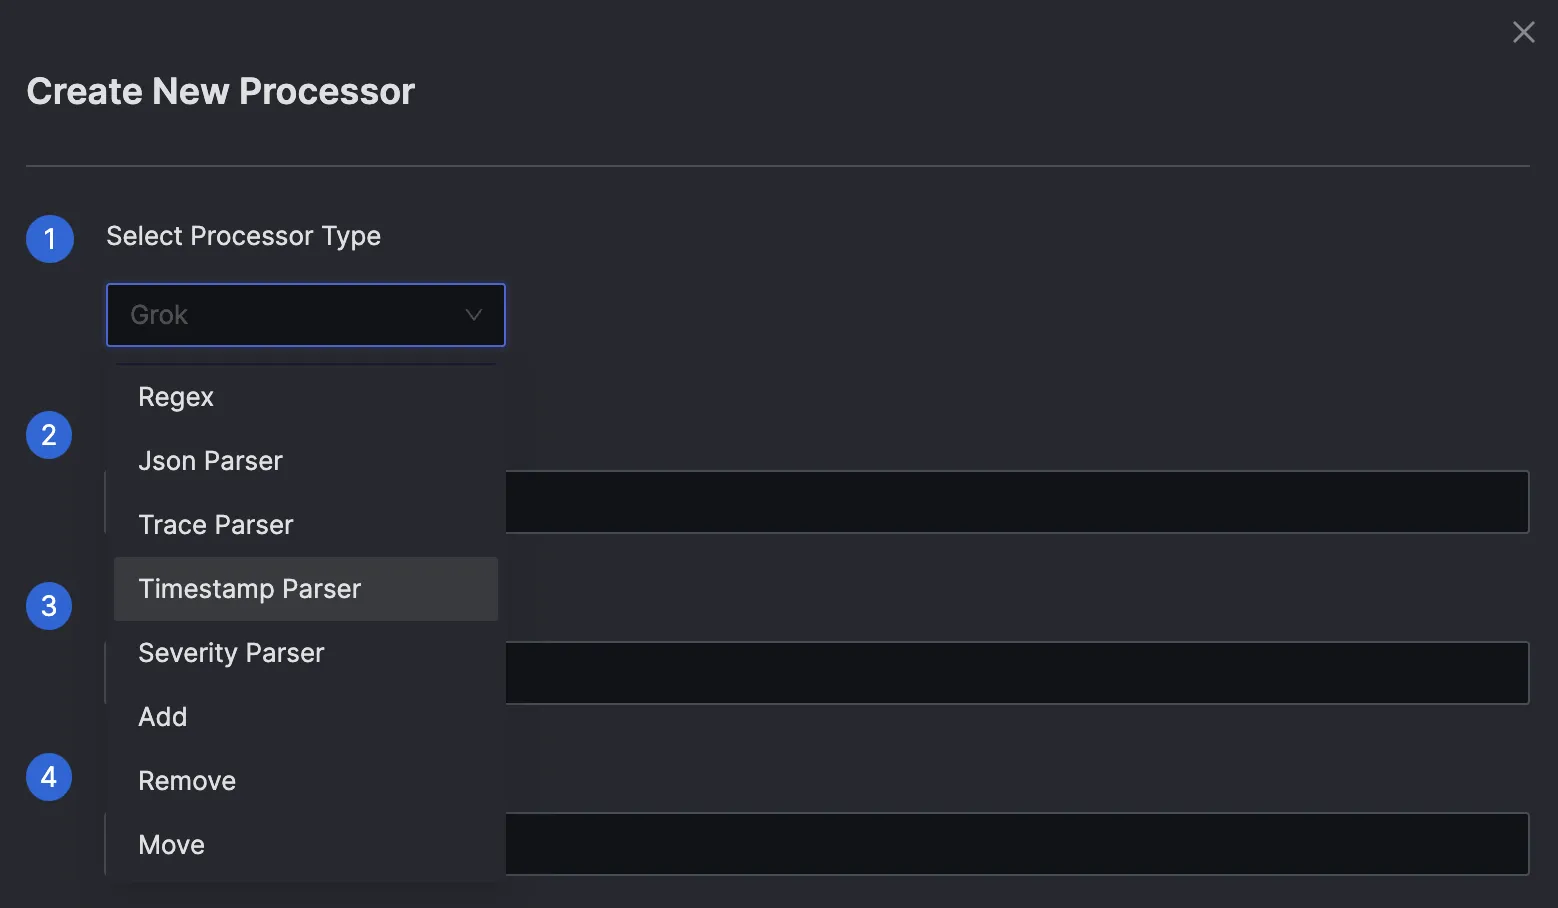
Improved Logs Management with new Parsing Processors
We added more parsers in our logs pipeline feature to make logs parsing more easier. We shipped the following parsers:
- Severity Parser - The severity parsing processor can be used to parse log severity out of a log field.
- Timestamp Parser - The timestamp parsing processor can be used to parse log timestamp out of a log field.
These parsers will make starting with logs much easier in SigNoz.
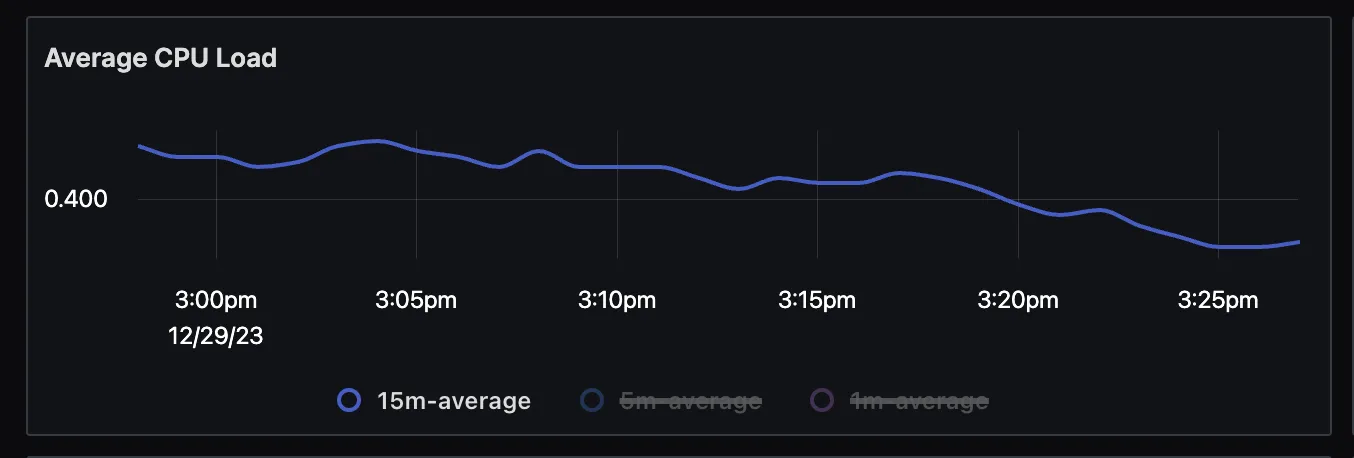
Improved user experience in dashboards and charts
We have shipped some improvements in the user experience of charts. You will now be able to highlight and just see a single line graph in a chart with multiple line graphs. You just need to click on the legend of the graph you want to see.
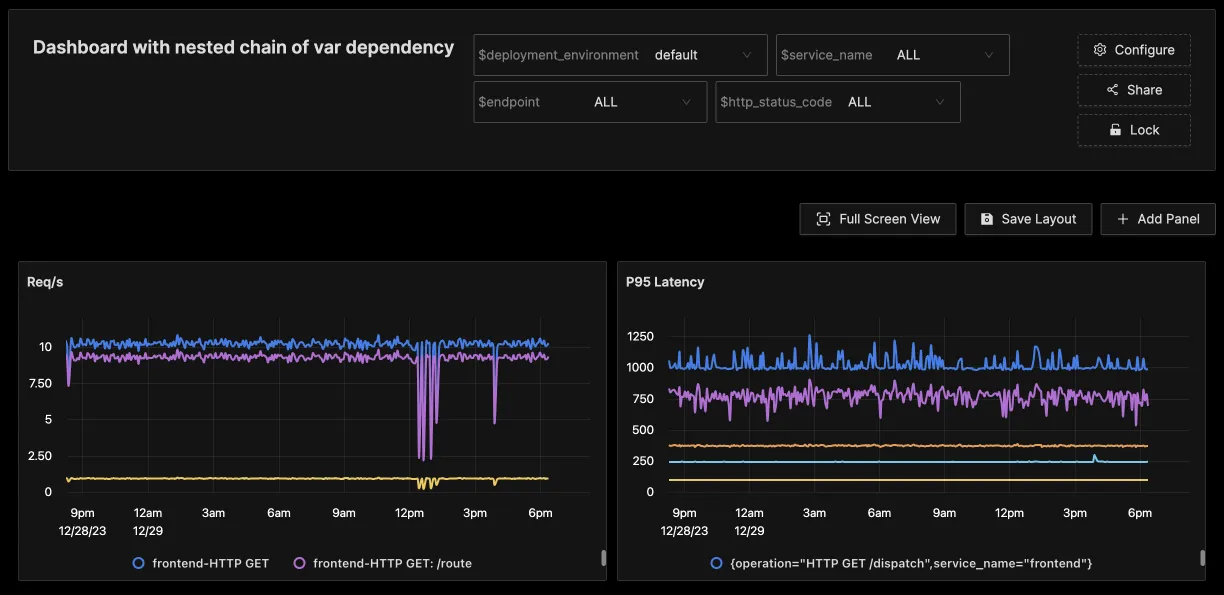
Added Variable re-arrange support
Variables are a powerful feature in the Dashboards tab of SigNoz. It can help you to filter your charts based on deployment environment, service, status code, etc. In SigNoz dashboards, you can create a chain of variables to filter data in your dashboards. Now, you have an option to re-arrange the sequence of variables in any sequence that makes sense for your data.
For example, in the screenshot shared below, you can set up a chain of variables to filter data on:
- deployment_environment
- service_name
- endpoint
- http_status_code
SigNoz News
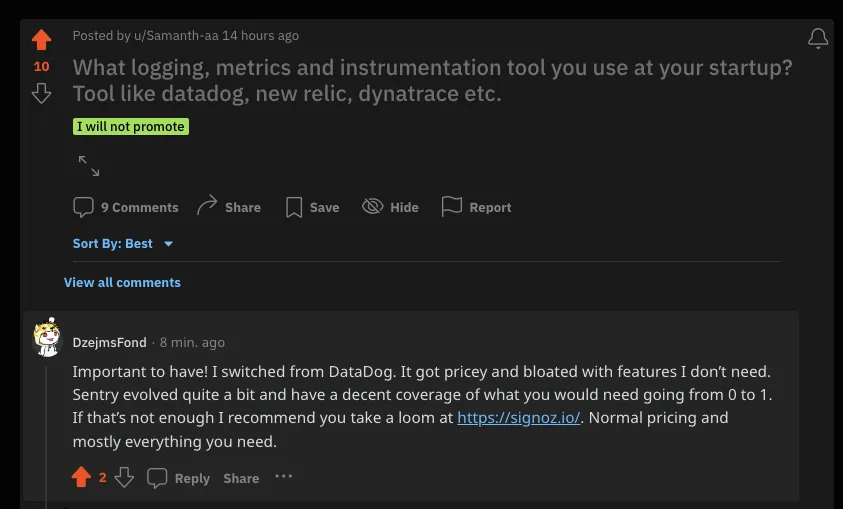
User love 🤗
It’s good to see our users becoming advocates of using SigNoz and getting value. We have built a strong open-source alternative to products like Datadog and New Relic.
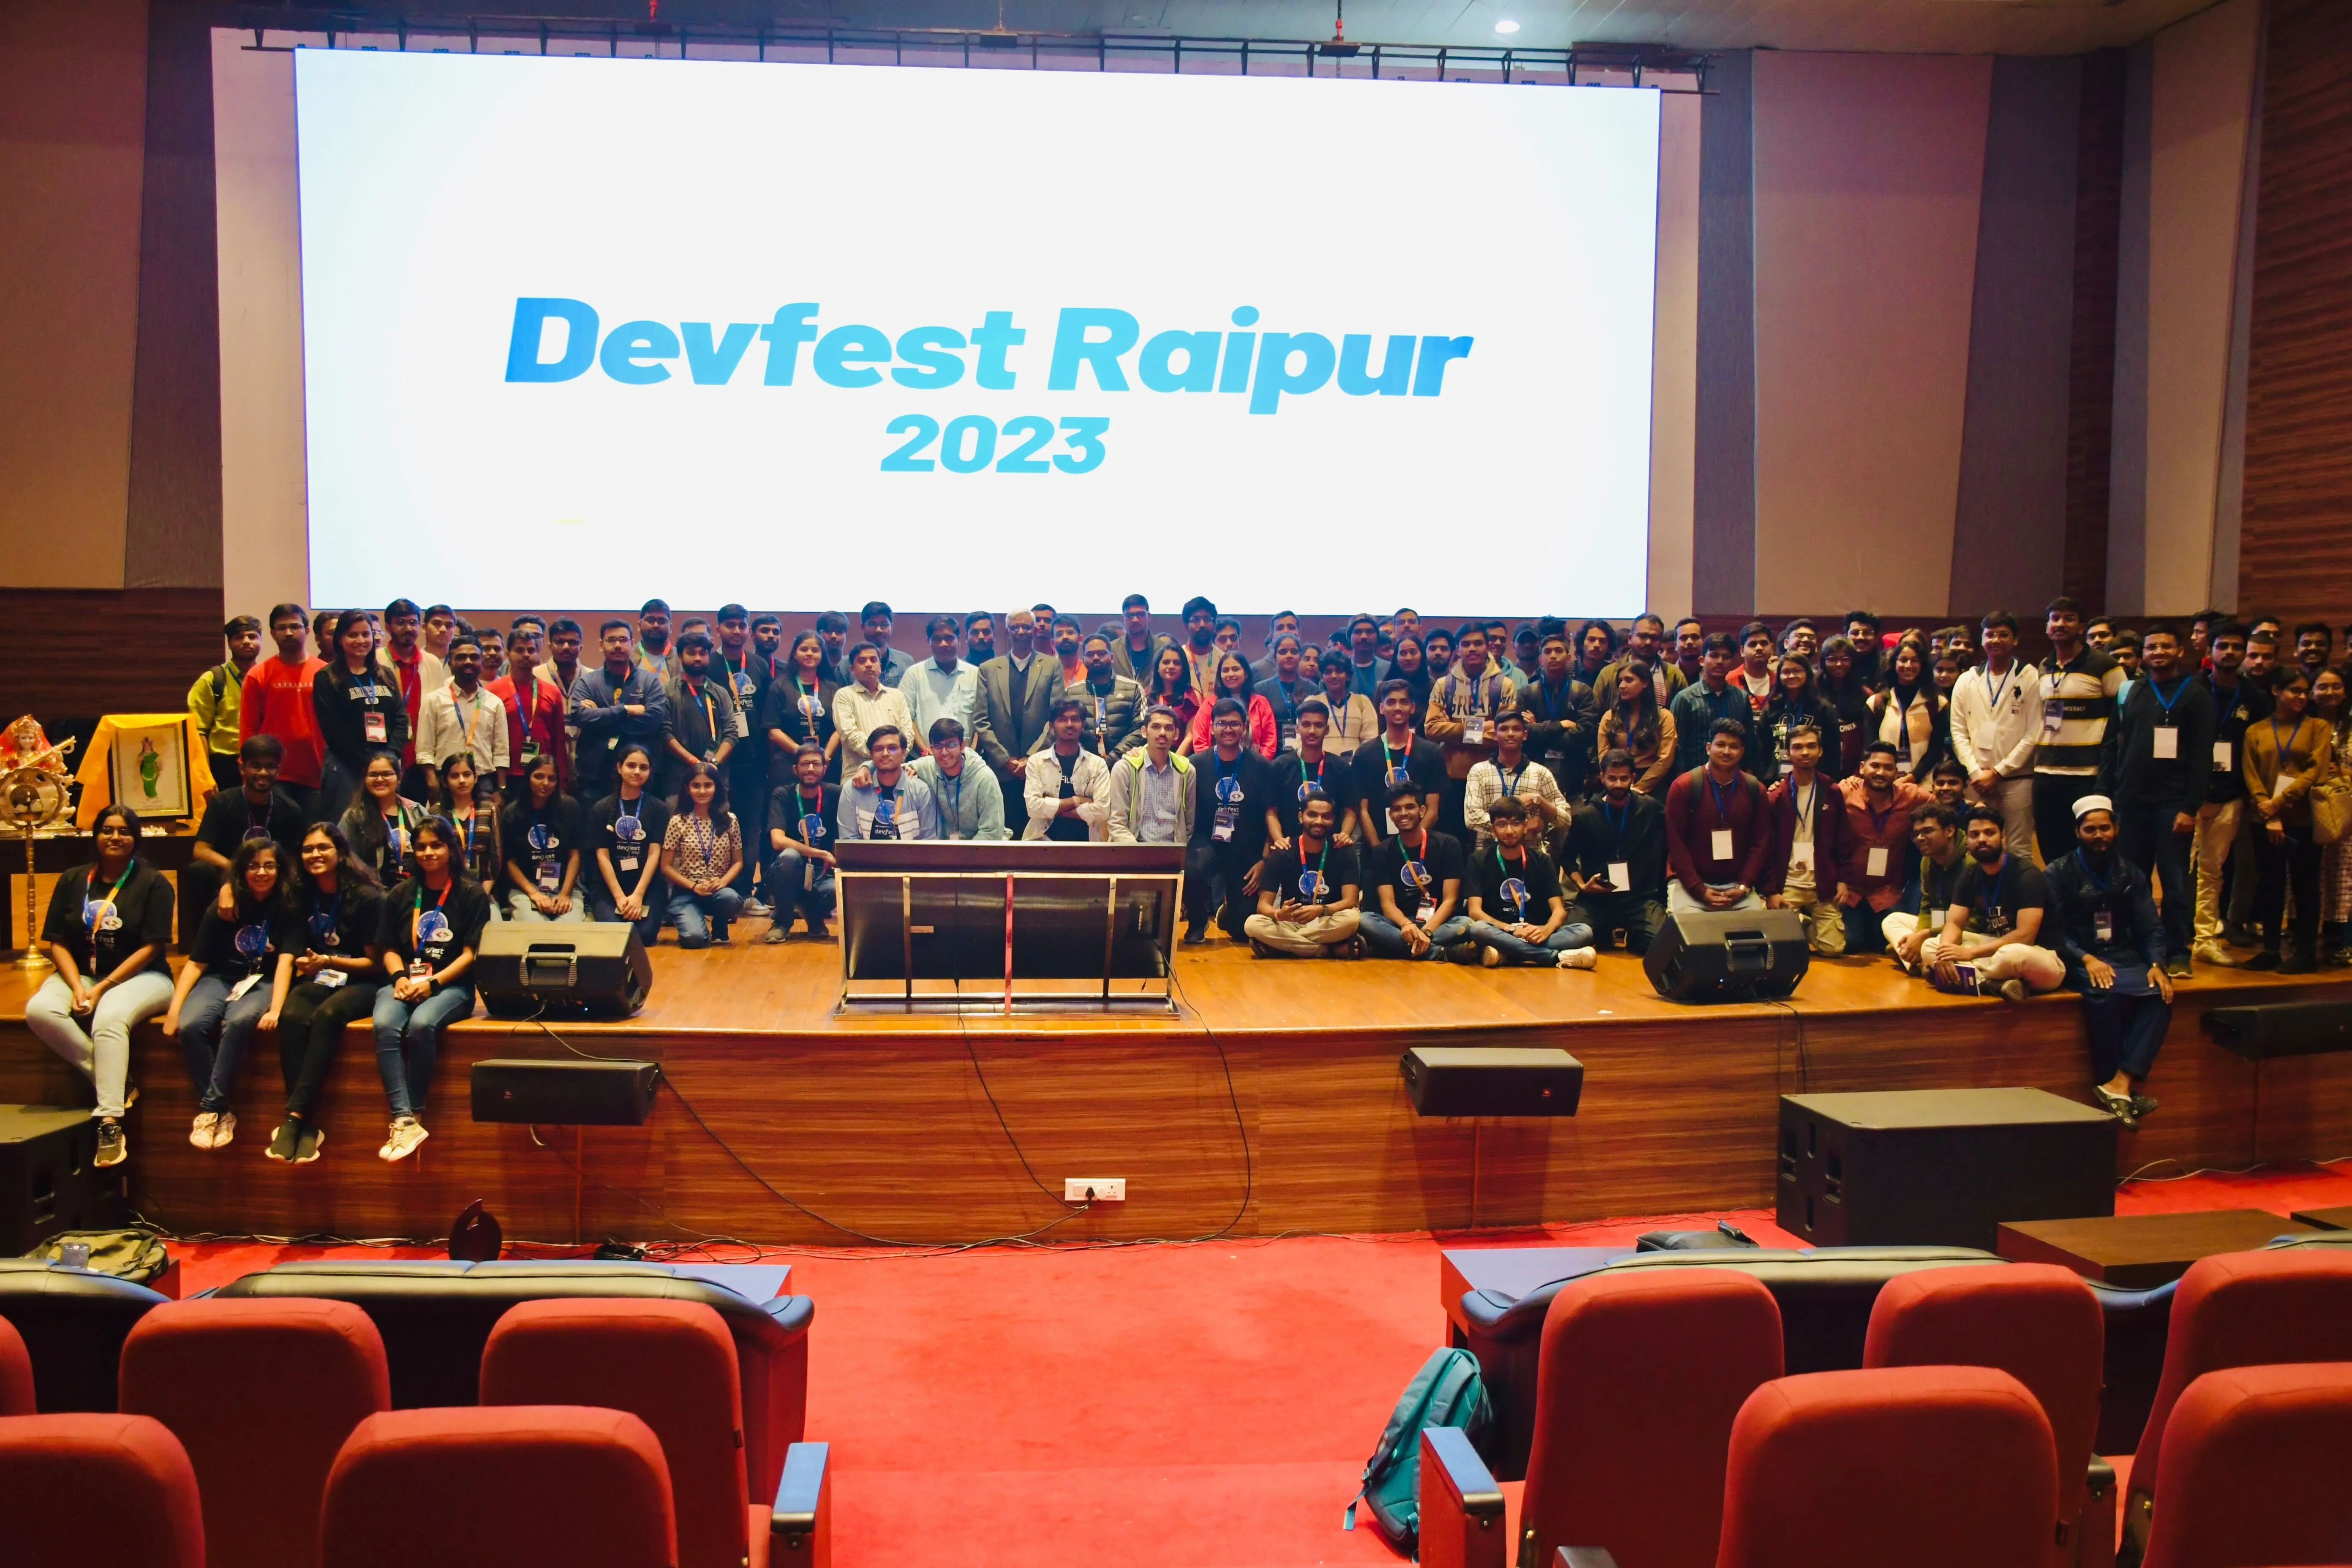
Talk about SigNoz and OpenTelemetry at Devfest Raipur
Our awesome community member, Yash R. Verma presented a talk on adoption of open standards in observability. He talked about the ease of getting started with OpenTelemetry and SigNoz. Kudos to Yash 🙌
Twitter Shoutouts
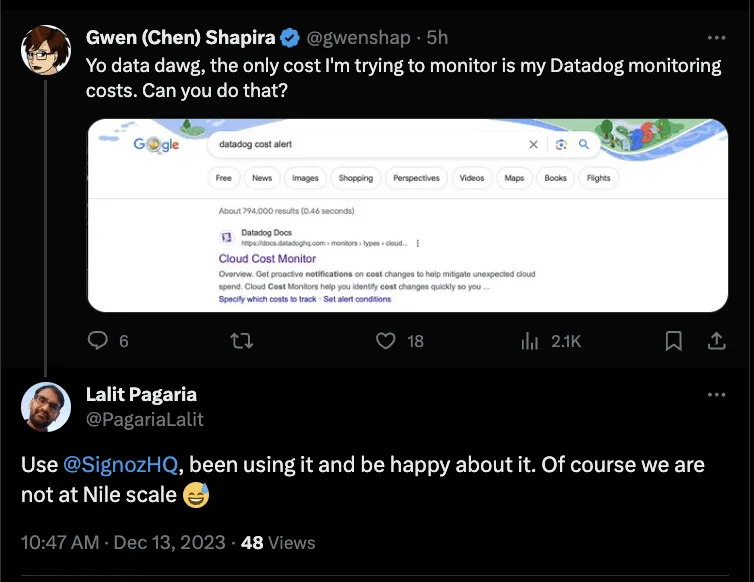
Cost is a big issue in the observability domain. At SigNoz, we are solving it by having simple usage-based pricing, no special charges for custom metrics, and providing our users the capability to add unlimited user seats.
It’s nice to see our users resonate with the value we provide and be happy about their experience with SigNoz.
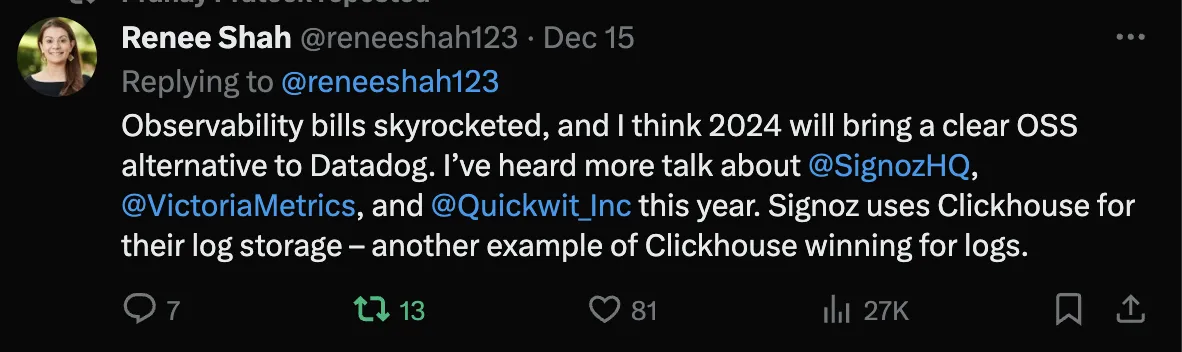
Yes, we agree with Renee Shah from Amplify Partners. It's high time that developers no longer have to compromise on user experience when choosing open source monitoring tools. At SigNoz, we are dedicated to creating a seamless experience with three signals integrated under a single pane.
Contributor highlight
Every month, contributors from our community help make SigNoz better. We want to thank the following contributors who made contributions to SigNoz last month 🤗


From the blog
Spring Boot has become one of the most popular frameworks for building micro-services in Java due to the focus on building business code and allowing the developers to focus less on building the supporting application server.
Spring Boot provides useful libraries like the Spring Boot Actuator and Micrometer to aid in monitoring. But in order to set up effective monitoring, you need to use a tool where you can send the monitoring data for storage and visualization. In the below tutorial, learn how you can set up monitoring for a Spring Boot application with OpenTelemetry and SigNoz.
Spring Boot Monitoring with Open-Source Tools
Thank you for taking out the time to read this issue :) If you have any feedback or want any changes to the format, please create an issue.
Feel free to join our Slack community and say hi! 👋