Amazon EKS Monitoring with OpenTelemetry [Step By Step Guide]
Effective EKS monitoring is crucial for maintaining the health and performance of containerized applications deployed in the cluster. In this tutorial, we will set up EKS monitoring with OpenTelemetry. We will build monitoring dashboards for node and pod-level metrics with data collected by OpenTelemetry. We will use SigNoz, an open-source OpenTelemetry-native APM, as a storage and visualization layer for setting up dashboards.

In this tutorial, we cover:
- Why is it important to monitor EKS Clusters
- Understanding EKS Metrics
- A Brief Overview of OpenTelemetry
- What is OpenTelemetry Collector?
- Key EKS Metrics Collected by OpenTelemetry
- Prerequisites
- Setting up SigNoz
- Setting Up OpenTelemetry Collector - SigNoz
- Monitoring with SigNoz Dashboard
- Conclusion
If you want to jump straight into implementation, start with this prerequisites section.
A Brief Overview of Kubernetes and Amazon EKS
Kubernetes orchestrates computing, networking, and storage for applications, enabling quick deployments, scalable operations, seamless feature rollouts, and smart resource allocation. Amazon EKS is a managed Kubernetes offering that takes full advantage of AWS’s EC2 offerings.
Kubernetes streamlines the deployment, scaling, and management of applications, and Amazon EKS offers a managed service that makes it easier to run Kubernetes on AWS by handling the complexities of Kubernetes infrastructure setup and maintenance.
Why is it important to monitor EKS Clusters
Monitoring EKS clusters is essential for early issue detection, resource optimization, and security enhancement and offers practical benefits such as:
- Resource Usage Analysis: Prevents overprovisioning or underprovisioning by tracking resource consumption metrics like CPU, Memory, IO, and filesystem free space.
- Improved Debugging: Accelerates issue identification and resolution, reducing MTTR and improving user experience.
- Performance Tuning: Identifies and resolves performance bottlenecks for optimal application operation. For example, we can monitor CPU throttling to ensure workloads have sufficient resources.
- Resource Forecasting: Predicts future resource needs based on usage patterns to facilitate smooth scaling and advance budgeting.
Understanding EKS Metrics
EKS metrics can generally be categorized into three levels: container-level metrics, pod-level metrics, and node-level metrics. These metrics provide a granular view of the pods and nodes' resource consumption and performance characteristics within an EKS cluster.
Container Level Metrics
Container Level Metrics are the most granular. They offer insights into specific containers of a pod by monitoring their CPU, memory utilization, and more.
Pod Level Metrics
A Pod consists of one or more containers. Pod-level metrics are aggregated container metrics on pod-name.
Pod Level Metrics gives insights into the performance and state of the individual pods that are running on the EKS cluster. These include CPU and memory utilization, disk I/O, network traffic, and more.
Node Level Metrics
A Node can contain one or more Pods: These are aggregated container metrics on node-name.
Node Level Metrics offer a broader view, focusing on the EKS cluster nodes themselves. These metrics are crucial for understanding the overall health and capacity of the cluster. They encompass node-specific data such as CPU and memory usage, disk capacity, and network I/O.
Before we set up monitoring of these metrics, let’s have a brief overview of OpenTelemetry and its components.
A Brief Overview of OpenTelemetry
OpenTelemetry is a set of APIs, SDKs, libraries, and integrations aiming to standardize the generation, collection, and management of telemetry data(logs, metrics, and traces). It is backed by the Cloud Native Computing Foundation and is the leading open-source project in the observability domain.
The data you collect with OpenTelemetry is vendor-agnostic and can be exported in many formats. Telemetry data has become critical in observing the state of distributed systems. With microservices and polyglot architectures, there was a need to have a global standard for generating observability data. OpenTelemetry aims to fill that space and is doing a great job at it thus far.
OpenTelemetry provides a component called OpenTelemetry Collector, which helps collect, process, and export data. In this tutorial, we will use the OpenTelemetry collector to collect metrics from AWS EKS.
What is OpenTelemetry Collector?
OpenTelemetry Collector is a stand-alone service provided by OpenTelemetry. It can be used as a telemetry-processing system with a lot of flexible configurations to collect and manage telemetry data.
It can understand different data formats and send it to different backends, making it a versatile tool for building observability solutions.
Read our complete guide on OpenTelemetry Collector
How does OpenTelemetry Collector collect data?
A receiver is how data gets into the OpenTelemetry Collector. Receivers are configured via YAML under the top-level receivers tag. There must be at least one enabled receiver for a configuration to be considered valid.
Here’s an example of an otlp receiver:
receivers:
  otlp:
    protocols:
      grpc:
      http:
An OTLP receiver can receive data via gRPC or HTTP using the OTLP format. There are advanced configurations that you can enable via the YAML file.
Here’s a sample configuration for an otlp receiver.
receivers:
  otlp:
    protocols:
      http:
        endpoint: "localhost:4318"
        cors:
          allowed_origins:
            - http://test.com
            # Origins can have wildcards with *, use * by itself to match any origin.
            - https://*.example.com
          allowed_headers:
            - Example-Header
          max_age: 7200
You can find more details on advanced configurations here.
After configuring a receiver, you must enable it. Receivers are enabled via pipelines within the service section. A pipeline consists of a set of receivers, processors, and exporters.
The following is an example pipeline configuration:
service:
  pipelines:
    metrics:
      receivers: [otlp, prometheus]
      exporters: [otlp, prometheus]
    traces:
      receivers: [otlp, jaeger]
      processors: [batch]
      exporters: [otlp, zipkin]
Now that you understand how OpenTelemetry collects telemetry data, let’s go through some key metrics collected by OpenTelemetry for EKS.
Key EKS Metrics Collected by OpenTelemetry
OpenTelemetry can collect a wide range of metrics, which are critical for monitoring the performance and health of EKS clusters. The following are some key metrics that can be captured:
- CPU Metrics: Metrics such as
k8s.node.cpu.utilization,k8s.pod.cpu.time, andcontainer.cpu.utilizationprovide data on CPU usage and time spent by nodes, pods, and containers respectively. - Memory Metrics: Metrics like
k8s.node.memory.available,k8s.pod.memory.usageandcontainer.memory.availablereveal the memory available and used by nodes, pods, or containers. - Disk Metrics: Metrics such as
k8s.node.filesystem.usage,container.filesystem.available, andk8s.pod.filesystem.availableoffer insights into the disk space used and available on nodes, pods, or containers. - Network Metrics: Metrics like
k8s.node.network.ioandk8s.pod.network.errorscapture the volume of network I/O and the number of network errors. - Uptime Metrics: Metrics like
k8s.node.uptime,k8s.pod.uptime, andcontainer.uptimecapture the time since node, pod, or container started, respectively.
Resource Attributes for EKS Metrics
Resource attributes are key-value pairs that provide context to the metrics collected. They help in filtering and querying metrics data so that it can be more effectively visualized and analyzed. For EKS, some of the resource attributes that can be collected include:
k8s.node.name: The name of the node in the EKS cluster.k8s.pod.uid: A unique identifier for the pod.k8s.pod.name: The name of the pod.k8s.namespace.name: The namespace in which the pod is running.k8s.container.name: The name of the container running in the runtime.
A list of all metric definitions can be found here.
Prerequisites
- An EKS cluster. If you don’t have an EKS cluster, please create one using this guide.
kubectlinstalled and logged in.- helm
- SigNoz Cloud Account
Setting up SigNoz
You need a backend to which you can send the collected data for monitoring and visualization. SigNoz is an OpenTelemetry-native APM that is well-suited for visualizing OpenTelemetry data.
SigNoz cloud is the easiest way to run SigNoz. You can sign up here for a free account and get 30 days of unlimited access to all features.
You can also install and self-host SigNoz yourself. Check out the docs for installing self-host SigNoz.
Setting Up OpenTelemetry Collector - SigNoz
Deploying the OpenTelemetry Collector can be approached in two distinct ways, depending on your infrastructure and familiarity with OpenTelemetry:
- SigNoz Managed Helm Charts: Ideal for most users seeking a streamlined setup with optimized defaults.
- Vanilla OpenTelemetry Helm Charts (Advanced): Suitable for advanced users with pre-existing infrastructure or custom requirements.
Installing with SigNoz Managed Helm Charts
SigNoz provides Helm charts that package OpenTelemetry Collectors in a flavor optimized for SigNoz users. It simplifies the installation with some defaults.
Step 1: Install SigNoz Helm Chart
To set up the OpenTelemetry Collector for SigNoz, you'll first need your ingestion key and the specific region your instance is hosted in. This information is vital for configuring the collector to send data to your SigNoz instance securely. You can retrieve these details from your SigNoz settings page.
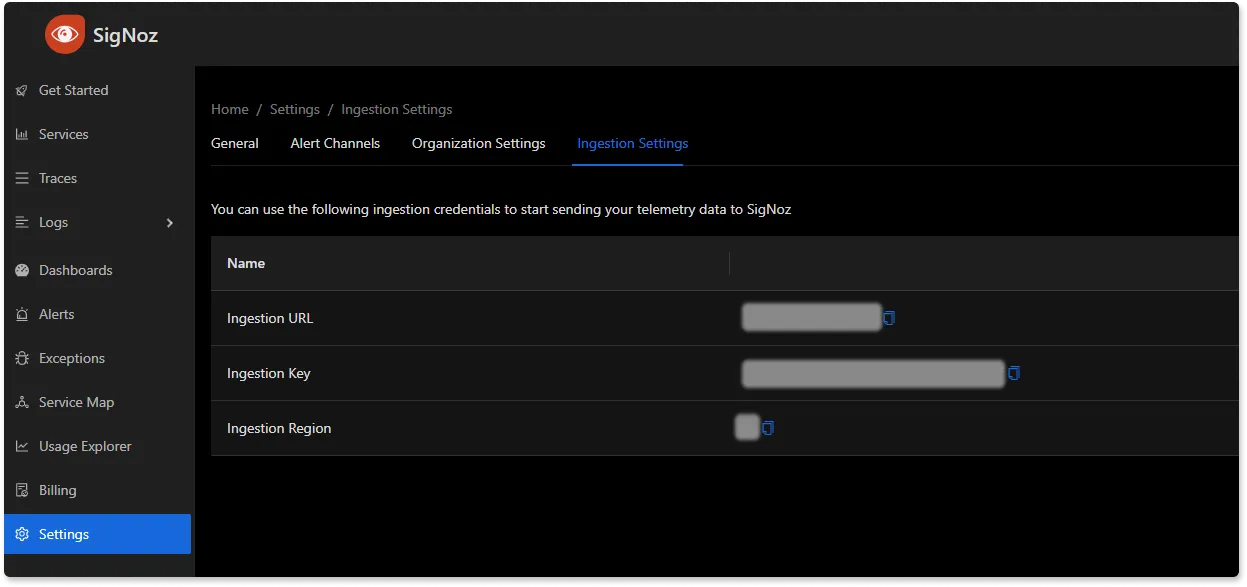
Once you have your ingestion key and region, use the following commands to add the SigNoz Helm repository and install the OpenTelemetry Collector in your Kubernetes cluster:
helm repo add signoz https://charts.signoz.io
helm install -n signoz  --create-namespace kubelet-otel signoz/k8s-infra \
--set signozApiKey=<ingestionKey> --set otelCollectorEndpoint="ingest.<region>.signoz.cloud:443" --set otelInsecure=false
Replace <ingestionKey> with the key you obtained from your settings page and <region> with the region information.
After running the install command, you should see an output confirming that the Helm chart has been deployed.

Step 2: Verifying and Debugging Output
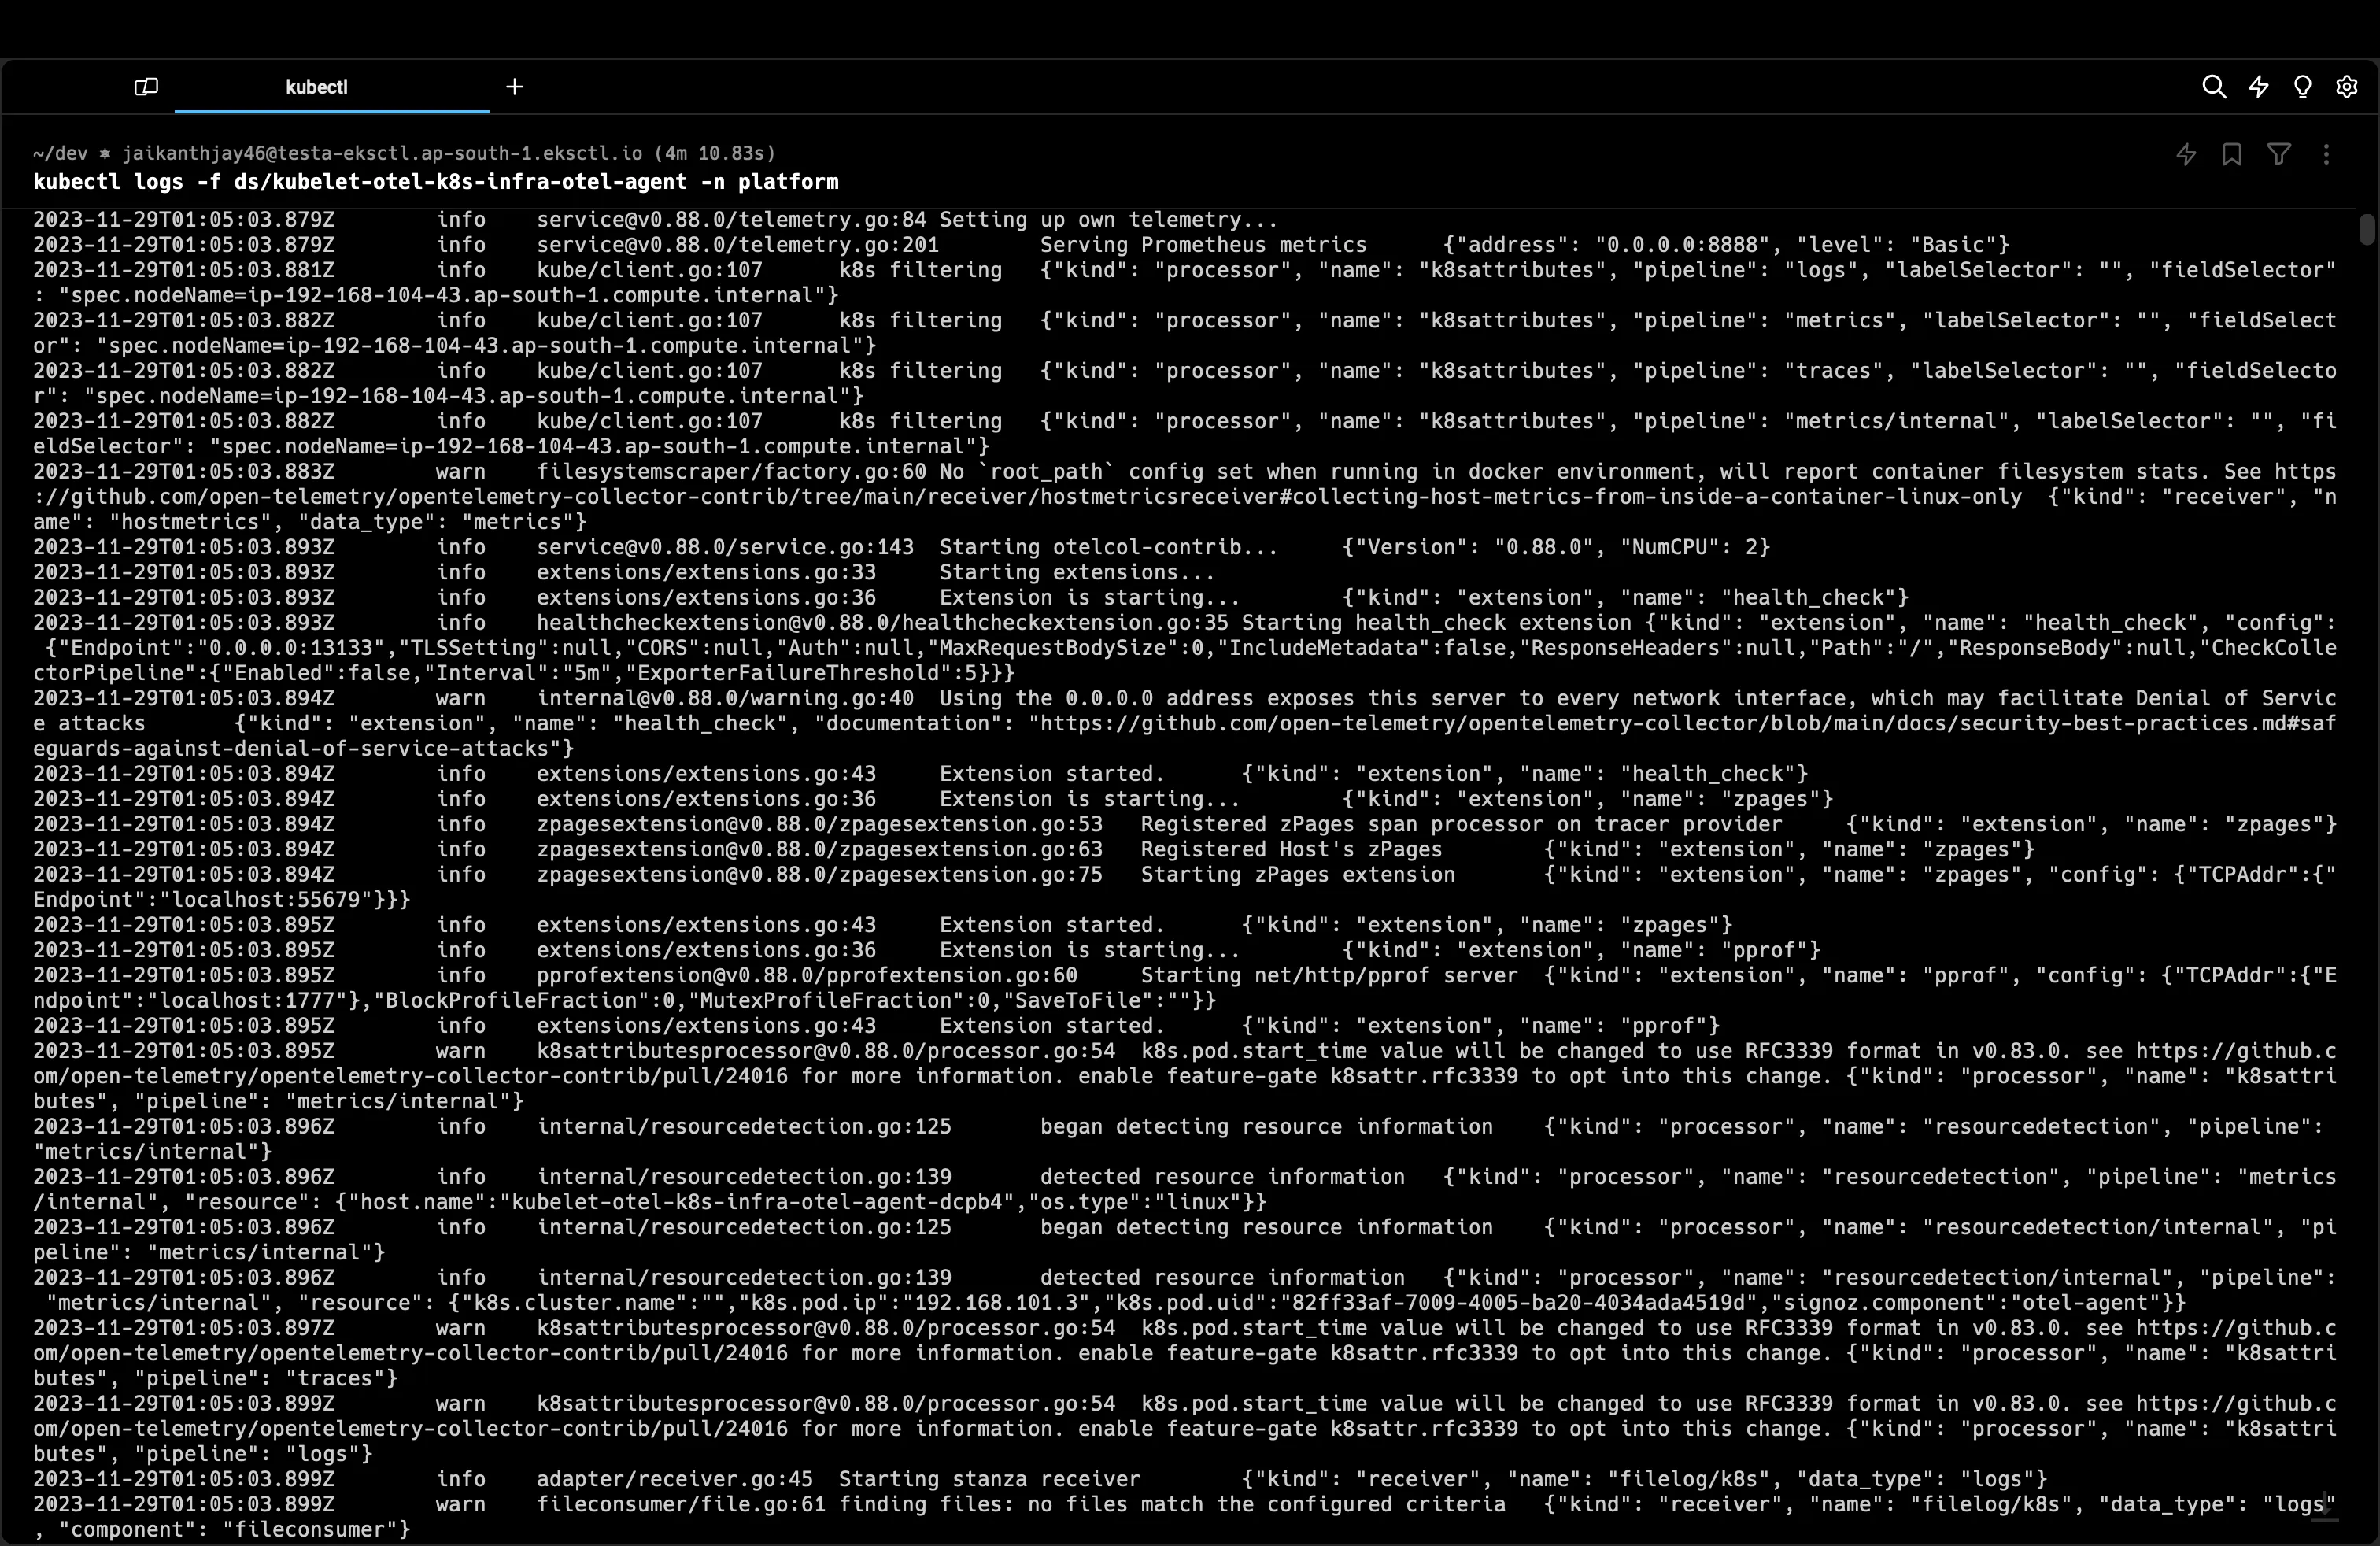
Viewing OpenTelemetry Agent Logs
To check the logs of the OpenTelemetry agent, execute:
kubectl logs -f -n signoz -l app.kubernetes.io/component=otel-agent
Checking Collector Configuration
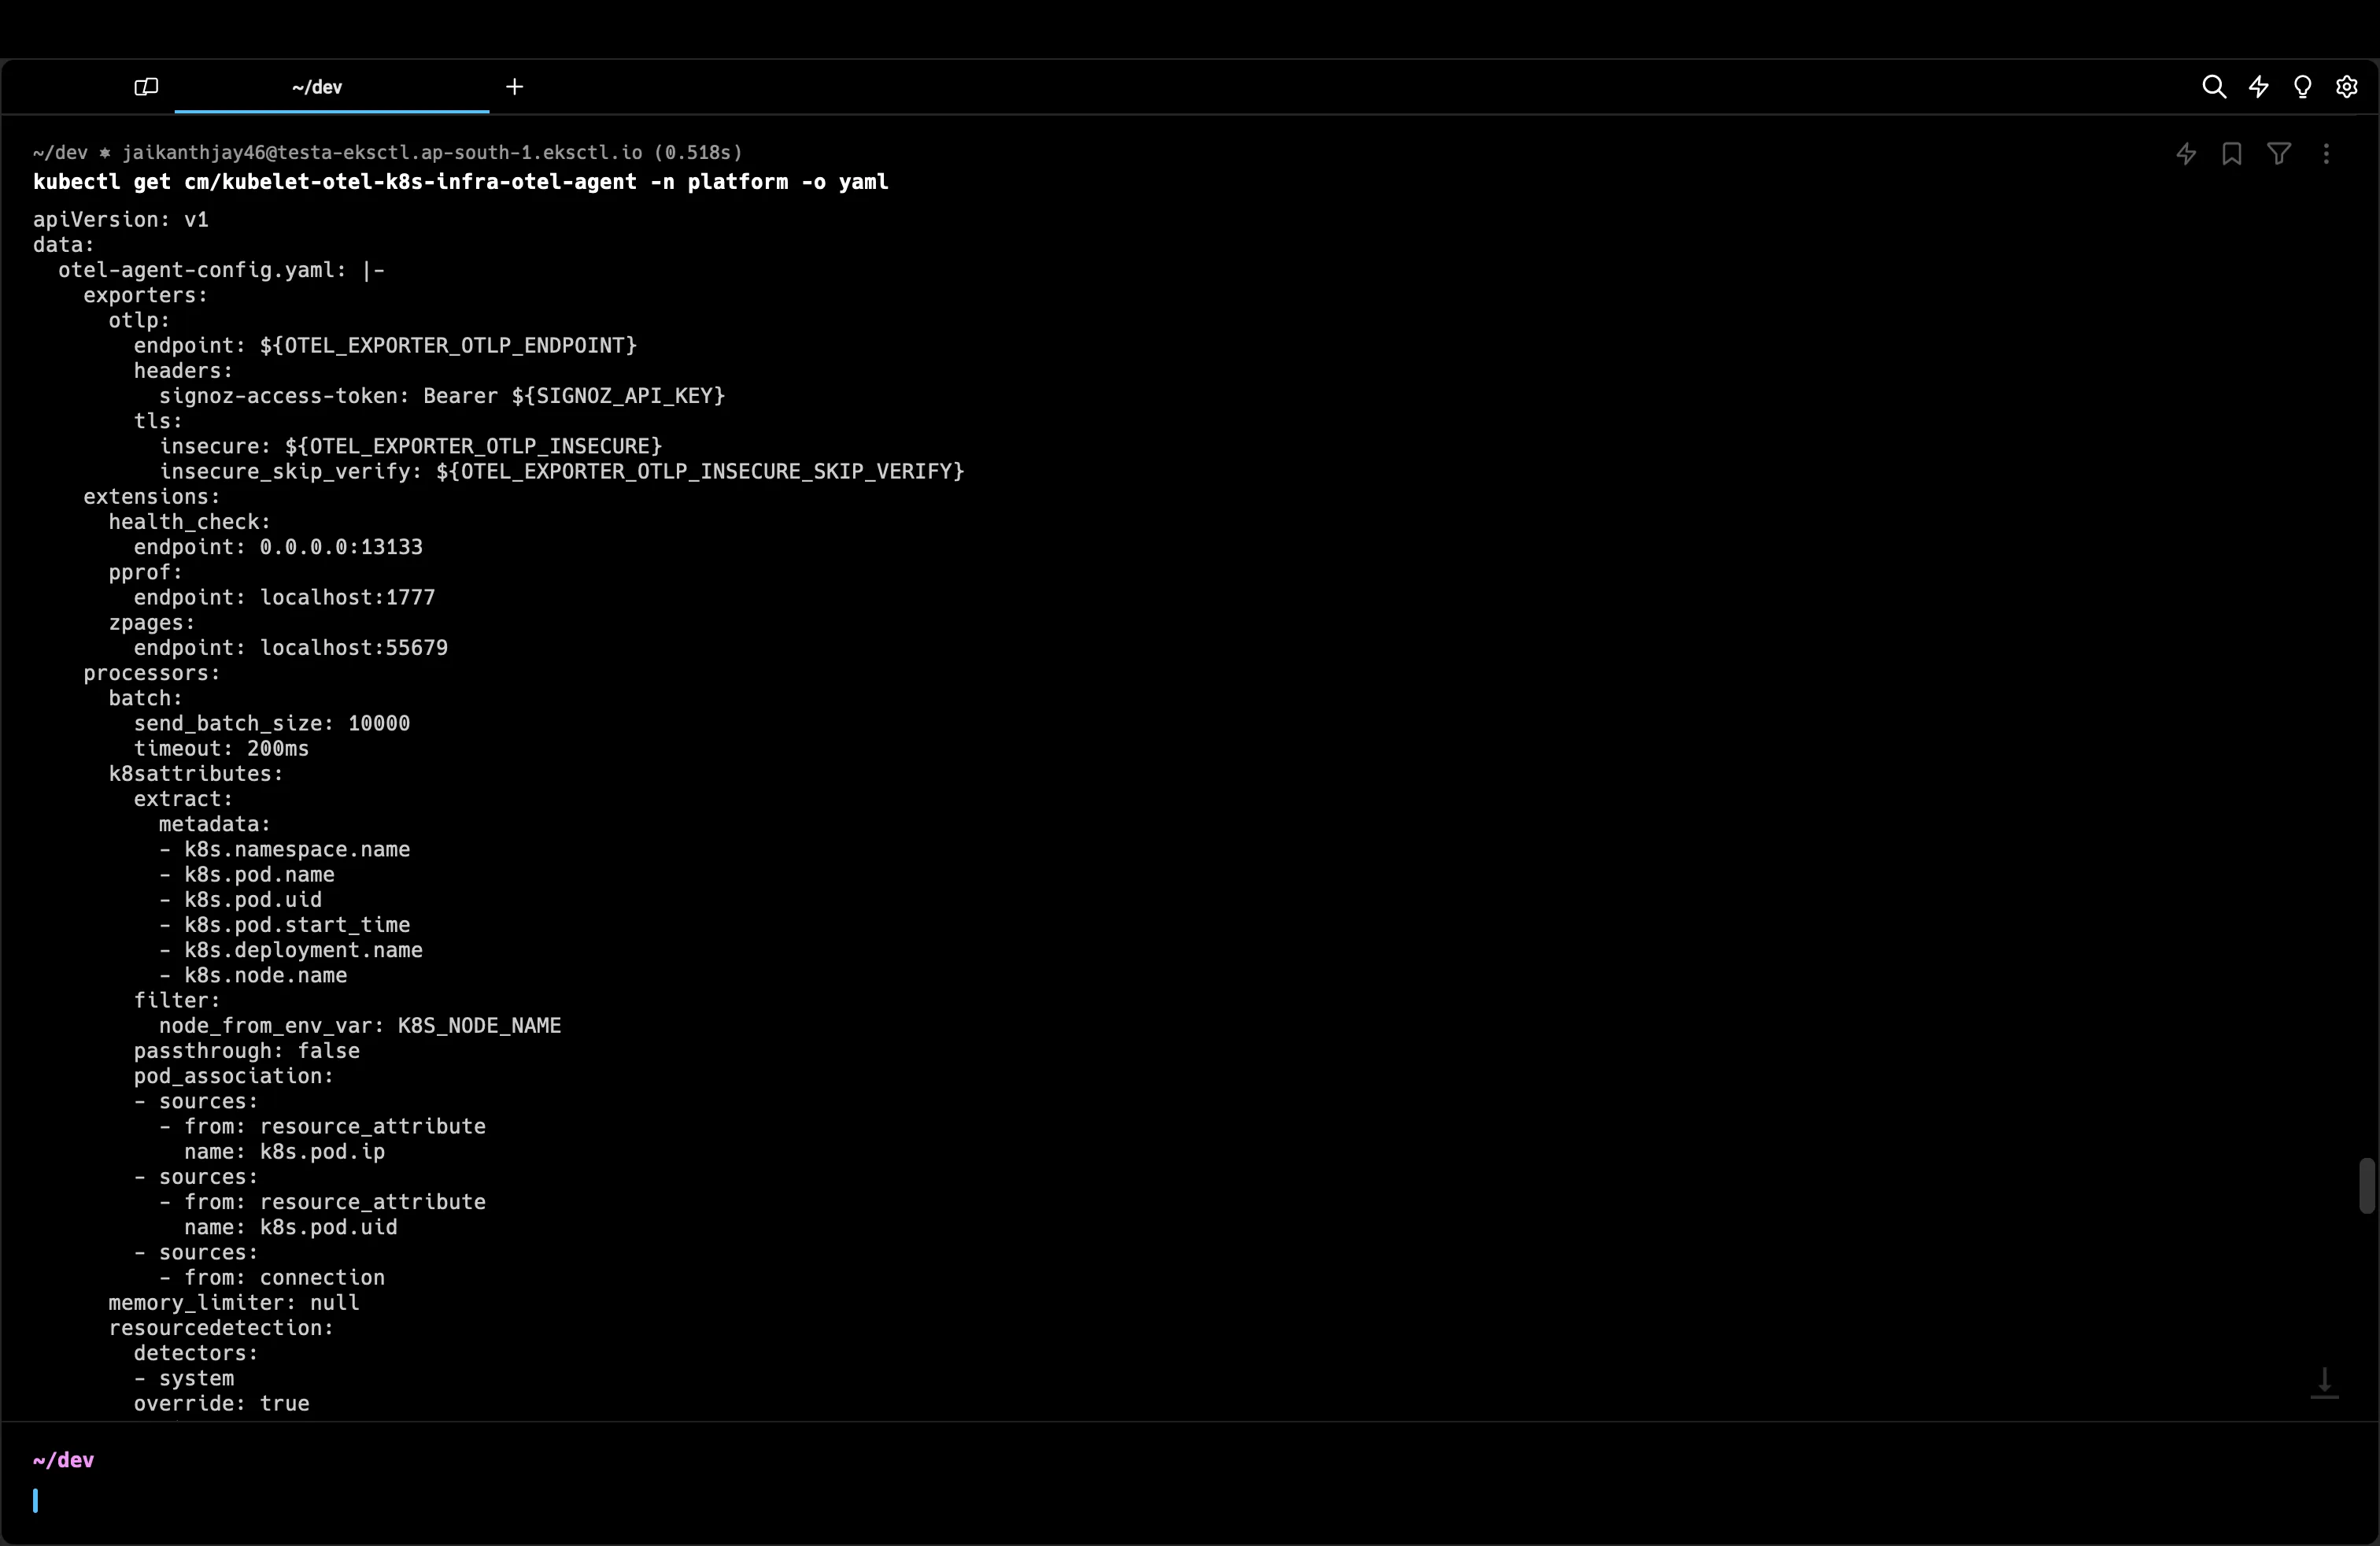
The Helm chart simplifies the OpenTelemetry setup. To see the generated configuration, use:
kubectl get cm/kubelet-otel-k8s-infra-otel-agent -n signoz -o yaml
Ensuring Correct Configuration
The OTLP Endpoint and SigNoz API Key can be verified by running the command below. You should also make sure OTLP Insecure is false. SigNoz always consumes data via the TLS endpoint. It ensures encryption during transit and prevents misuse due to accidental PII logging or tokens being logged.
To validate that the OpenTelemetry Collector is correctly configured with the appropriate credentials and endpoints:
- Verify the OTLP (OpenTelemetry Protocol) endpoint is accurately specified. This endpoint should correspond to the ingestion endpoint provided by SigNoz, typically formatted as
ingest.<region>.signoz.cloud:443. - Check that the SigNoz API key matches the one obtained from your SigNoz instance settings. This key is crucial for authentication and data ingestion.
- Ensure that the
OTEL_EXPORTER_OTLP_INSECUREsetting is false. SigNoz mandates the use of TLS to secure data in transit, which is particularly vital if any personally identifiable information (PII) or sensitive tokens might inadvertently be logged.
The following command retrieves the DaemonSet configuration, where you can review these settings:
kubectl get ds/kubelet-otel-k8s-infra-otel-agent -n signoz -o yaml
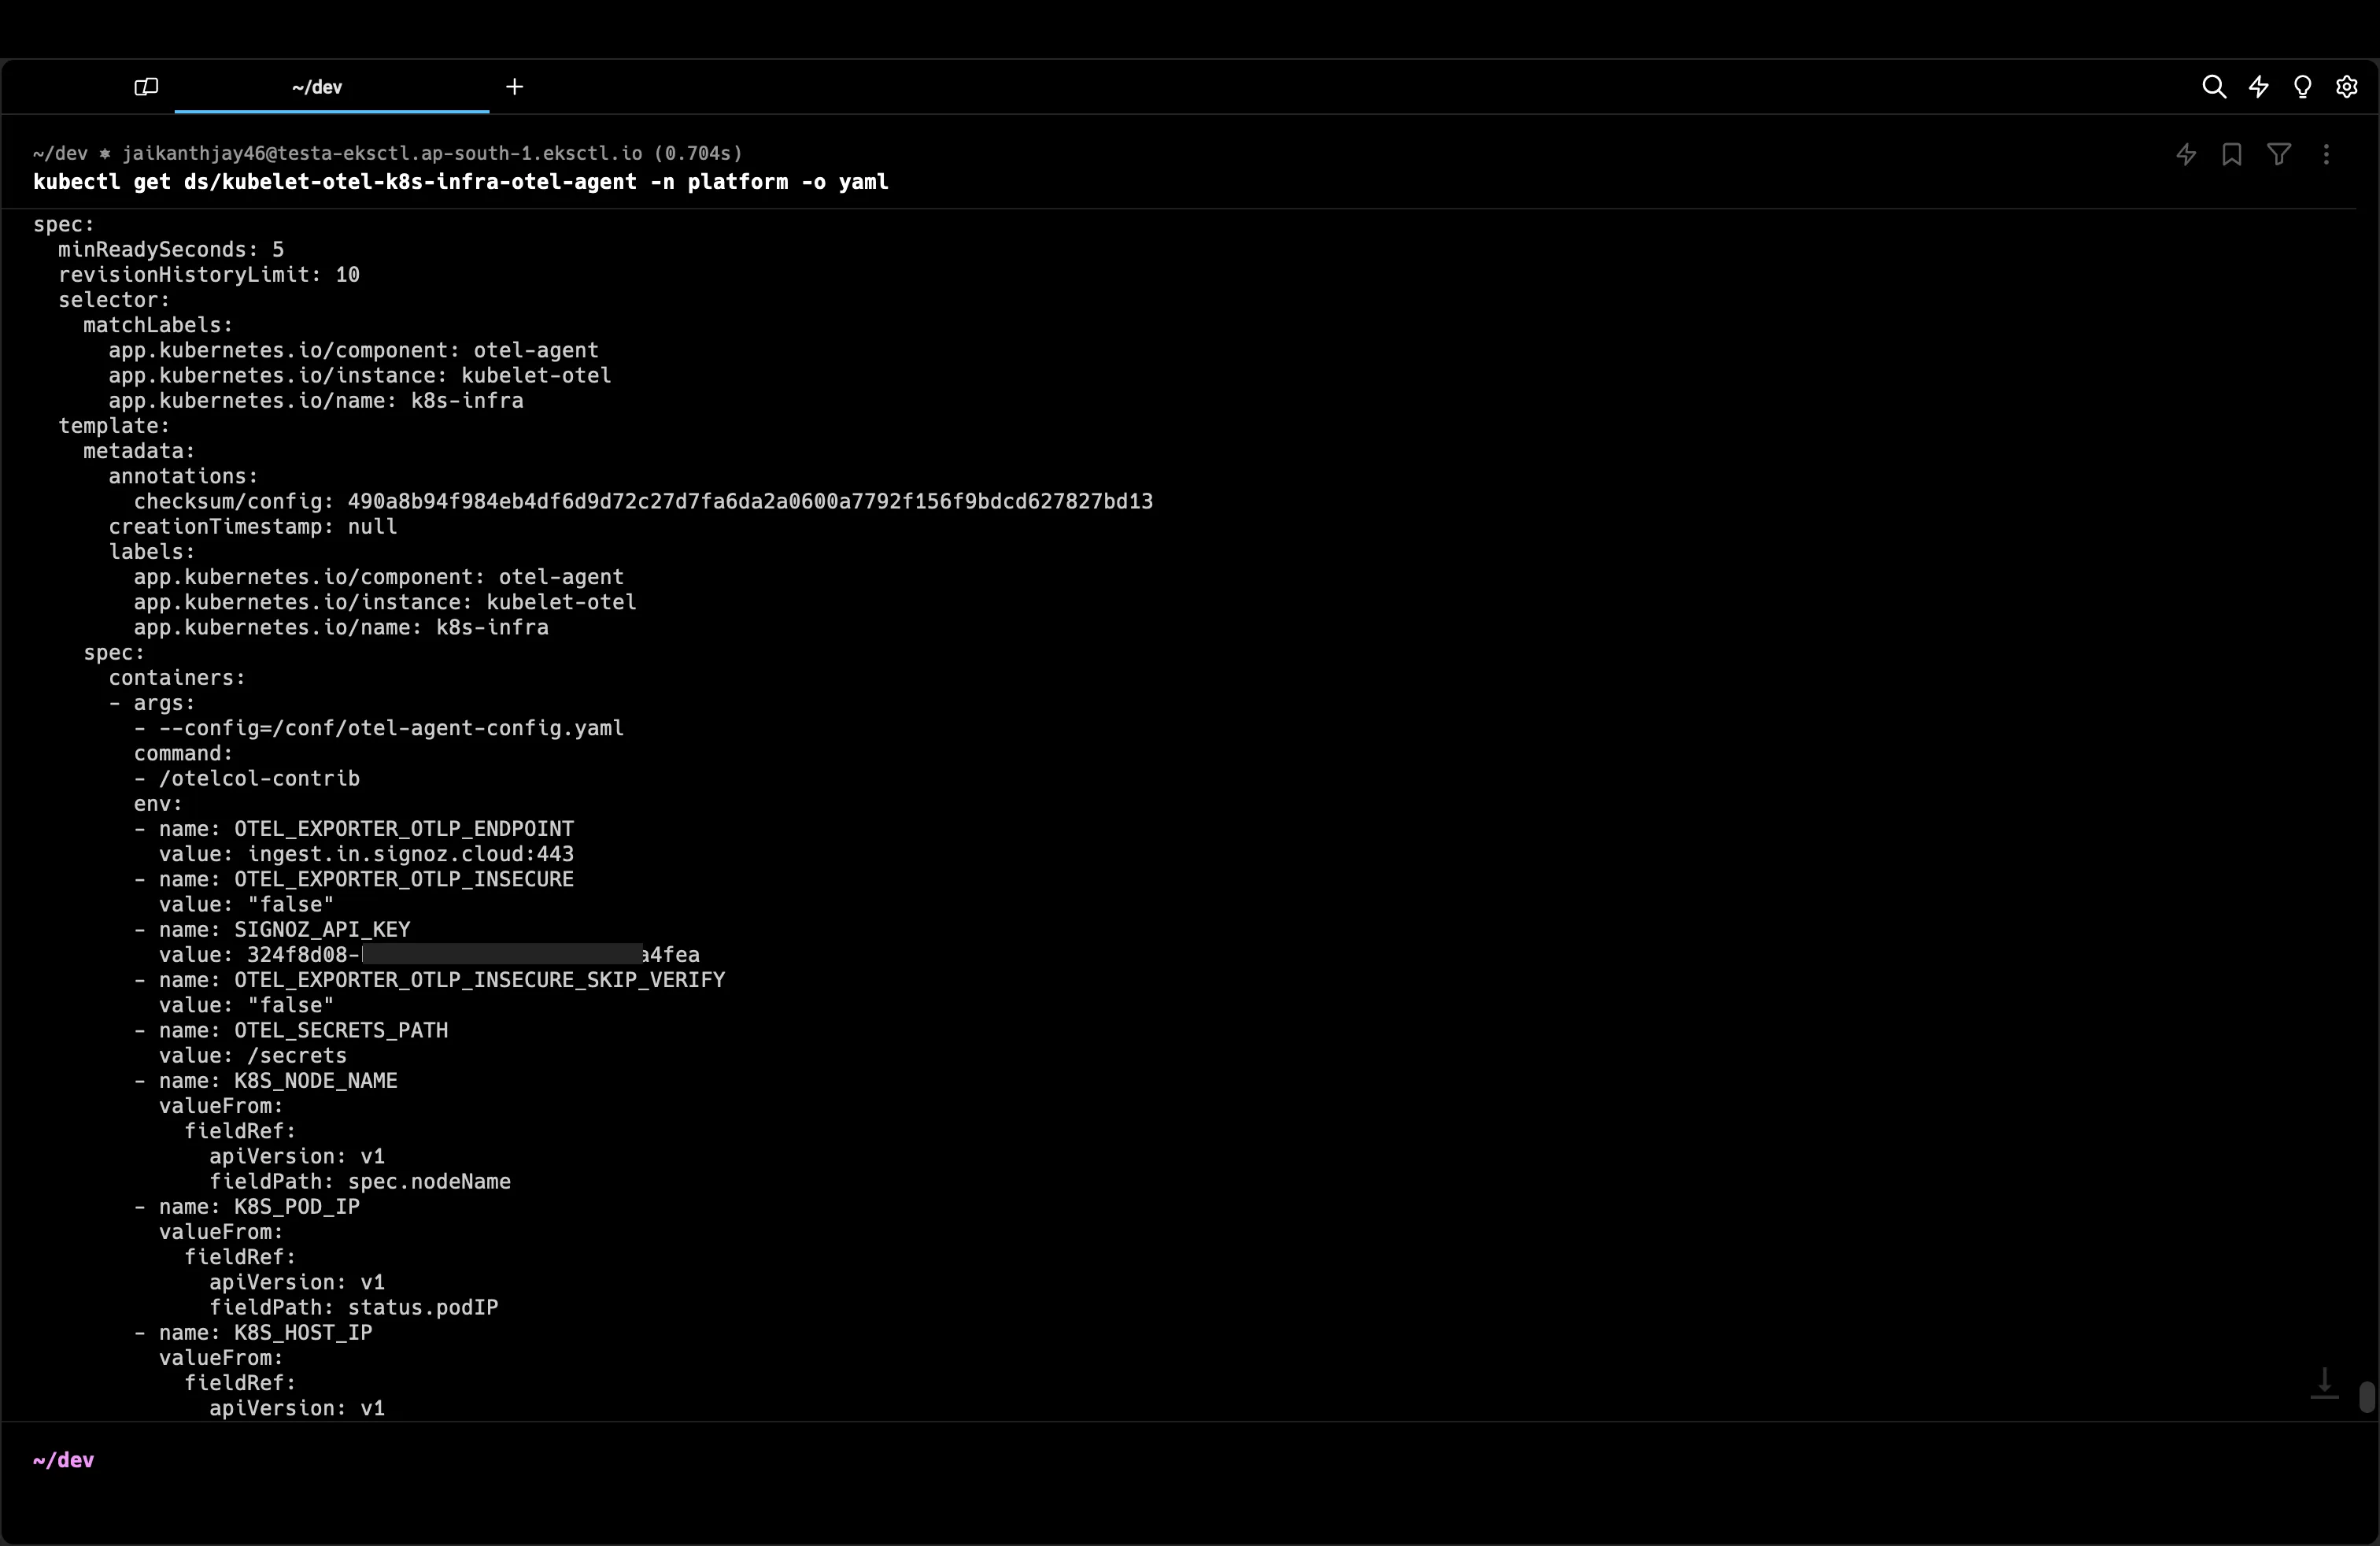
Review the output for the OTEL_EXPORTER_OTLP_ENDPOINT, SIGNOZ_API_KEY, and OTEL_EXPORTER_OTLP_INSECURE environment variables, ensuring they align with the information from your SigNoz ingestion settings page.
Advanced: Installing with OpenTelemetry Helm Charts
Before proceeding with the vanilla charts, ensure you deeply understand your current infrastructure and OpenTelemetry's configuration requirements. This approach is recommended for advanced users who need to integrate the collector into a multi-faceted observability stack.
Refer to the official documentation for the Helm chart for comprehensive instructions and configuration options: OpenTelemetry Helm Charts Documentation.
To begin the installation, add the OpenTelemetry Helm repository and deploy the collector to your cluster. You will need to create a custom configuration file, such as advanced-signoz.yaml, tailored to your specific requirements.
helm repo add open-telemetry https://open-telemetry.github.io/opentelemetry-helm-charts
helm install -n platform --create-namespace otel-collector open-telemetry/opentelemetry-collector -f advanced-signoz.yaml
Example Configuration for advanced-signoz.yaml
In your configuration file, ensure to replace <ingestionKey> with your actual SigNoz ingestion key and <region> with the appropriate region associated with your SigNoz instance.
# advanced-signoz.yaml
mode: daemonset

presets:
  kubeletMetrics:
    enabled: true

config:
  exporters:
    otlp:
      endpoint: "ingest.<region>.signoz.cloud:443"
      tls:
        insecure: false
      headers:
        "signoz-ingestion-key": "<ingestionKey>"
  service:
    pipelines:
      metrics:
        exporters:
          - otlp
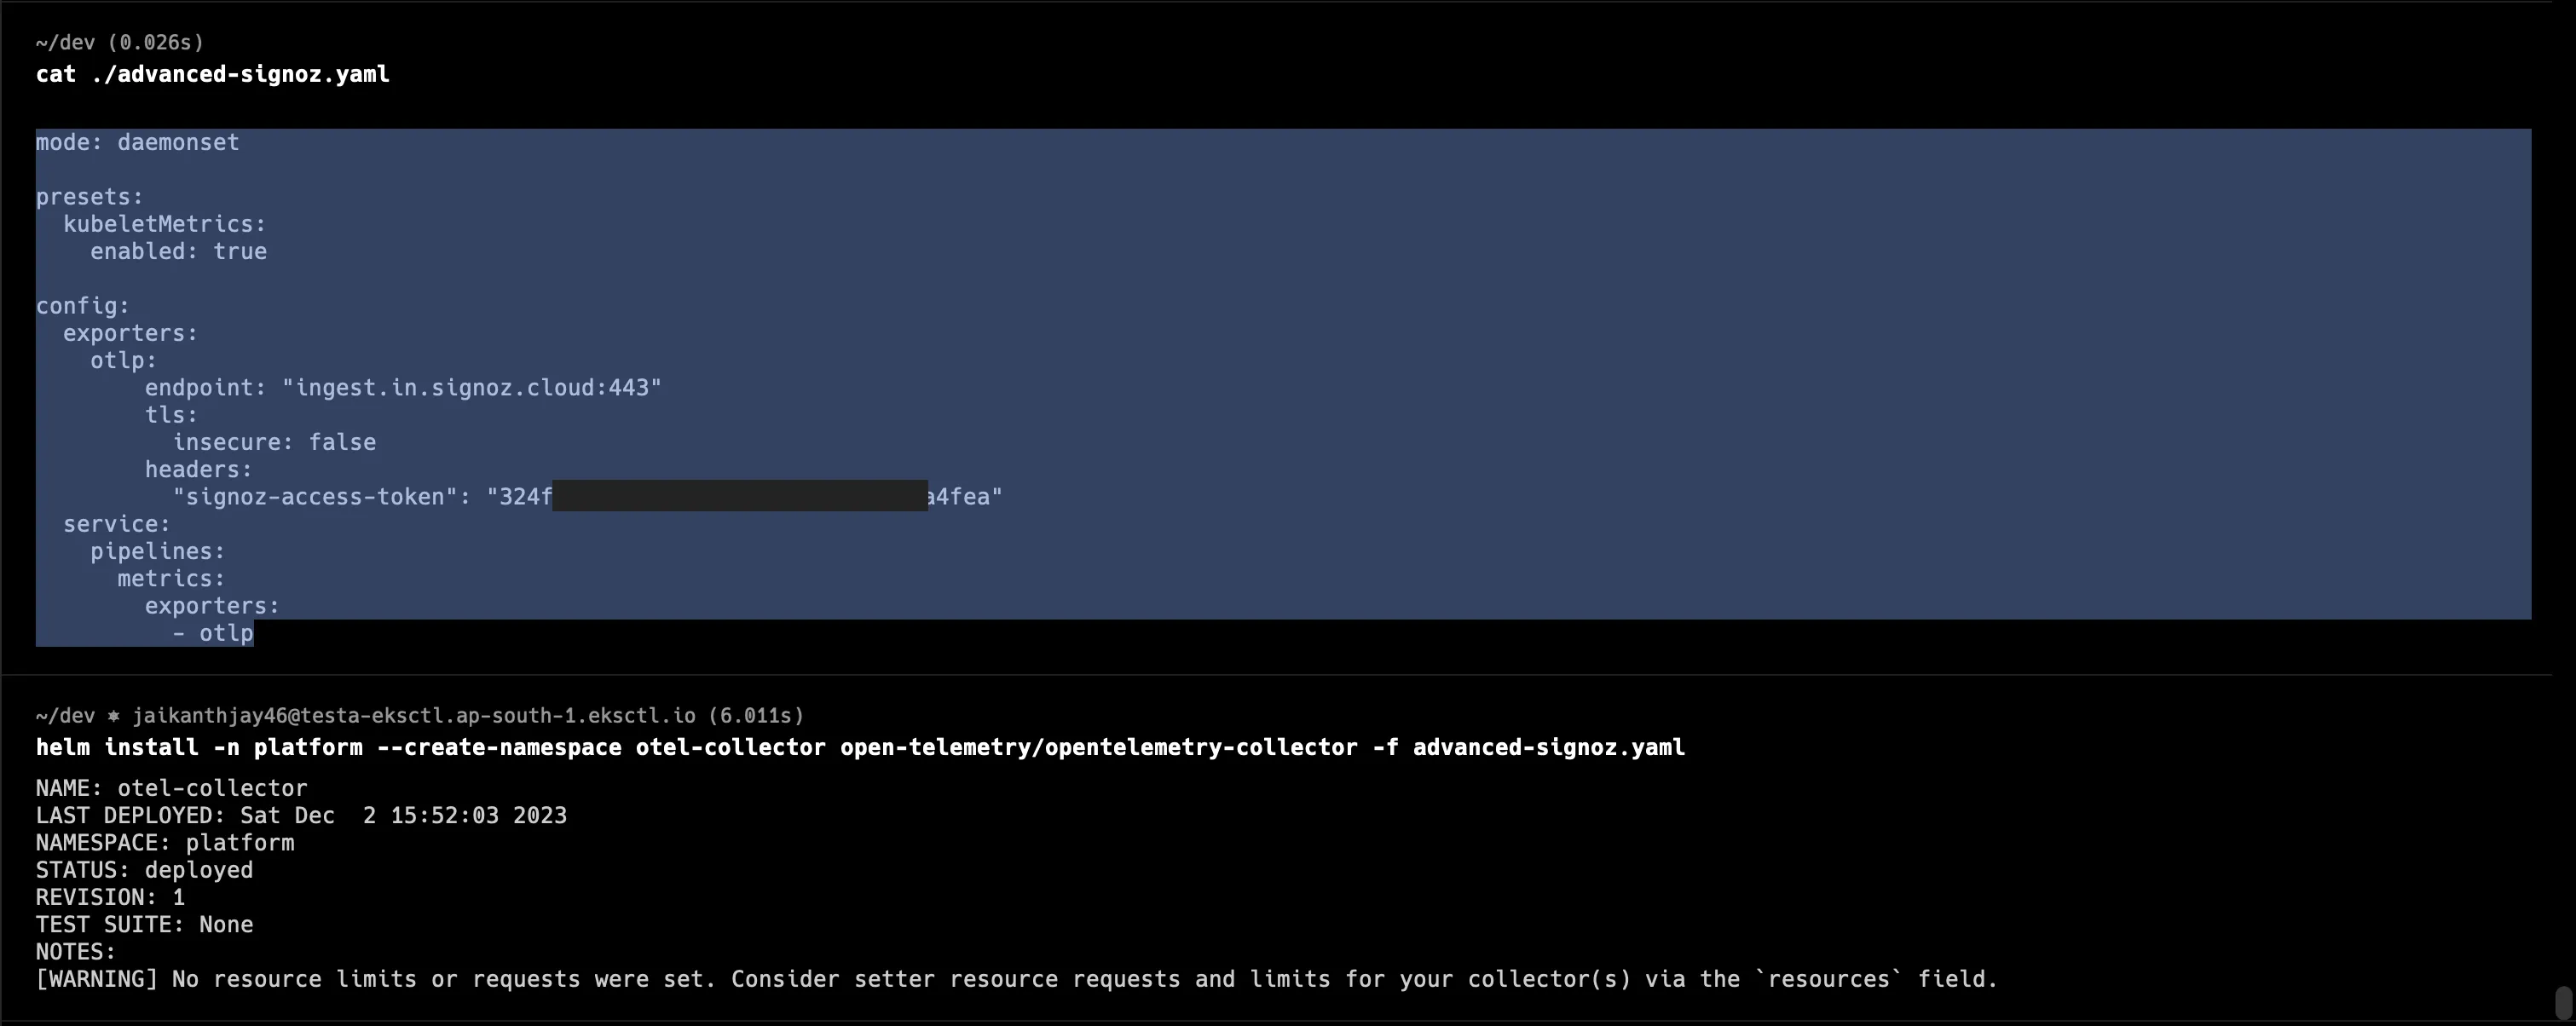
For verification and debugging procedures, follow the same steps provided for the SigNoz managed installation, which includes checking the agent logs and validating the configuration settings within the Kubernetes resources.
Monitoring with SigNoz Dashboard
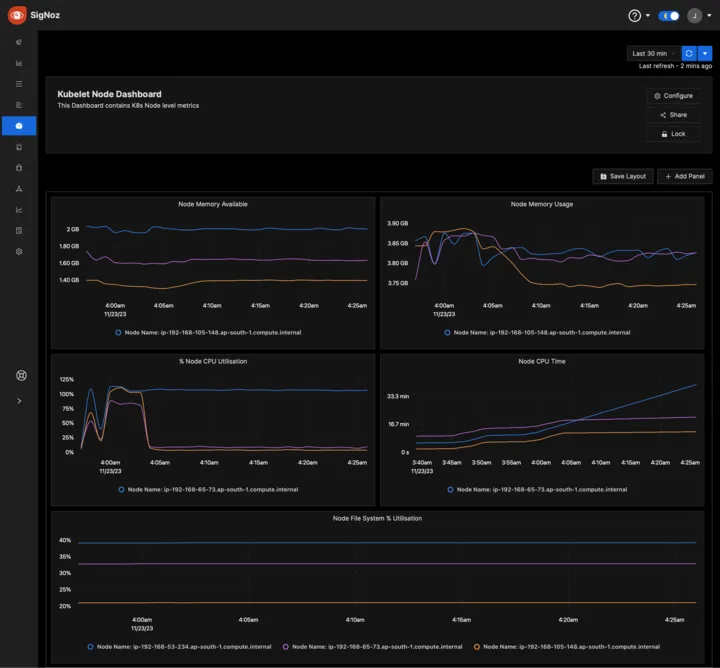
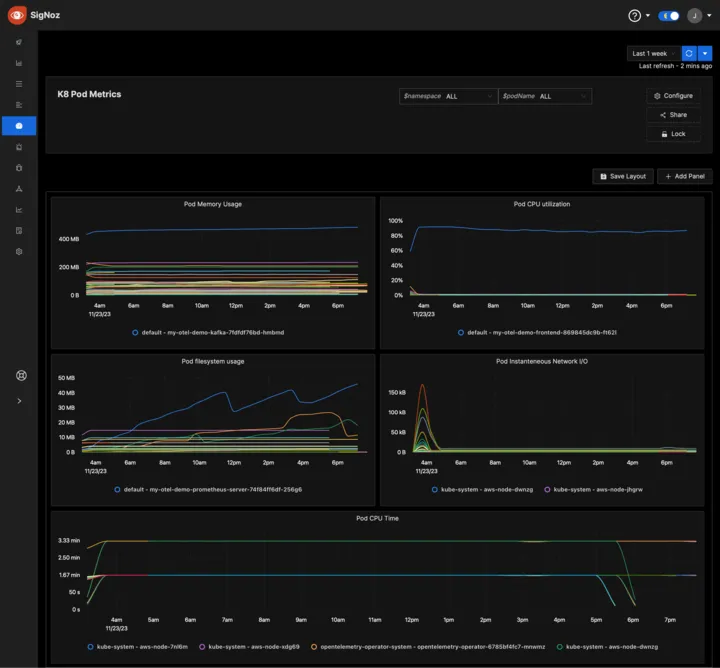
Once the above setup is done, you will be able to access the collected metrics in the SigNoz dashboard. You can go to the Dashboards tab and try adding a new panel. You can learn how to create dashboards in SigNoz here.
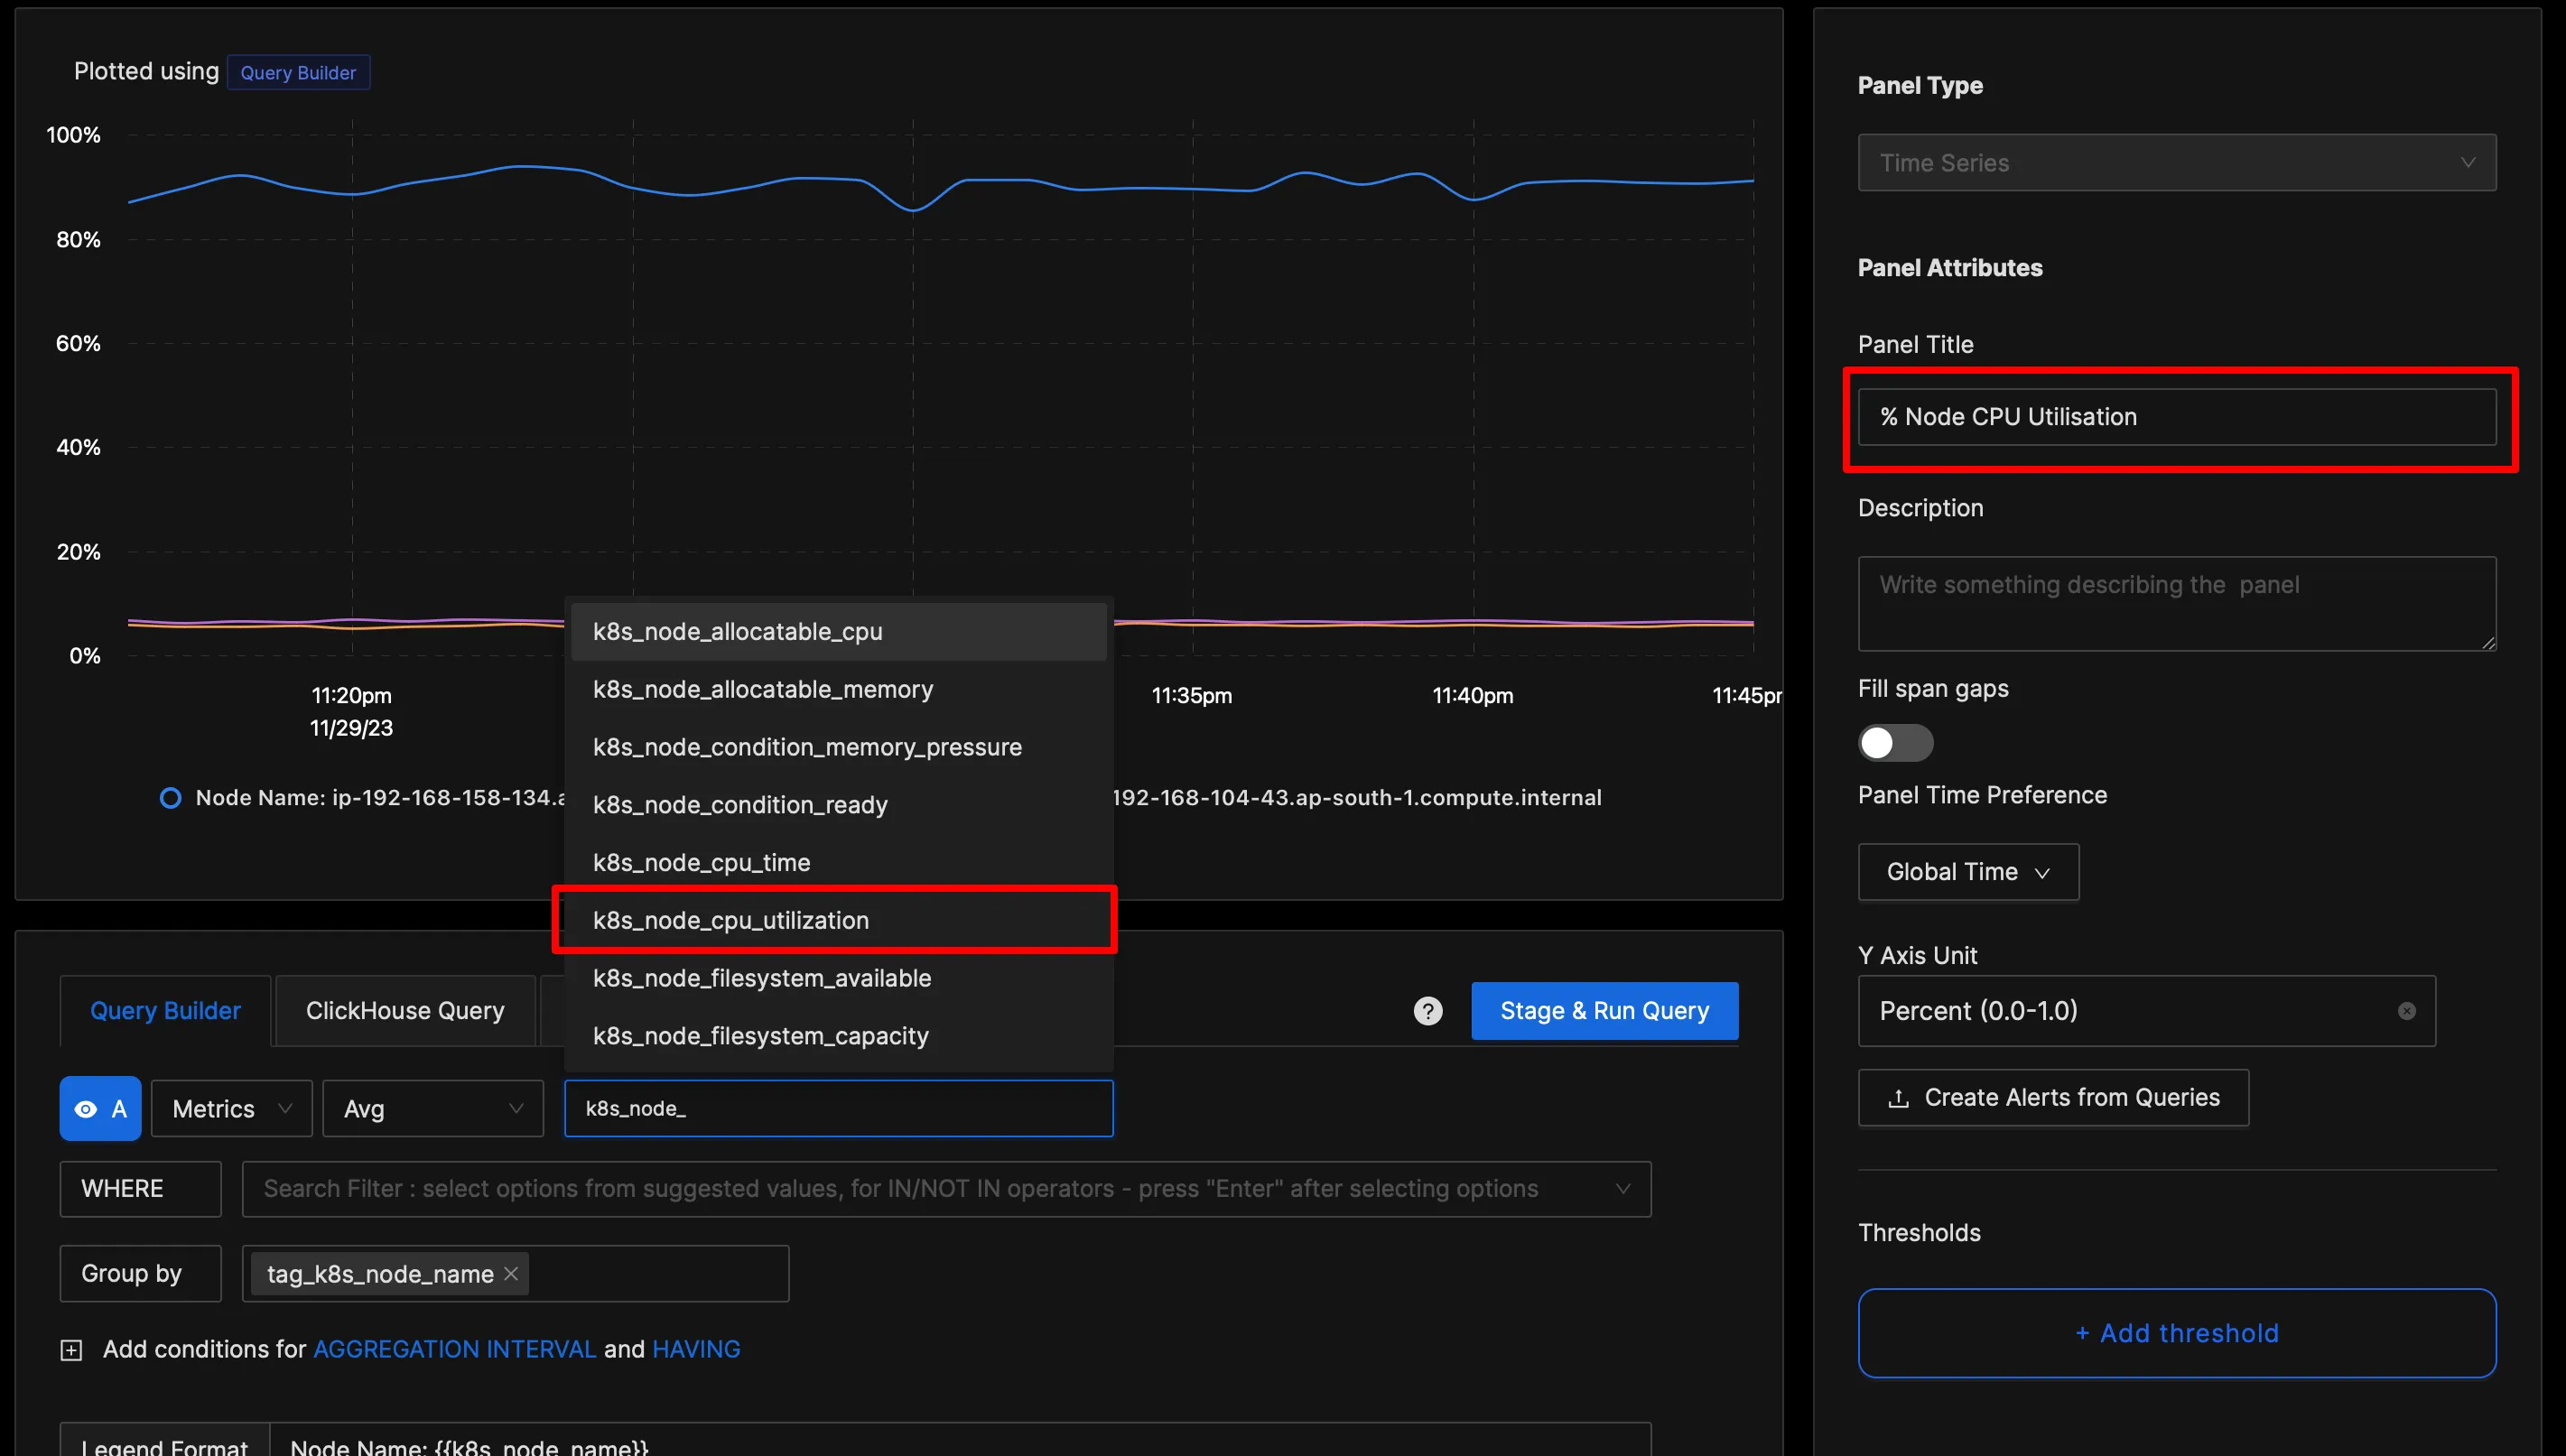
You can easily create charts with query builder in SigNoz. Here are the steps to add a new panel to the dashboard.
Variable View Dashboard
Sometimes, we would want to show different views of the dashboard for different teams. For example, the platform team needs pod metrics from the platform namespace, or the backend rest API team would need to see a particular pod’s metrics.
This is possible with SigNoz with Dashboard Variables.
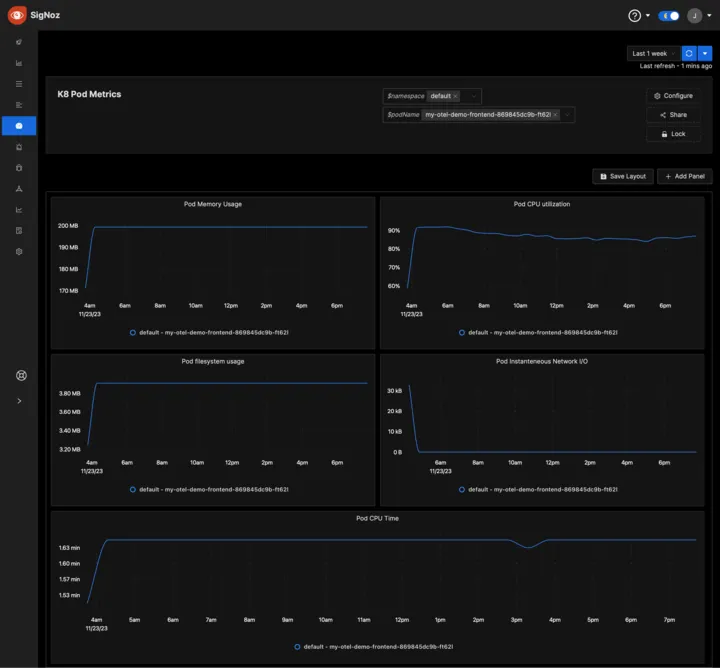
Learn how to create variables in Dashboards here
Alerting
You can also create alerts on any metric and send notifications to Slack, Teams, or PagerDuty. Learn how to create alerts here.
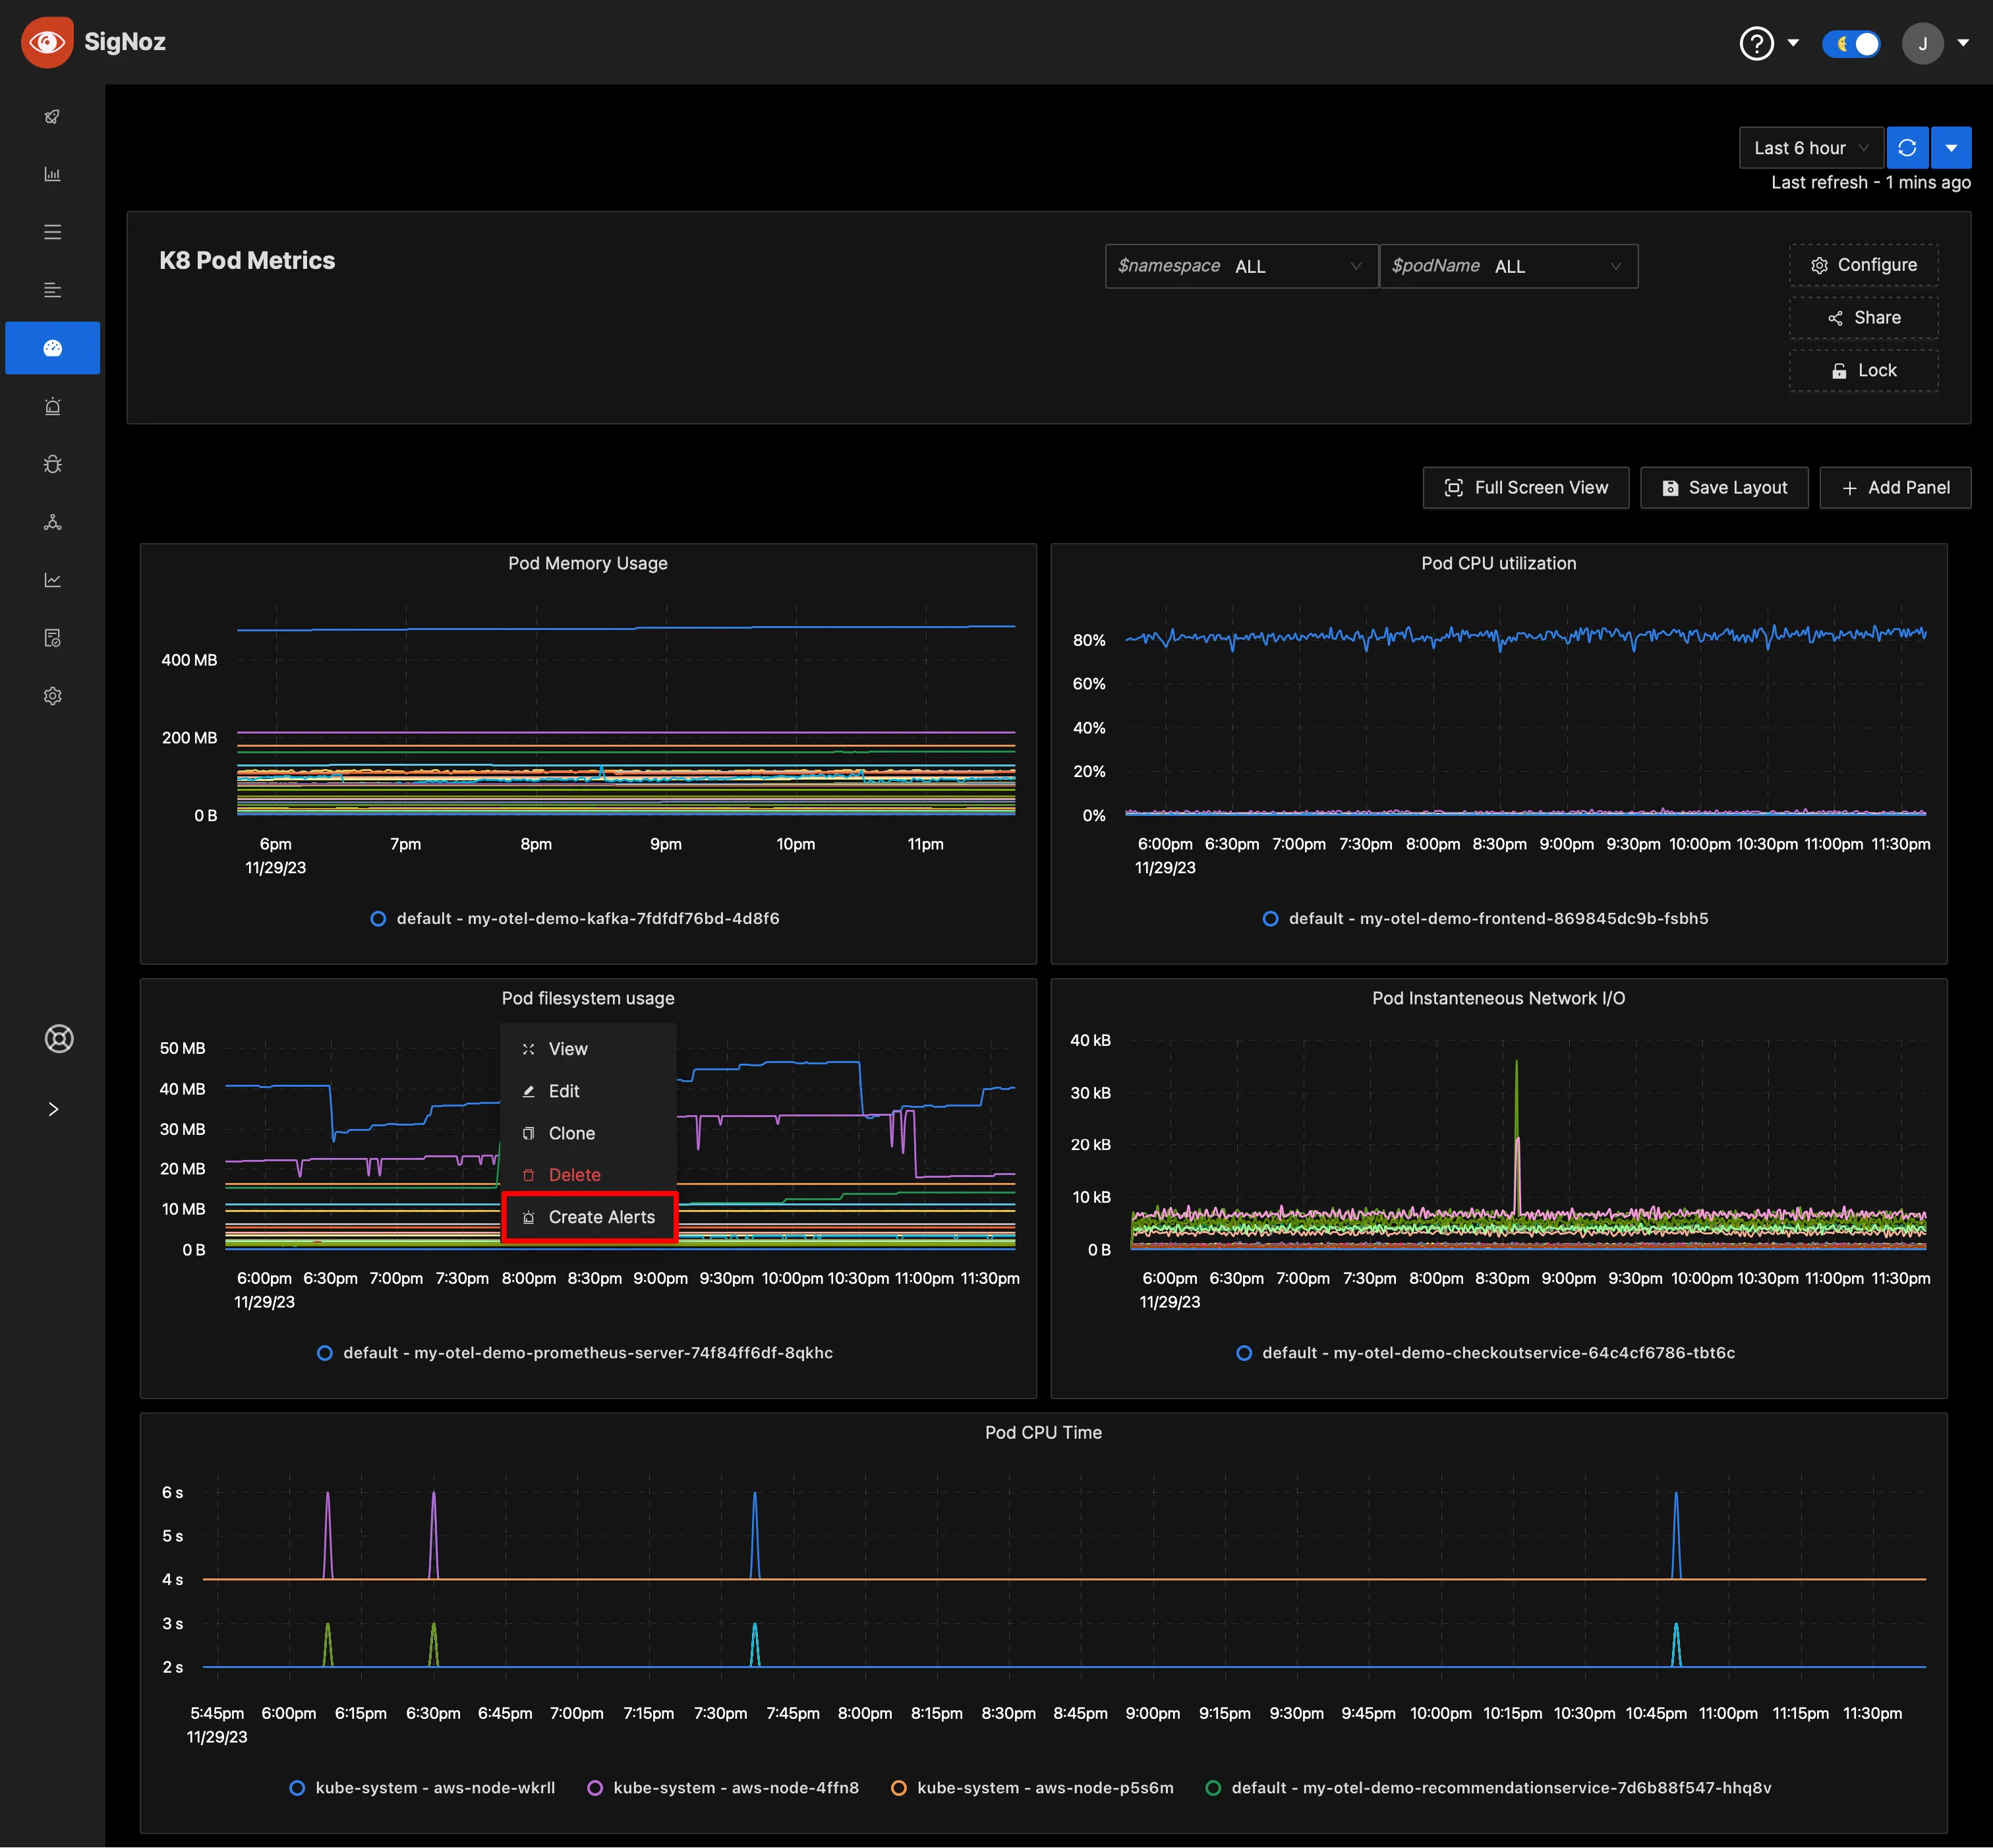
Pre-built Dashboards
If you want to get started quickly with Kubernetes monitoring, you can use the following in SigNoz dashboards and get started.
Conclusion
In this tutorial, you installed an OpenTelemetry Collector to collect kubelet metrics from your EKS cluster and send the collected data to SigNoz for monitoring and alerts.
Visit our complete guide on OpenTelemetry Collector to learn more about it. OpenTelemetry is quietly becoming the world standard for open-source observability, and by using it, you can have advantages like a single standard for all telemetry signals, no vendor lock-in, etc.
SigNoz is an open-source OpenTelemetry-native APM that can be used as a single backend for all your observability needs.
Further Reading
Complete Guide on OpenTelemetry Collector
