Elasticsearch vs Splunk - Top Pick for Log Analysis
Elasticsearch and Splunk can both be used as log analysis tools for software applications. Elasticsearch, as part of the Elastic Stack, offers a highly scalable, open-source solution for real-time search and analytics across diverse data types, excelling in customization but with a steeper learning curve. In contrast, Splunk provides a more user-friendly, proprietary platform focused on log management and security analytics, offering ease of use and powerful data correlation features, but at a potentially higher cost and lesser scalability compared to Elasticsearch.
If you don’t want to go through the entire article, here are the quick takeaways for Elasticsearch vs Splunk based on different use-cases:
-
Scalability and Real-Time Analytics:
Choose Elasticsearch if you need a highly scalable system for real-time search and analytics across large volumes of data, particularly if your organization has varied and evolving use cases. -
Cost and Open-Source Preference:
Choose Elasticsearch if you are seeking a cost-effective, open-source solution with the flexibility for extensive customization, keeping in mind the potential need for more in-depth technical expertise. -
Ease of Use and Rapid Deployment:
Choose Splunk if you prioritize ease of use and a quicker setup, especially if your team has limited technical expertise or requires a straightforward solution for log management and security analytics. -
Integrated Security Analytics and Advanced Correlation:
Choose Splunk for advanced security analytics, including robust features for event correlation and threat detection, making it a strong choice for organizations with a significant focus on security and compliance.

Before we deep-dive into key differences between Elasticsearch and Splunk, let's us have a brief overview of Elasticsearch and Splunk.
What is Elasticsearch?
The ELK stack stands for Elasticsearch, Logstash, and Kibana, and now also includes Beats. These tools together create a powerful log analytic tool known as ELK stack and are maintained by Elastic (the company behind ELK stack). Let’s have a brief overview of each of the components.
-
Elasticsearch
Elasticsearch does more than log analysis. It is a powerful full-text search engine that makes the search easier anywhere. Elasticsearch is a NoSQL database built on the Lucene search engine. -
Logstash
Logstash is used to aggregate and process data and send it to Elasticsearch. It is an open-source, data processing pipeline that ingests data from several sources simultaneously, transforms it, and then sends it to get collected. -
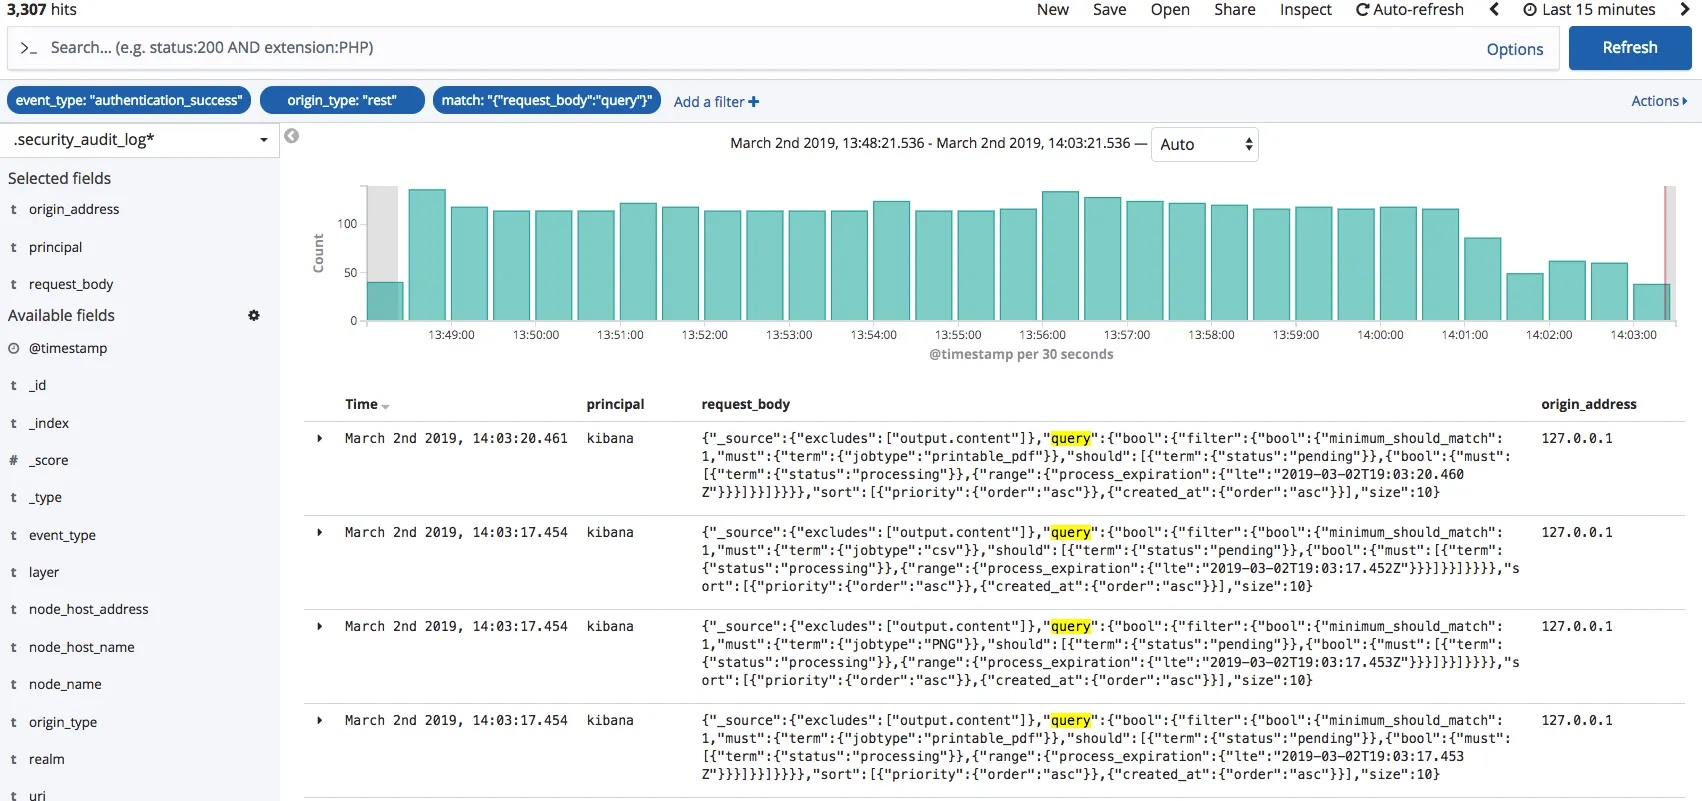
Kibana
Kibana provides a user interface that works on top of Elasticsearch and lets users analyze data using visualizations and dashboards. It provides real-time histograms, line graphs, pie charts, and maps.
The ELK stack allows users to ingest data from any source (integration of cloud environments is supported too) in any form and lets a user search, analyze, and visualize log data in real-time.
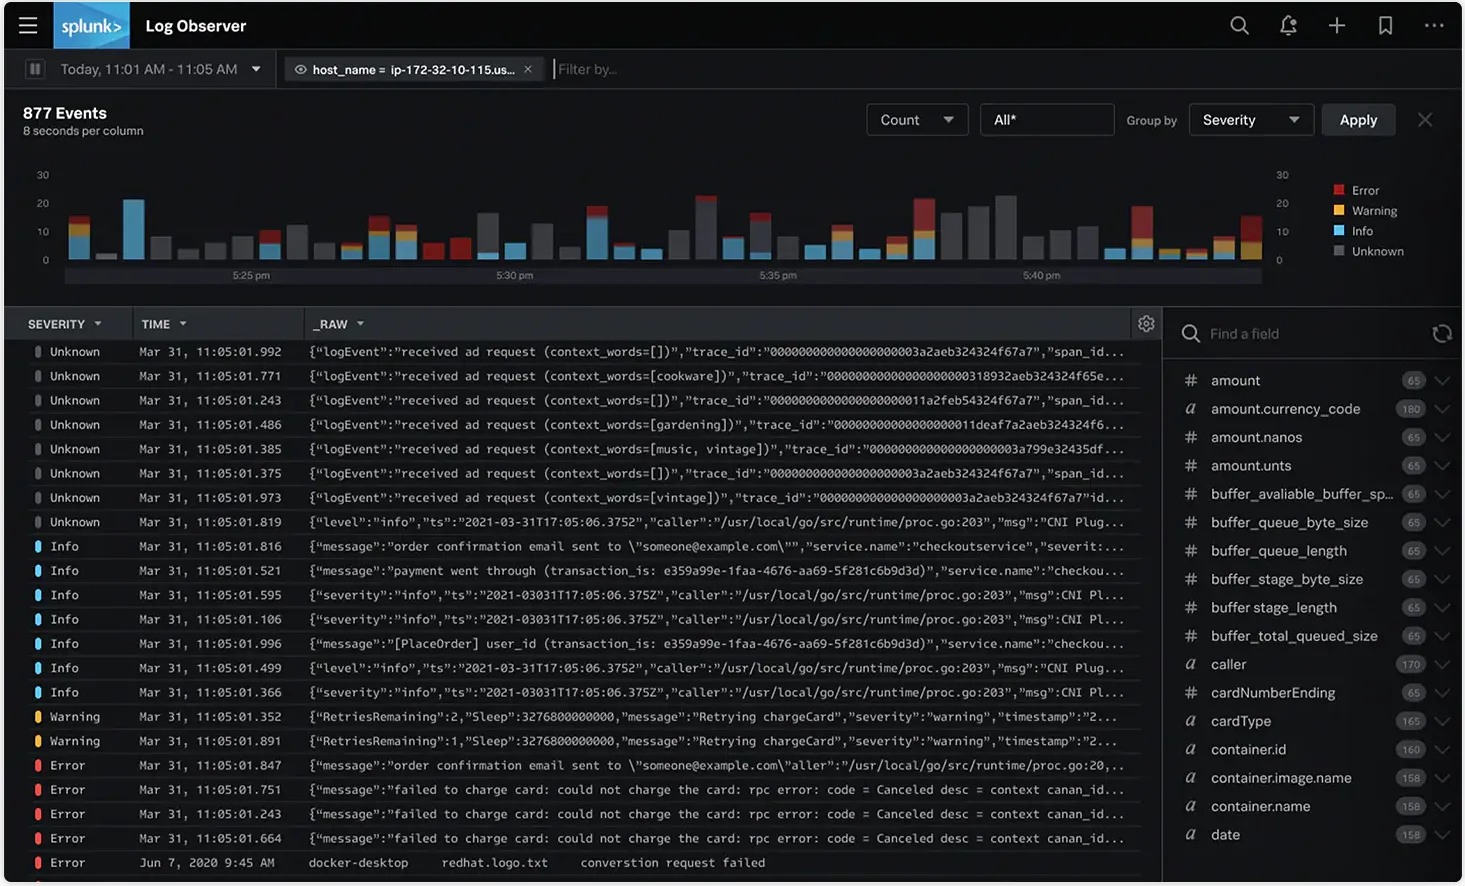
What is Splunk?
Splunk is not open-source like the ELK stack. It is built and managed by a company with the same name which is totally focused on log analysis and observability. It is very easy to plug into a client’s product but comes with a hefty price structure.
Three key components in Splunk are its forwarder, indexer, and search head. The forwarder pushes data to a remote indexer. The indexer manages all the indexing and search queries. The search head is the front-end web interface where these 3 components can be combined.
Now that we have an overview of both tools let’s discuss the key differences between them.
Elasticsearch vs Splunk - At a glance
| Feature | Elasticsearch | Splunk |
|---|---|---|
| Licensing | Open-source (Apache 2.0 license) with commercial offerings. | Proprietary. |
| Use Case | Search and analytics on structured and semi-structured data. | Real-time monitoring, search, and analysis of machine-generated big data. |
| Set Up | More complex setup than Splunk. | Easier to set up. |
| Data Collection | REST calls, Elastic Beats, and Logstash. | Universal forwarder, REST API, and HTTP Event Collector (HEC). |
| Performance | High performance with low latency for search queries. | High performance under heavy loads. |
| Indexing | Distributed, full-text search engine. | Distributed Indexing, centralized indexing. |
| Scalability | Highly scalable and horizontally expandable. | Scalable, but licensing costs can increase with data volume. |
| Query language | Elasticsearch Query DSL (based on JSON). | Search Processing Language (SPL). |
| Data Storage | Schema-less JSON documents. | Proprietary format optimized for machine data. |
| User Interface | Utilizes Kibana for visualization. | Splunk Web UI. |
| Cost | Free for open-source version, paid for commercial features. | Free tier, paid enterprise version. |
Key differences between Elasticsearch and Splunk
A couple of recent developments are worth keeping in mind here. Elasticsearch added an AGPLv3 license option in September 2024, alongside its existing licenses, while Splunk became a Cisco company following the 2024 acquisition, with Splunk Observability Cloud serving as its cloud-native arm. The core contrast still holds, though: open-core, self-hostable search versus a commercial, enterprise log-analytics and SIEM platform.
Set up and maintenance
Since Splunk is proprietary software, it is easier to configure and set up than the ELK Stack. Both ELK and Splunk support on-premise and SaaS deployment, which means that the software can sit on the user’s physical data center and the user can also deploy these both to the cloud.
Storage
In Splunk, data is stored in indexes made up of file buckets. These buckets contain data structures that enable Splunk to determine if the data includes terms or words. Buckets also contain compressed, raw data. This data is usually reduced to 15% of its original size, once compressed, to help Splunk store data efficiently.
Elasticsearch stores data as unstructured JSON documents. Each document correlates a set of keys (names of fields or properties) with their corresponding values (strings, numbers, Booleans, dates, arrays of values, geolocations, or other types of data). It indexes the full contents of stored documents. It makes documents fully searchable while requiring more storage space
Query Language
The query syntax on Kibana is based on the Lucene Query syntax while Splunk uses its own Search Processing Language (SPL). Lucene query syntax is pretty much similar to scripting languages hence easy to learn for anyone who has worked with scripting languages. SPL on the other side is a proprietary language that supports the search pipeline.
The key difference between SPL syntax and Lucene queries is that SPL supports the search pipeline where consecutive commands are chained together using a pipe character that allows the output of one command to be used as the input of the next one. Lucene query syntax is more straightforward and can directly generate output from the query.
Indexing
Indexing in Elasticsearch is a collection of correlated documents. It uses a data structure known as an inverted index, which is designed to provide full-text searches. The data structure lists every unique word that appears in any document and identifies all of the documents each word occurs in. This indexing is done using the Index API, where a user can add or update a JSON document in a specific index.
Splunk uses an indexer to index data coming from the Splunk forwarder. The indexer breaks logs data into lines and identifies timestamps to create individual events. It then annotates them with metadata. Data is parsed only if it is from a universal forwarder else it directly indexes the data. It then transforms event data using transformation rules defined by an operator. Finally, Splunk writes the parsed events to disk, pointing to them from an index file which enables fast search across huge data volumes.
Another benefit of Splunk Indexer is data replication. Splunk keeps multiple copies of indexed data hence no need to worry about data loss.
User Interface
In terms of user interface, Splunk's web UI or the search head provides user management and controls which is also available in xpack Kibana.
Kibana offers all the features to build dashboards quickly. But one thing that users have to make sure of is the data types. Data types have to be correct else the aggregator functions won’t work. Data filtering is much easier and more advanced in the ELK stack.
Data Collection
As per the official documents of Splunk, data collection depends on what type of data source a client is using. These are the methods that Splunk uses for data collection.
- Ingest service which collects JSON objects from /events and /metrics endpoint of the ingest REST API.
- Forwarder service which collects data from the Splunk forwarder.
- DSP HTTP event collector which collects data from HTTP clients and Syslog data sources.
- DSP Collect connectors that collect data from several types of data sources such as Amazon S3, Amazon CloudWatch, Azure, etc. These collectors collect data through jobs that run on a schedule.
- Steaming connectors collect data from several data sources such as Apache Kafka, Apache Pulsar, Google Cloud Pub/Sub, etc. These types of connectors receive data continuously emitted by the sources.
In Elasticsearch, REST calls are one of the ways to collect data and ingest it into Elasticsearch. Elastic Beats is another way for data collection. Beats would sit on the client’s device locally, collect all of their logs, and then send them into the aggregator (Logstash).
Pricing
If you are using the free version of ELk stack, then you don't have to pay for any license. But Elasticsearch needs a lot of support and maintenance which you will have to account for. Splunk is a costly tool used by enterprises. You can find its pricing details here.
Choosing between Elasticsearch and Splunk
What to choose between Elasticsearch and Splunk? It really depends on how your organization is structured and how much time are you willing to invest in setting up log management. Splunk is easy to plug in but can be costly. ELK stack on the other hand is free and open source but requires more work and planning at the beginning for setup. It also needs resources for maintenance.
You can also check out SigNoz for log management. SigNoz can be a good choice for users who don’t have the resources to support the Elasticsearch stack and don't need the many add-ons that Splunk offers.
SigNoz - an open-source alternative to Splunk and Elasticsearch
SigNoz is a full-stack open-source APM that you can use as an alternative to Splunk and Elasticsearch.
SigNoz uses a columnar database ClickHouse to store logs, which is very efficient at ingesting and storing logs data. Columnar databases like ClickHouse are very effective in storing log data and making it available for analysis.
Big companies like Uber have shifted from the Elastic stack to ClickHouse for their log analytics platform. Cloudflare too was using Elasticsearch for many years but shifted to ClickHouse because of limitations in handling large log volumes with Elasticsearch.
SigNoz uses OpenTelemetry for instrumenting applications. OpenTelemetry, backed by CNCF, is quickly becoming the world standard for instrumenting cloud-native applications.
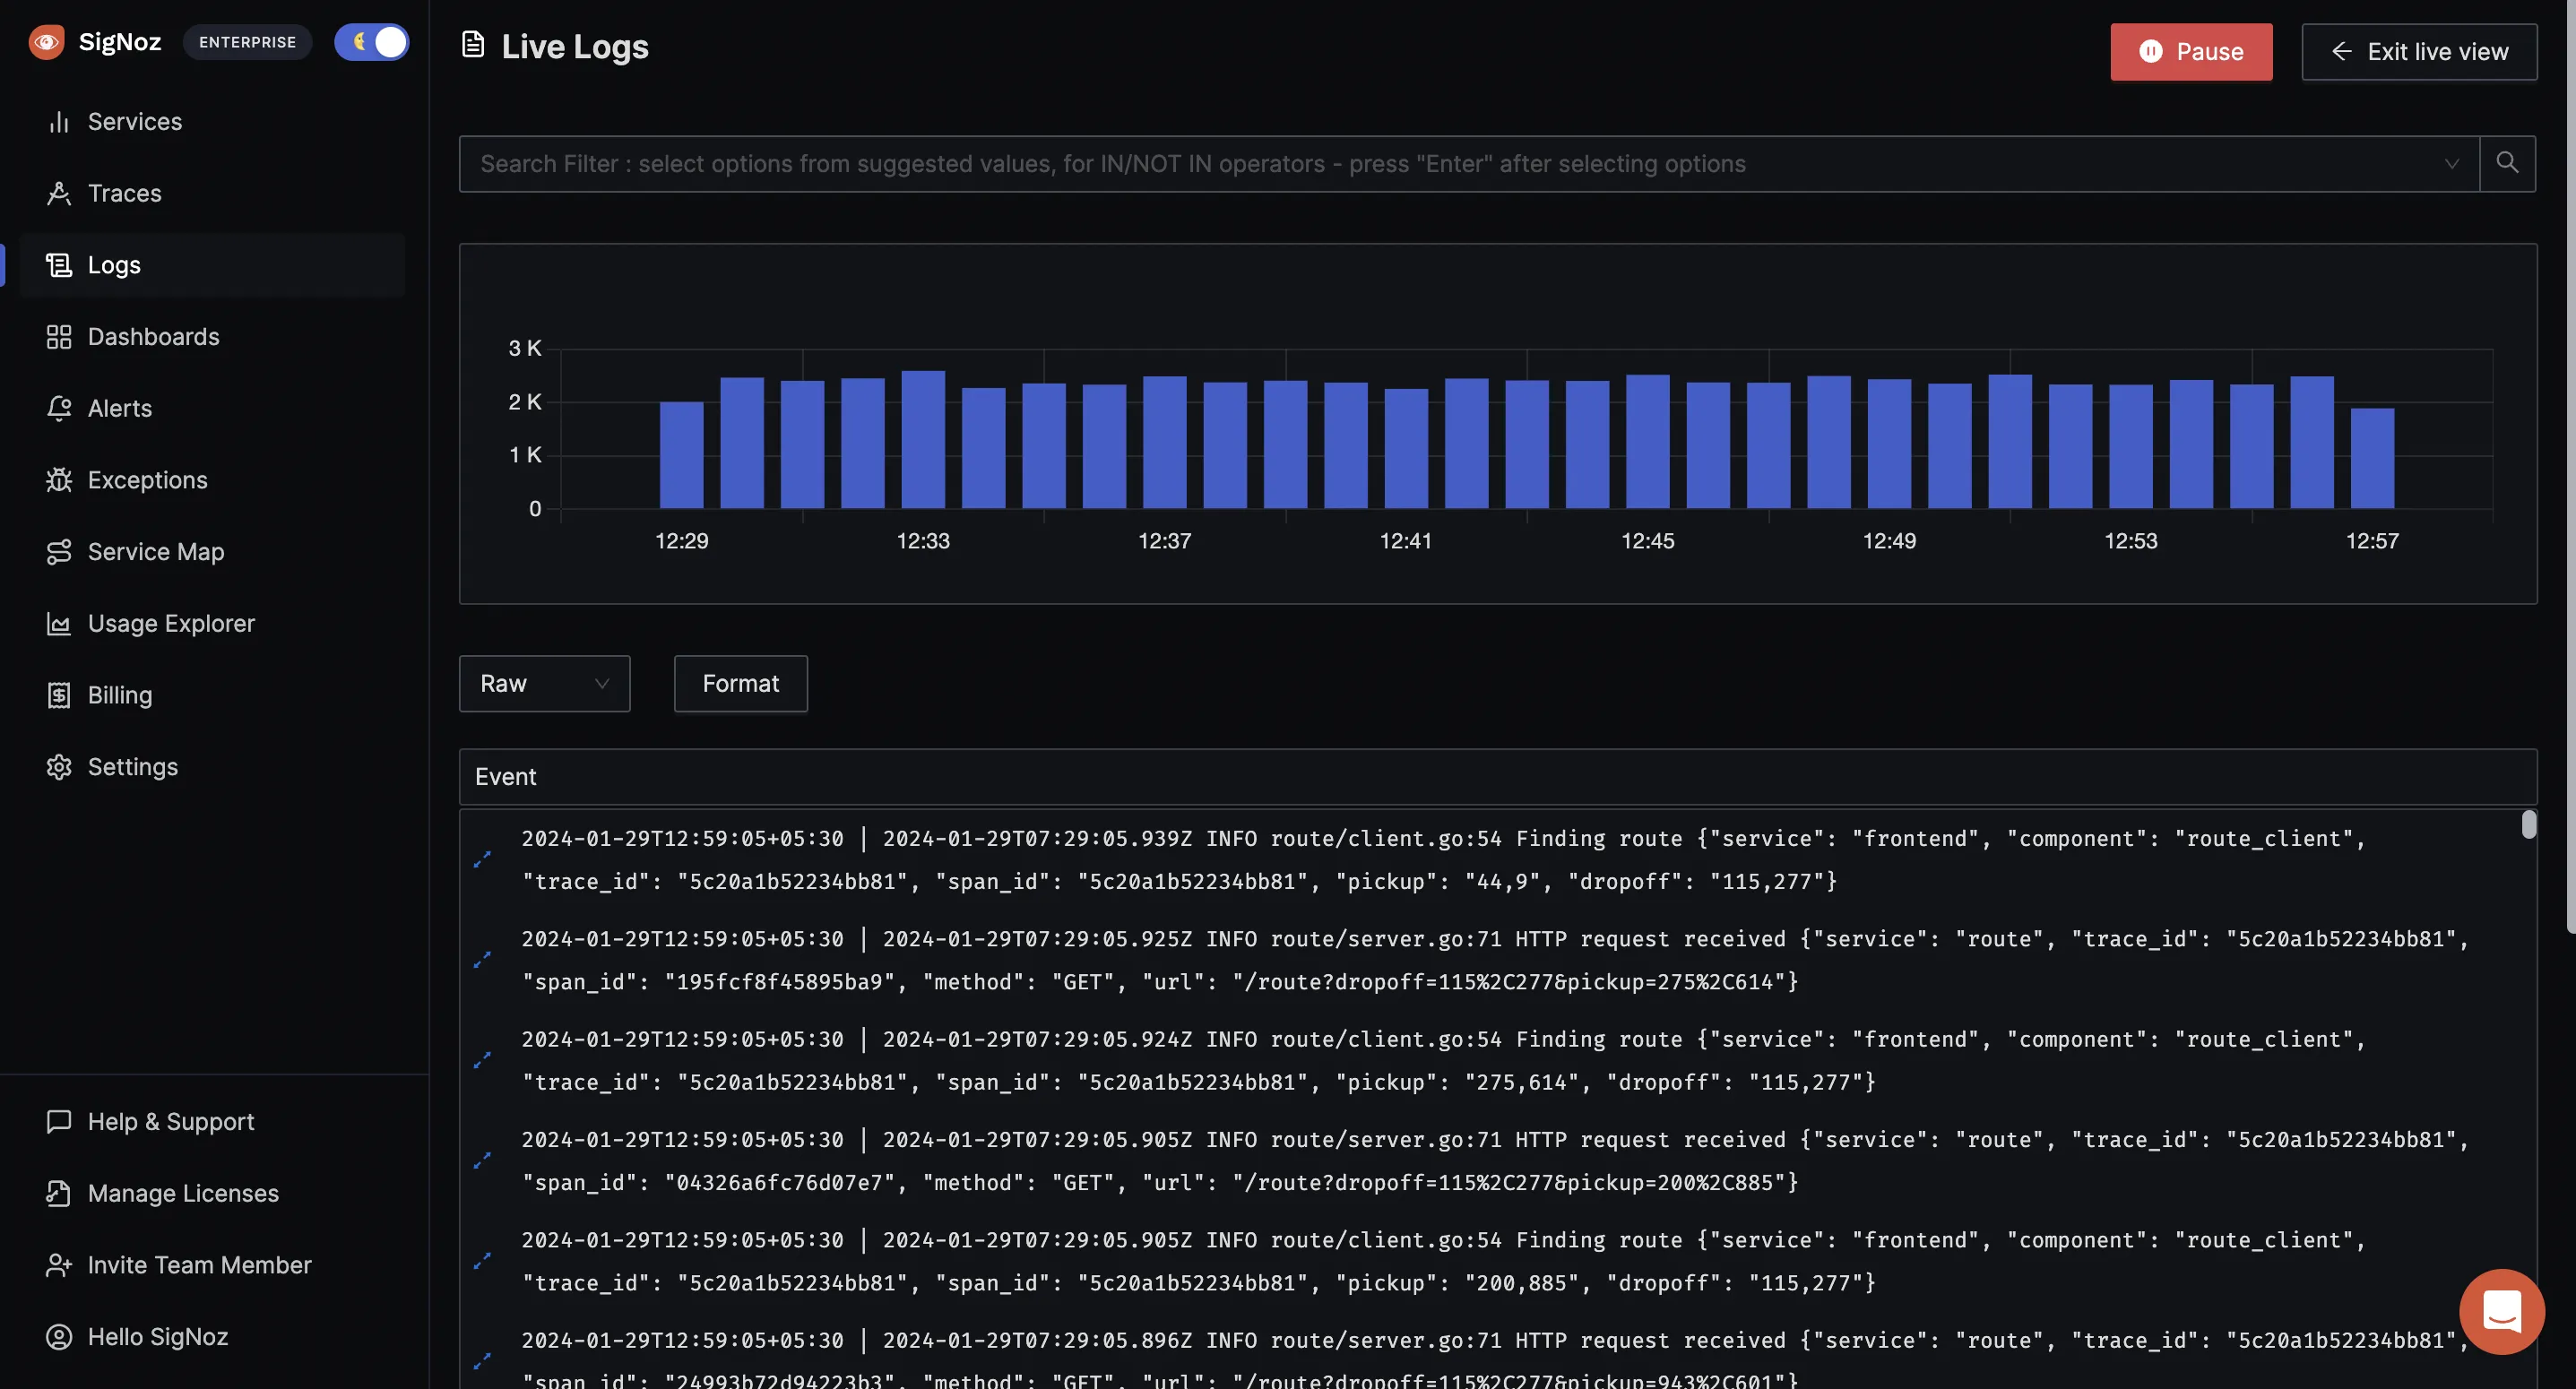
The logs tab in SigNoz has advanced features like a log query builder, search across multiple fields, structured table view, JSON view, etc.
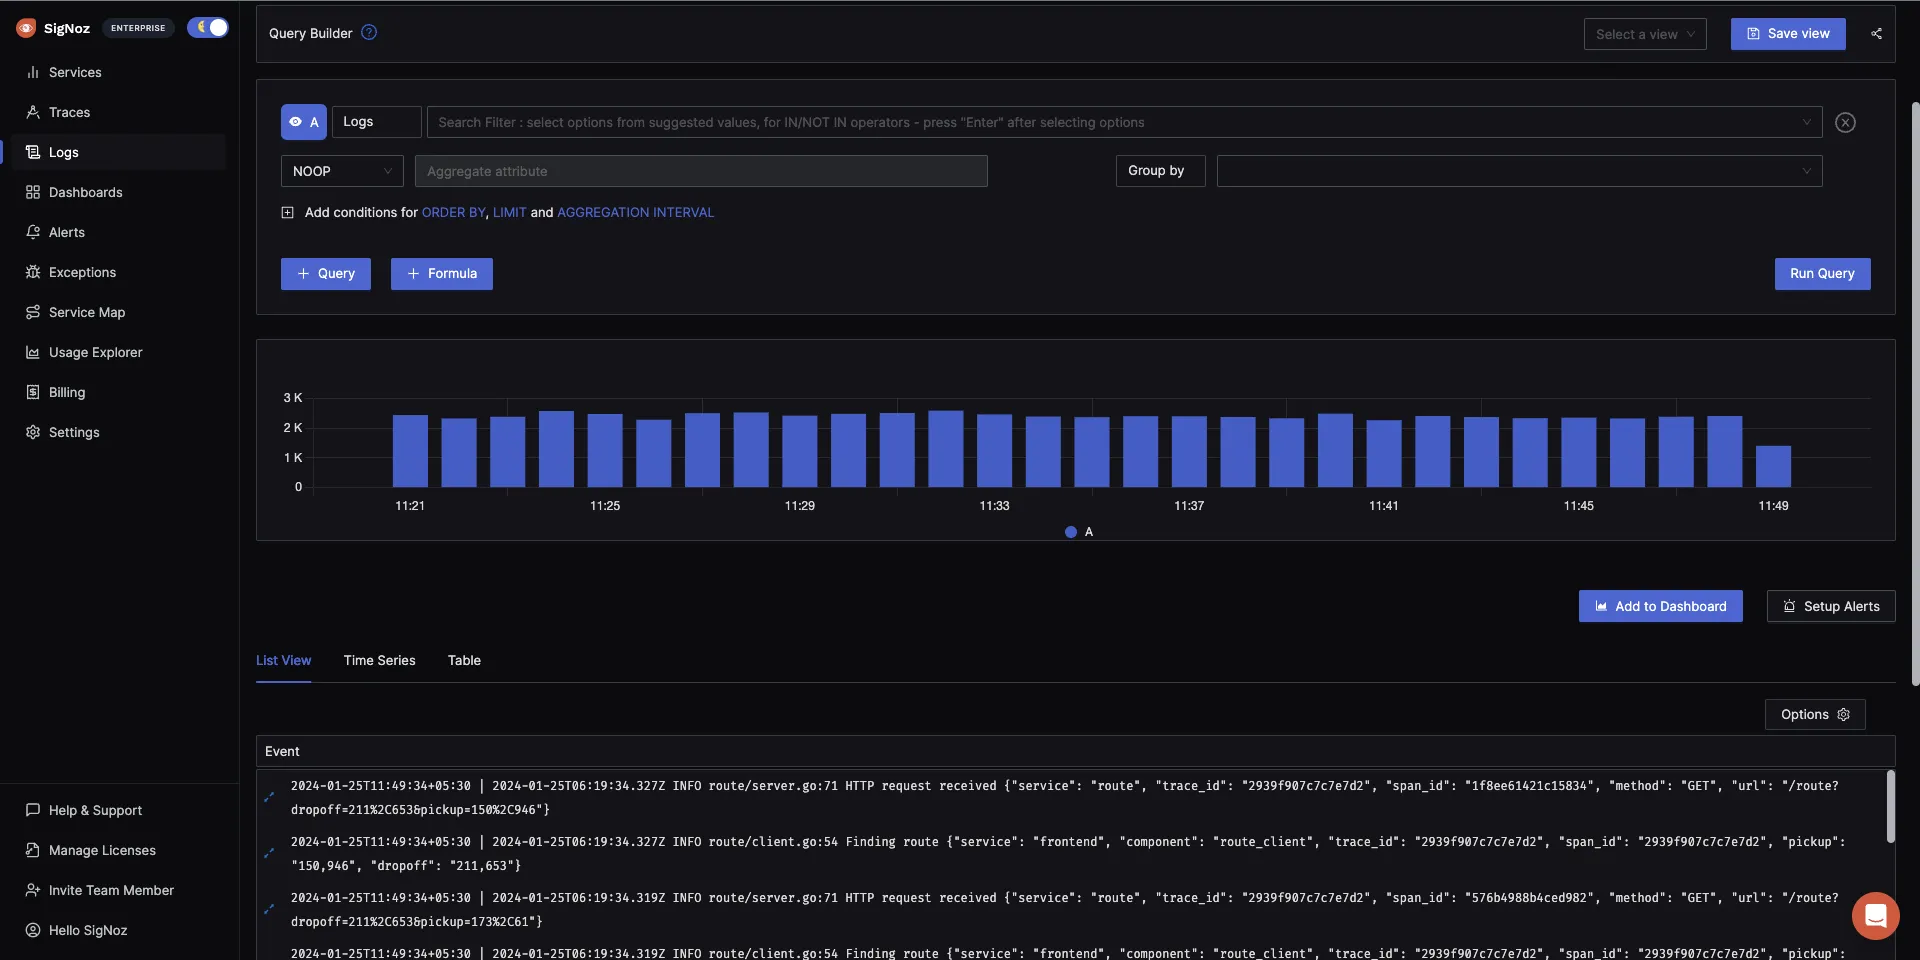
You can also view logs in real time with live tail logging.
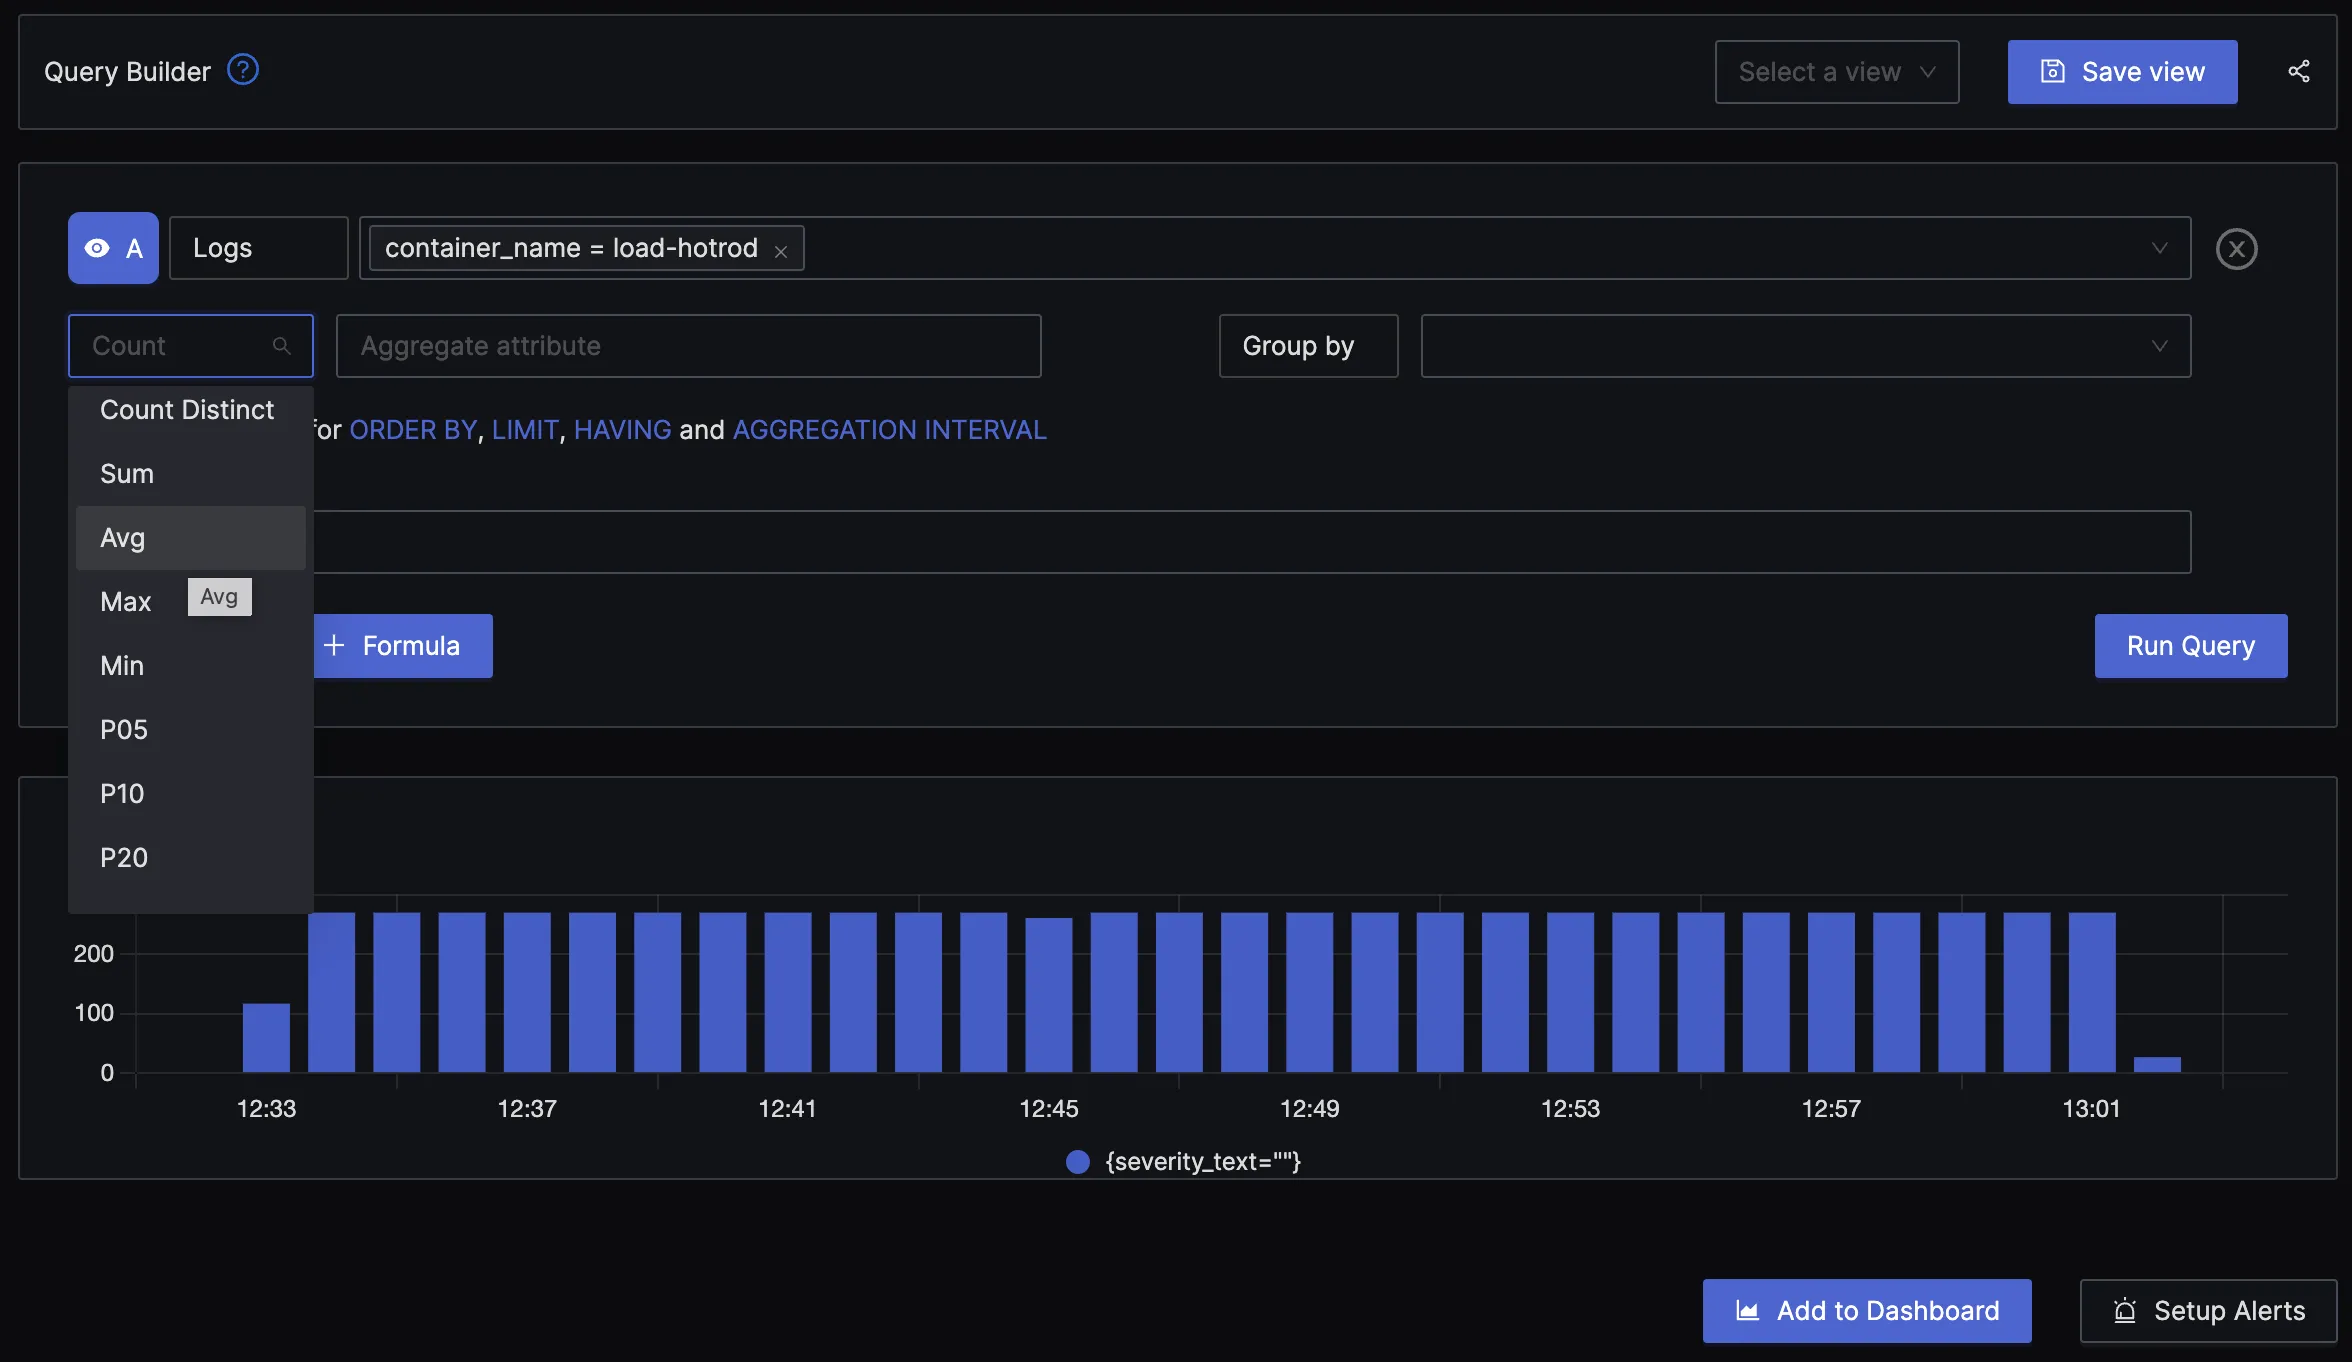
With advanced Log Query Builder, you can filter out logs quickly with a mix and match of fields.
If you're comparing options in this space, a few related guides are worth a look: Elasticsearch vs OpenSearch and OpenSearch vs Splunk, plus the ELK alternatives and Splunk alternatives roundups for the wider field. Elasticsearch vs MongoDB, Loki vs Elasticsearch, and Datadog vs Splunk cover other common matchups.
Getting started with SigNoz
SigNoz Cloud is the easiest way to run SigNoz. Sign up for a free account and get 30 days of unlimited access to all features.

You can also install and self-host SigNoz yourself since it is open-source. With 24,000+ GitHub stars, open-source SigNoz is loved by developers. Find the instructions to self-host SigNoz.
Related Posts
