Datadog vs Elastic stack - In-Depth Comparison Guide [2026]
Datadog and Elastic Stack are both widely used platforms for monitoring and analyzing data, offering comprehensive solutions for various use cases including log management, infrastructure monitoring, application performance monitoring, and more.
Datadog provides an all-in-one cloud-based platform with integrated monitoring, alerting, and visualization capabilities, while the Elastic Stack offers a combination of Elasticsearch, Logstash, and Kibana (formerly referred to as ELK Stack) which is designed for real-time data search, analysis, and monitoring of applications.
In this post, I have compared Datadog and ELK on important features like APM, log management, error monitoring, infrastructure monitoring, etc.
Datadog vs Elastic Stack**: At a glance**
The Elastic Stack comes with an open-source and cloud-based version (Elastic Cloud), a managed version of the Elastic Stack. We will be comparing Datadog, a cloud based tool against Elastic Stack's cloud-based offering.
| Features | Datadog | Elastic Stack |
|---|---|---|
| APM | ✅ | ✅ |
| Log Management | ✅ | ✅ |
| Infrastructure Monitoring | ✅ | ✅ |
| Synthetic Monitoring | ✅ | ✅ |
| AIOps | ✅ | ✅ |
| Real User Monitoring | ✅ | ✅ |
| Search capabilities | 🟡 | ✅ |
| Application Security | ✅ | ✅ |
| Open-Source Version | ❌ | ✅ |
| Profiling | ✅ | ✅ |
| Alerting | ✅ | ✅ |
| OpenTelemetry Support | 🟡 | ✅ |
| Cloud SIEM | ✅ | ✅ |
| 14-days Free Trial | ✅ | ✅ |
✅ - Available
❌ - Not Available
🟡 - Limited
Error Monitoring: Datadog
Datadog
Datadog's error monitoring system provides detailed insights into error patterns, including the frequency, impact, and root causes. This aids in quicker and more effective troubleshooting, enabling the tracking, triage, and debugging of errors with ease.
One of its key features is its error grouping capability. This allowed it to group similar errors coming from my application into a single issue for easy identification of important errors and noise reduction. It also allows for the creation of error tracking monitors which can alert you when an issue in your application starts.
Elastic Stack
Elastic Stack’s error monitoring is closely integrated with its APM feature. It identifies the origin of an error, and its relation to a transaction and records data about the environment in which the event occurred, such as service details, host information, process details, URL, and user information.
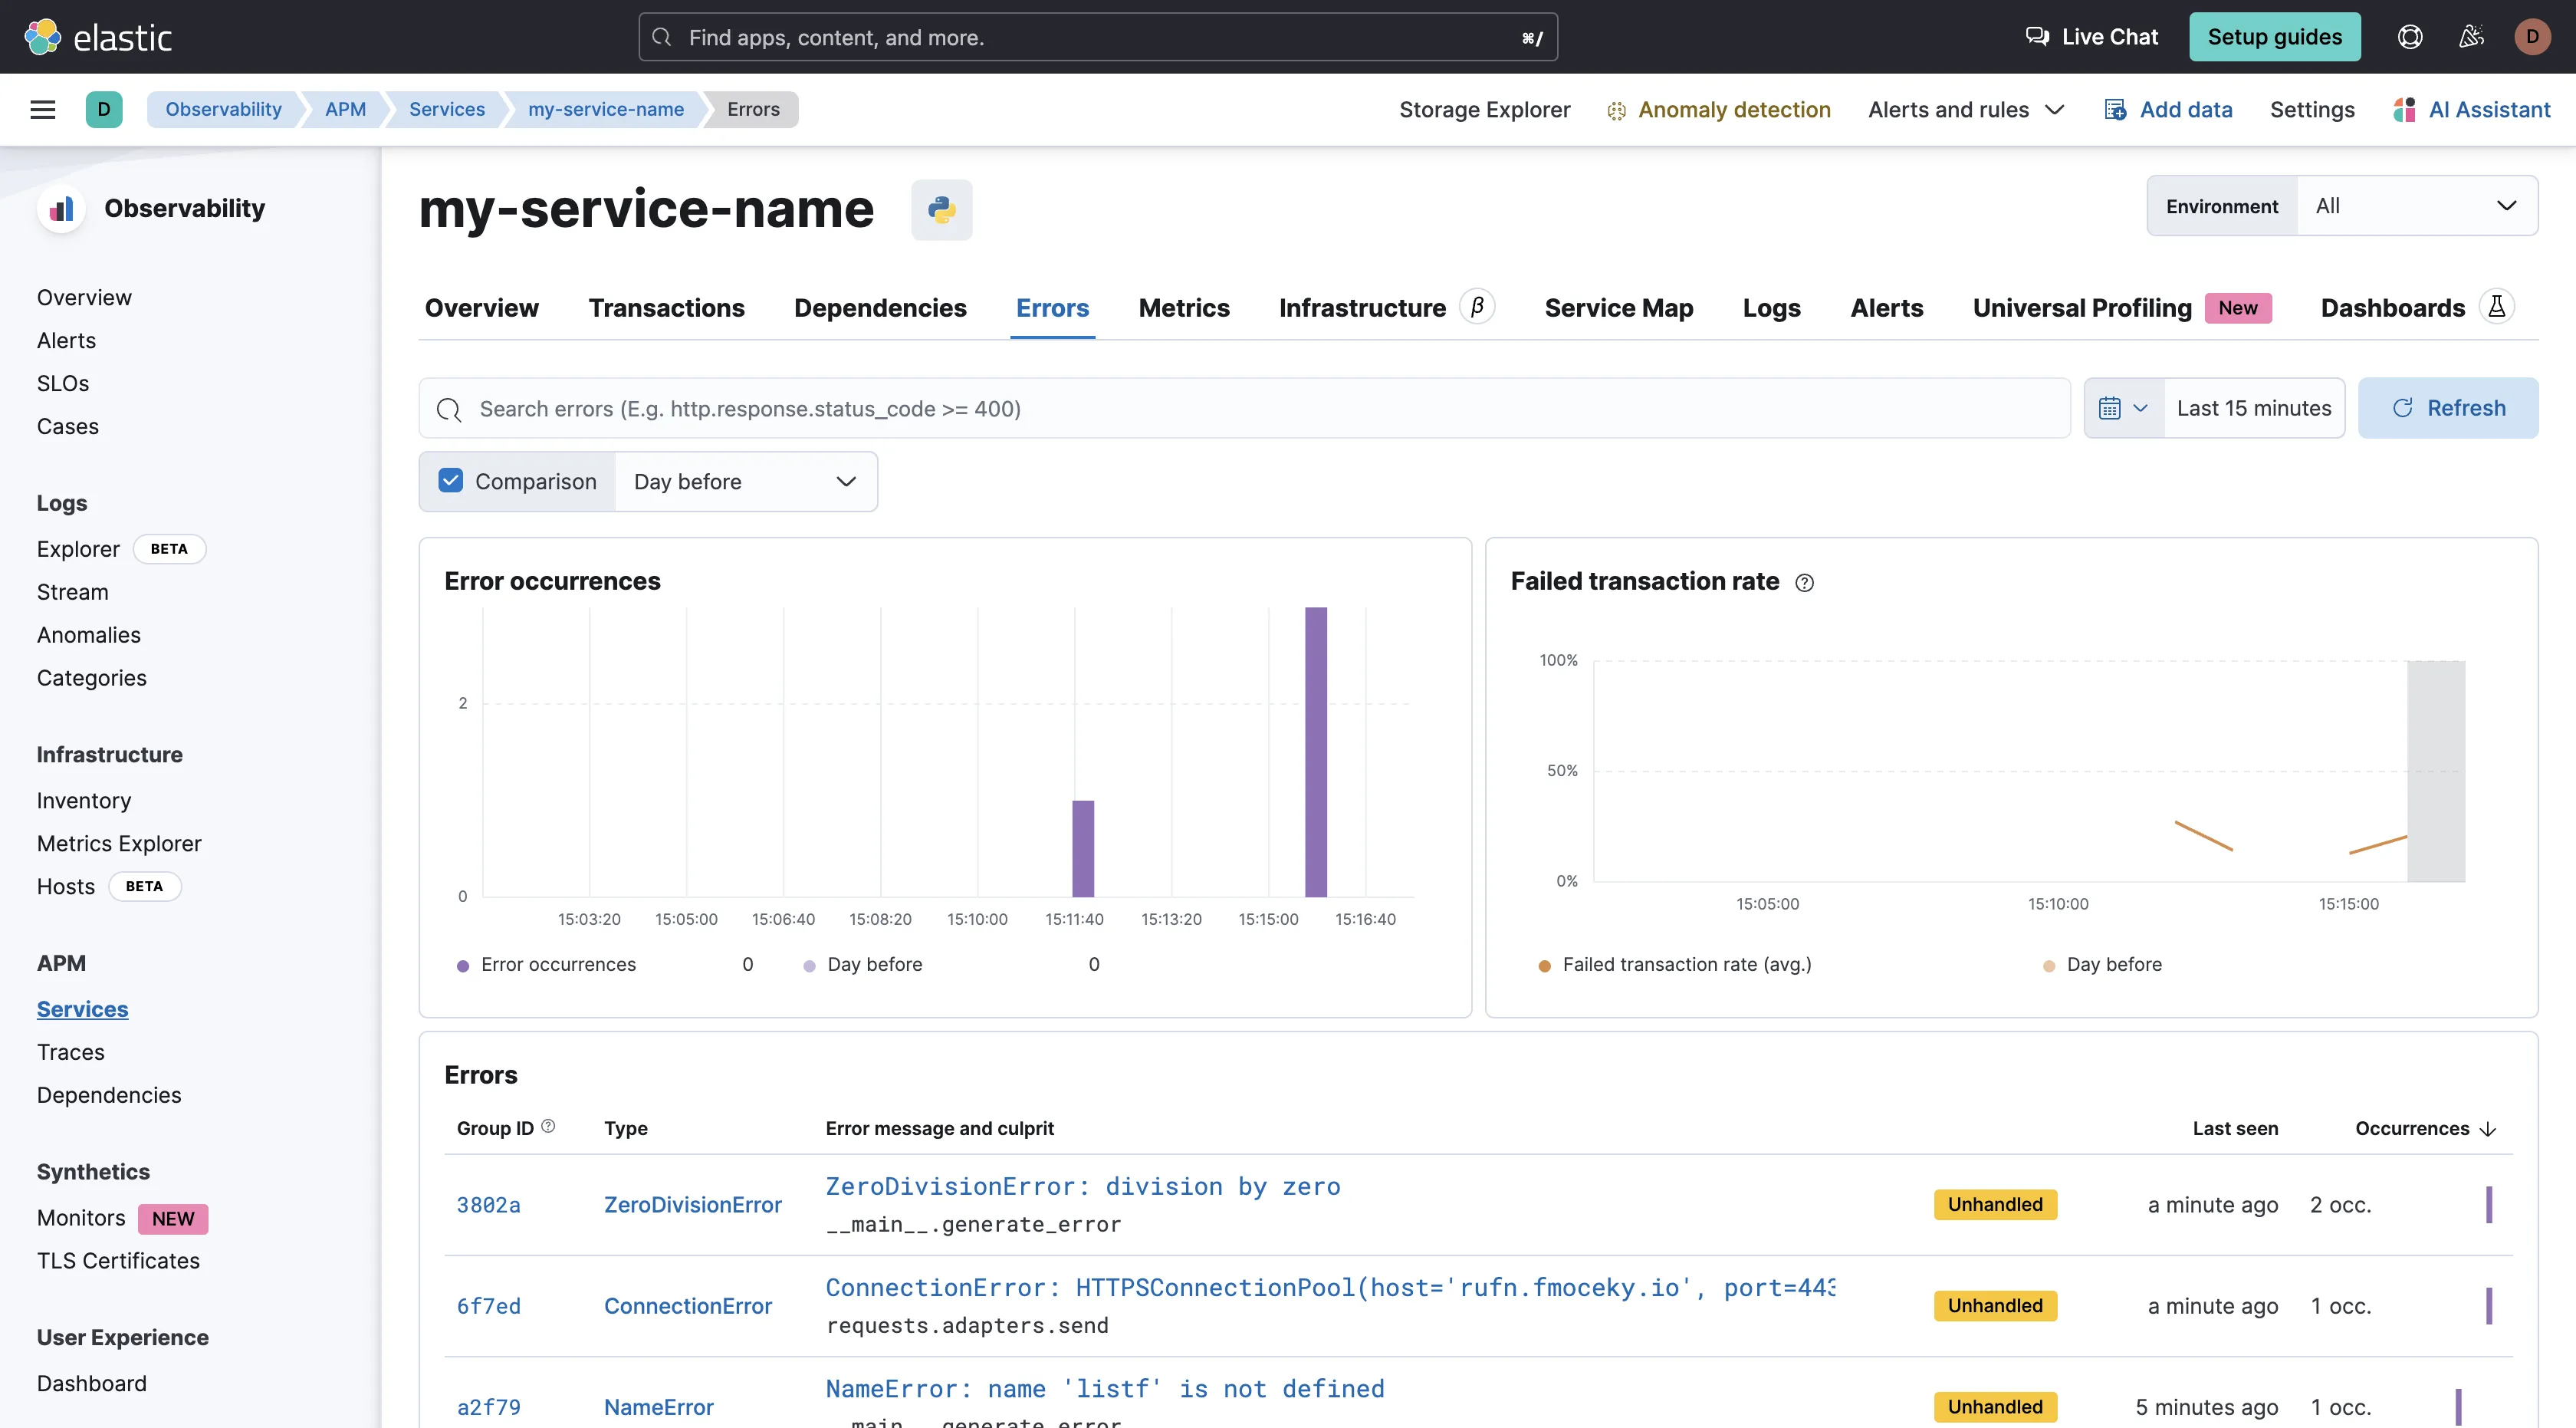
Between both tools, Datadog provides more information about an error and provides more filters.
Log Management
Datadog
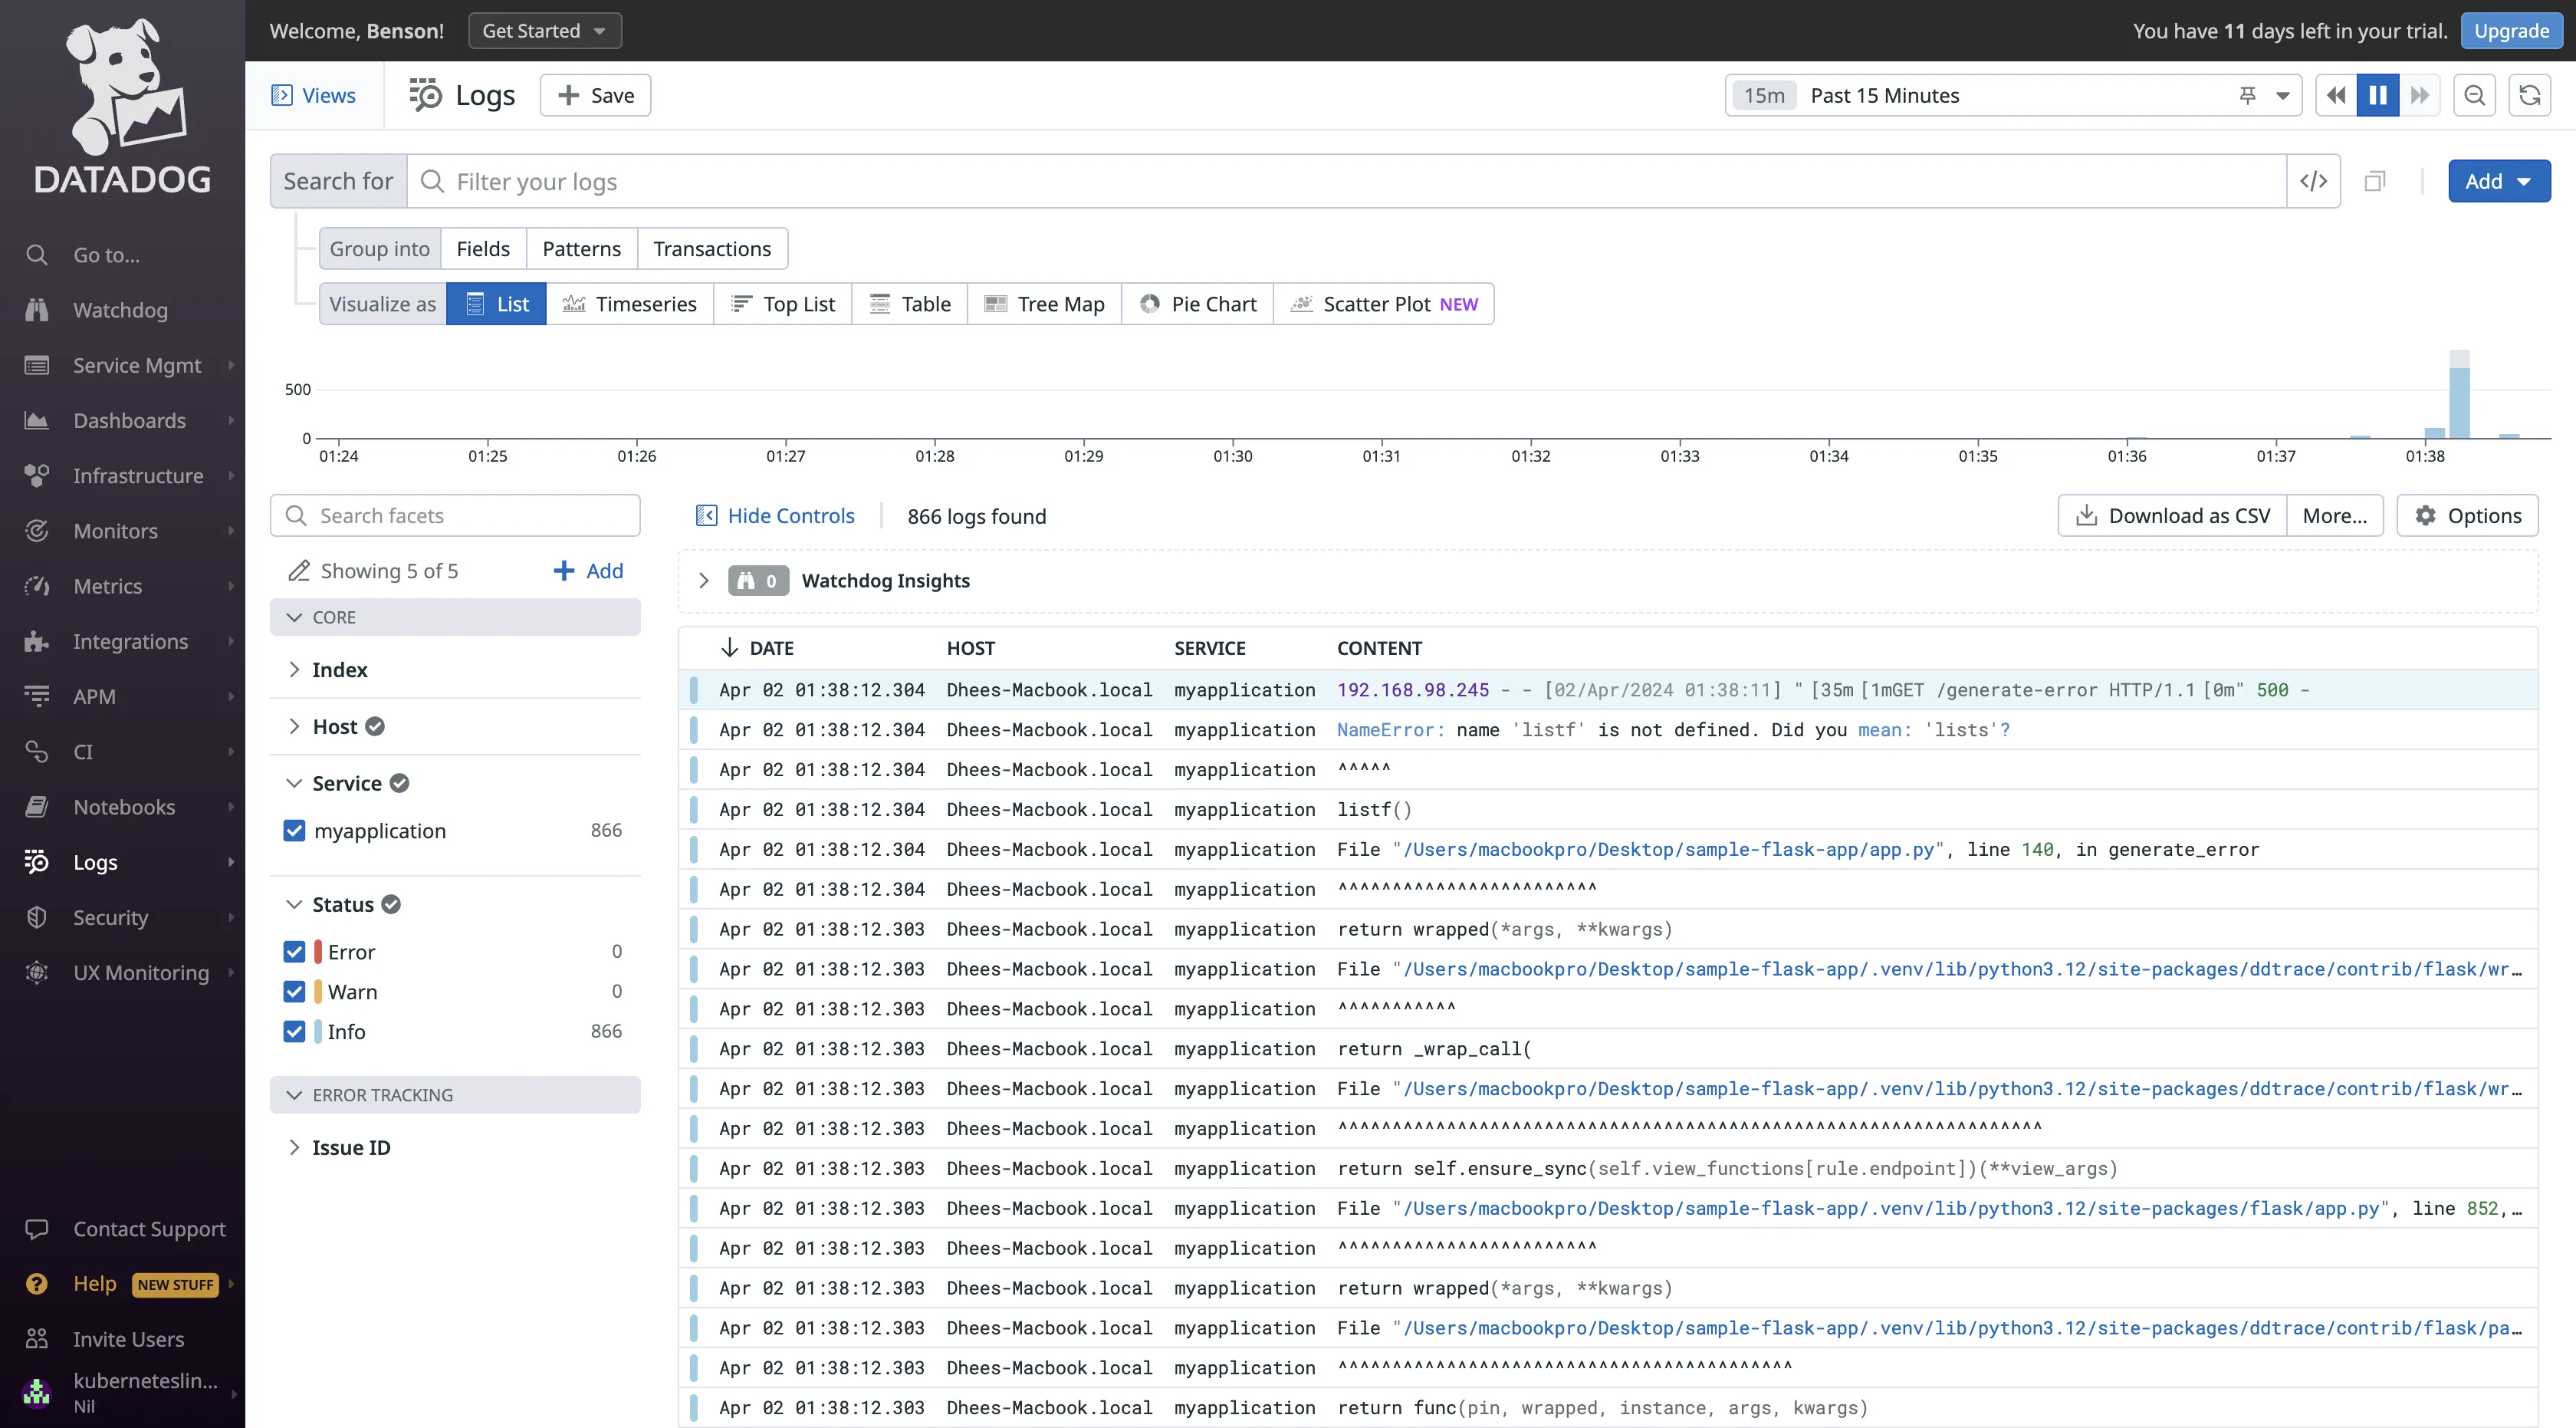
Datadog’s agent doesn’t collect logs by default, it requires a separate setup for log management. Datadog's log monitoring simplifies the process of monitoring log events across your cloud environment in real-time. It allows for the ingestion, analysis, and archiving of 100% of logs, enabling easy rehydration of old logs for audits or historical analysis and seamless correlation of logs with related traces and metrics for enhanced troubleshooting context. This "Logging without Limits" approach ensures cost-effective monitoring, collection, exploration, and archiving of all your logs.
Elastic Stack
ELK didn’t require any separate setup for log management, it automatically ingested my application logs.
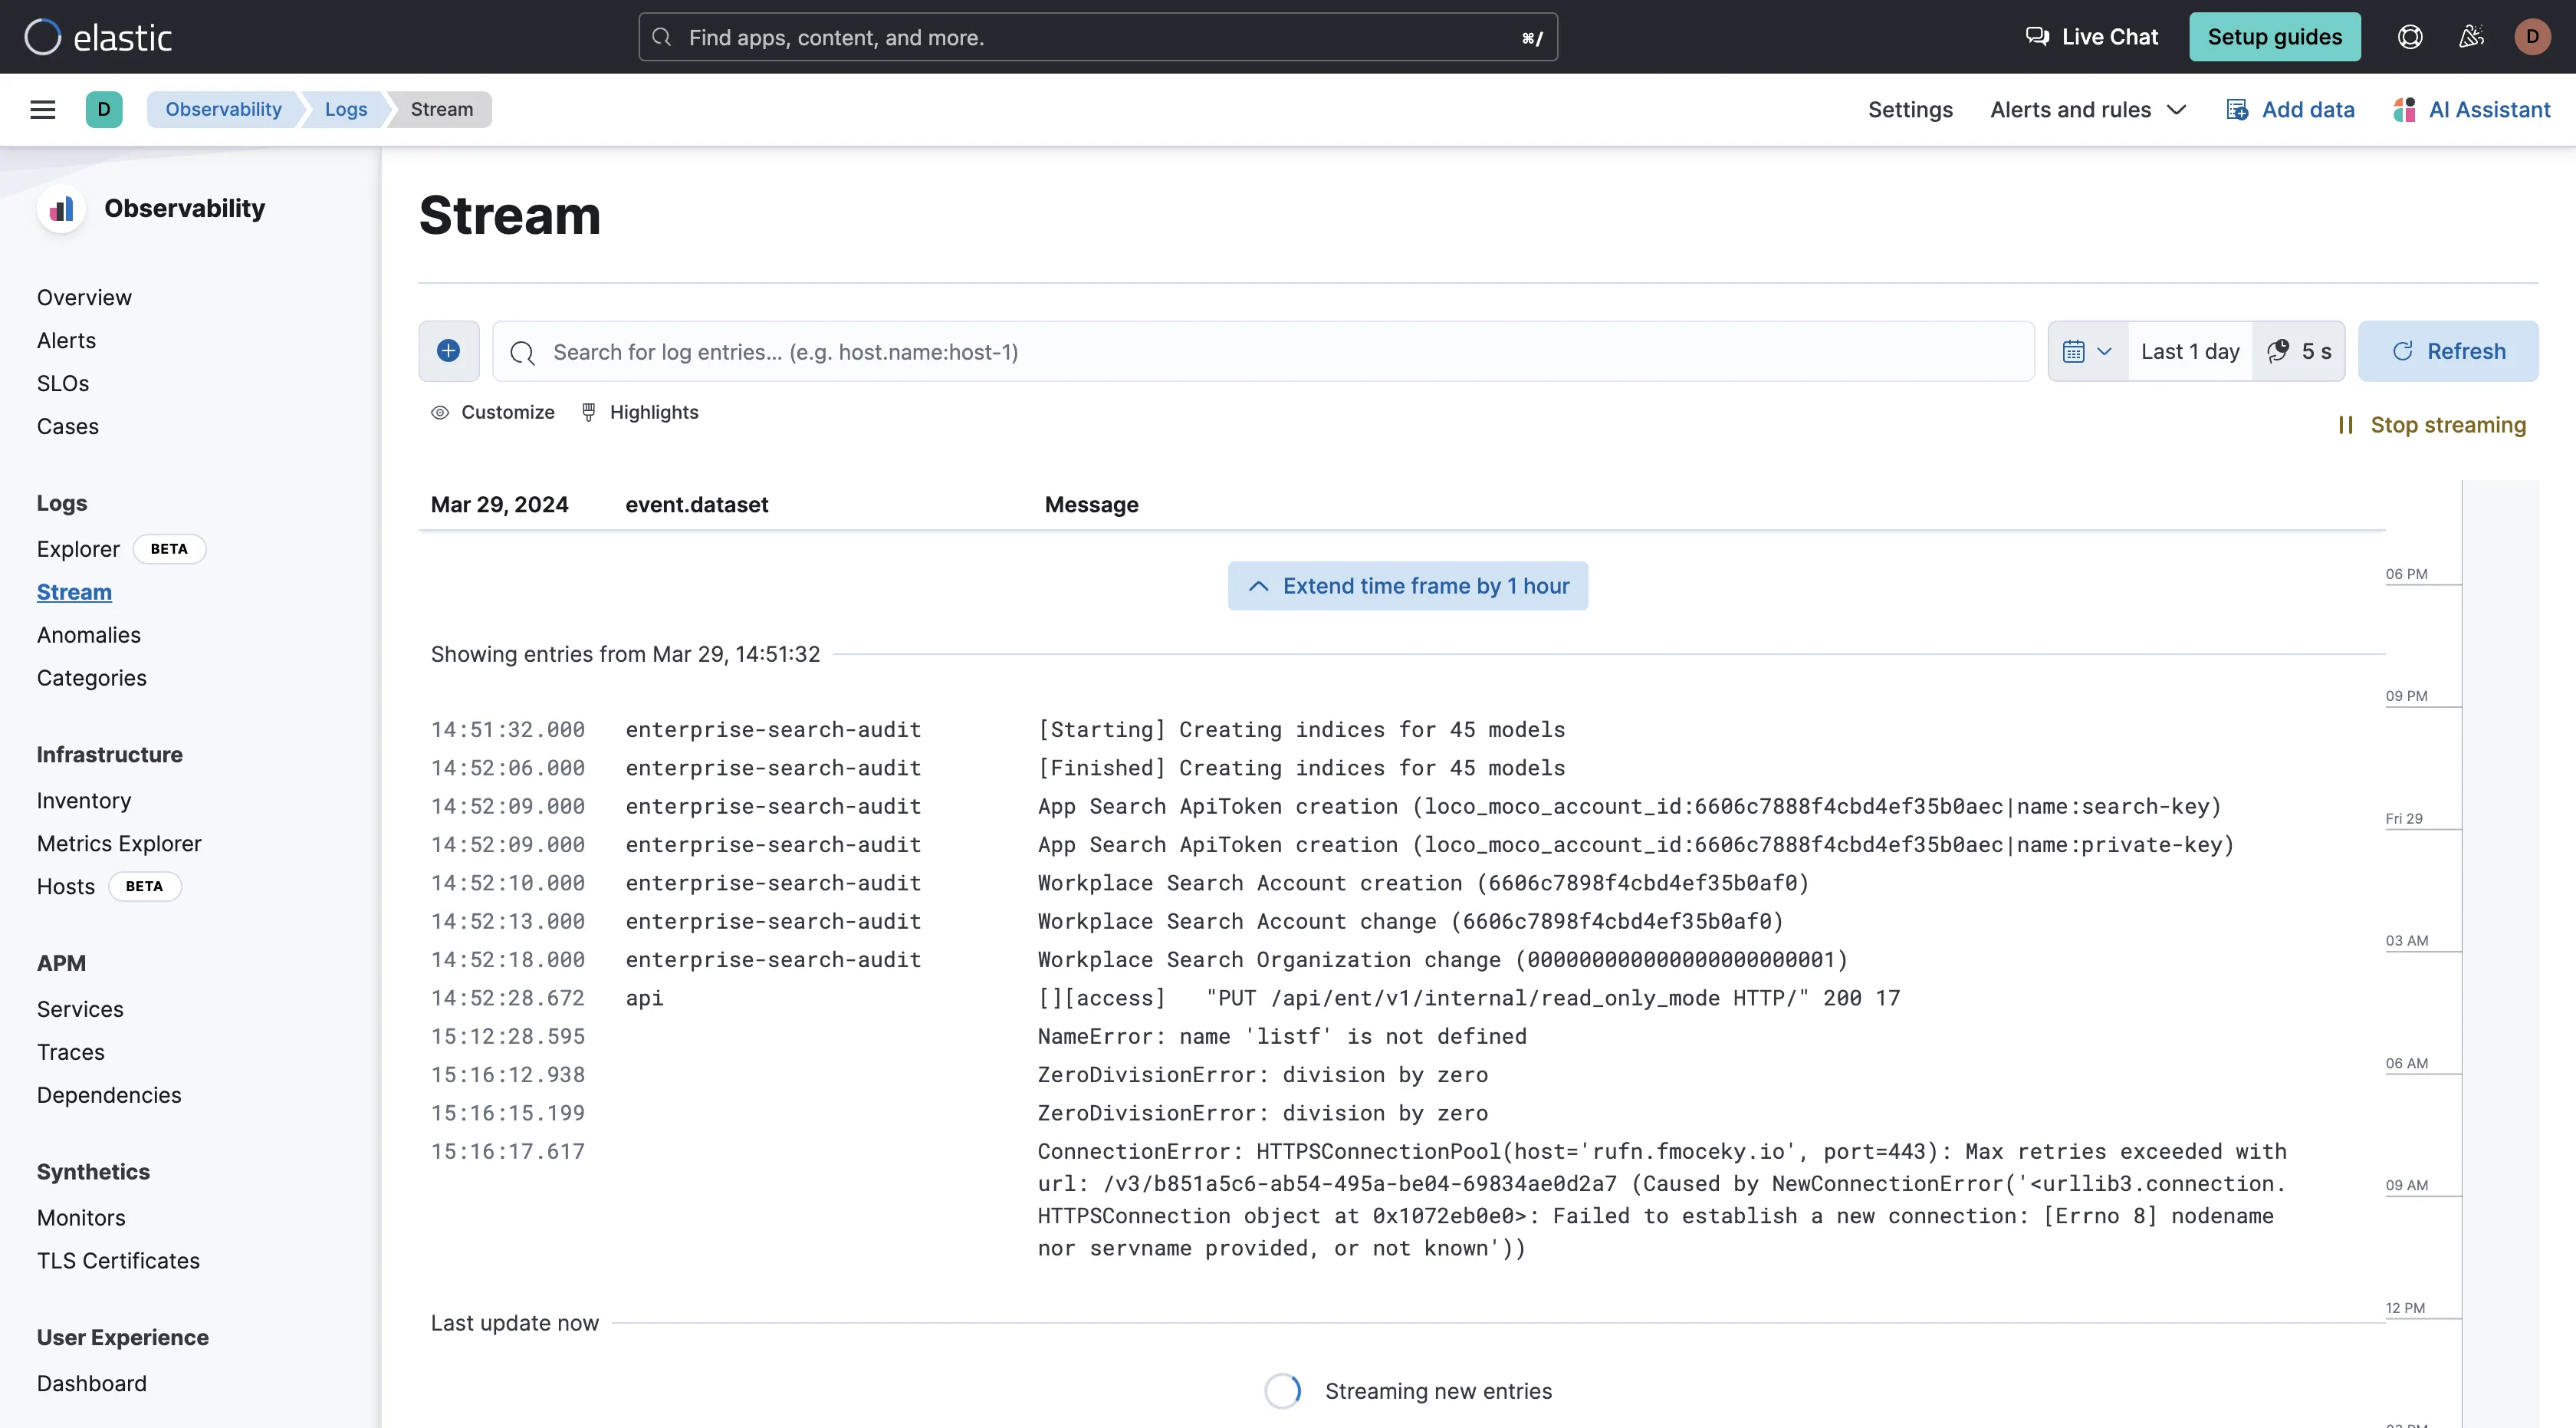
The Explorer tab provided me with information on my application and host logs. It allows for filtering log data using the KQL syntax and searching by field names.
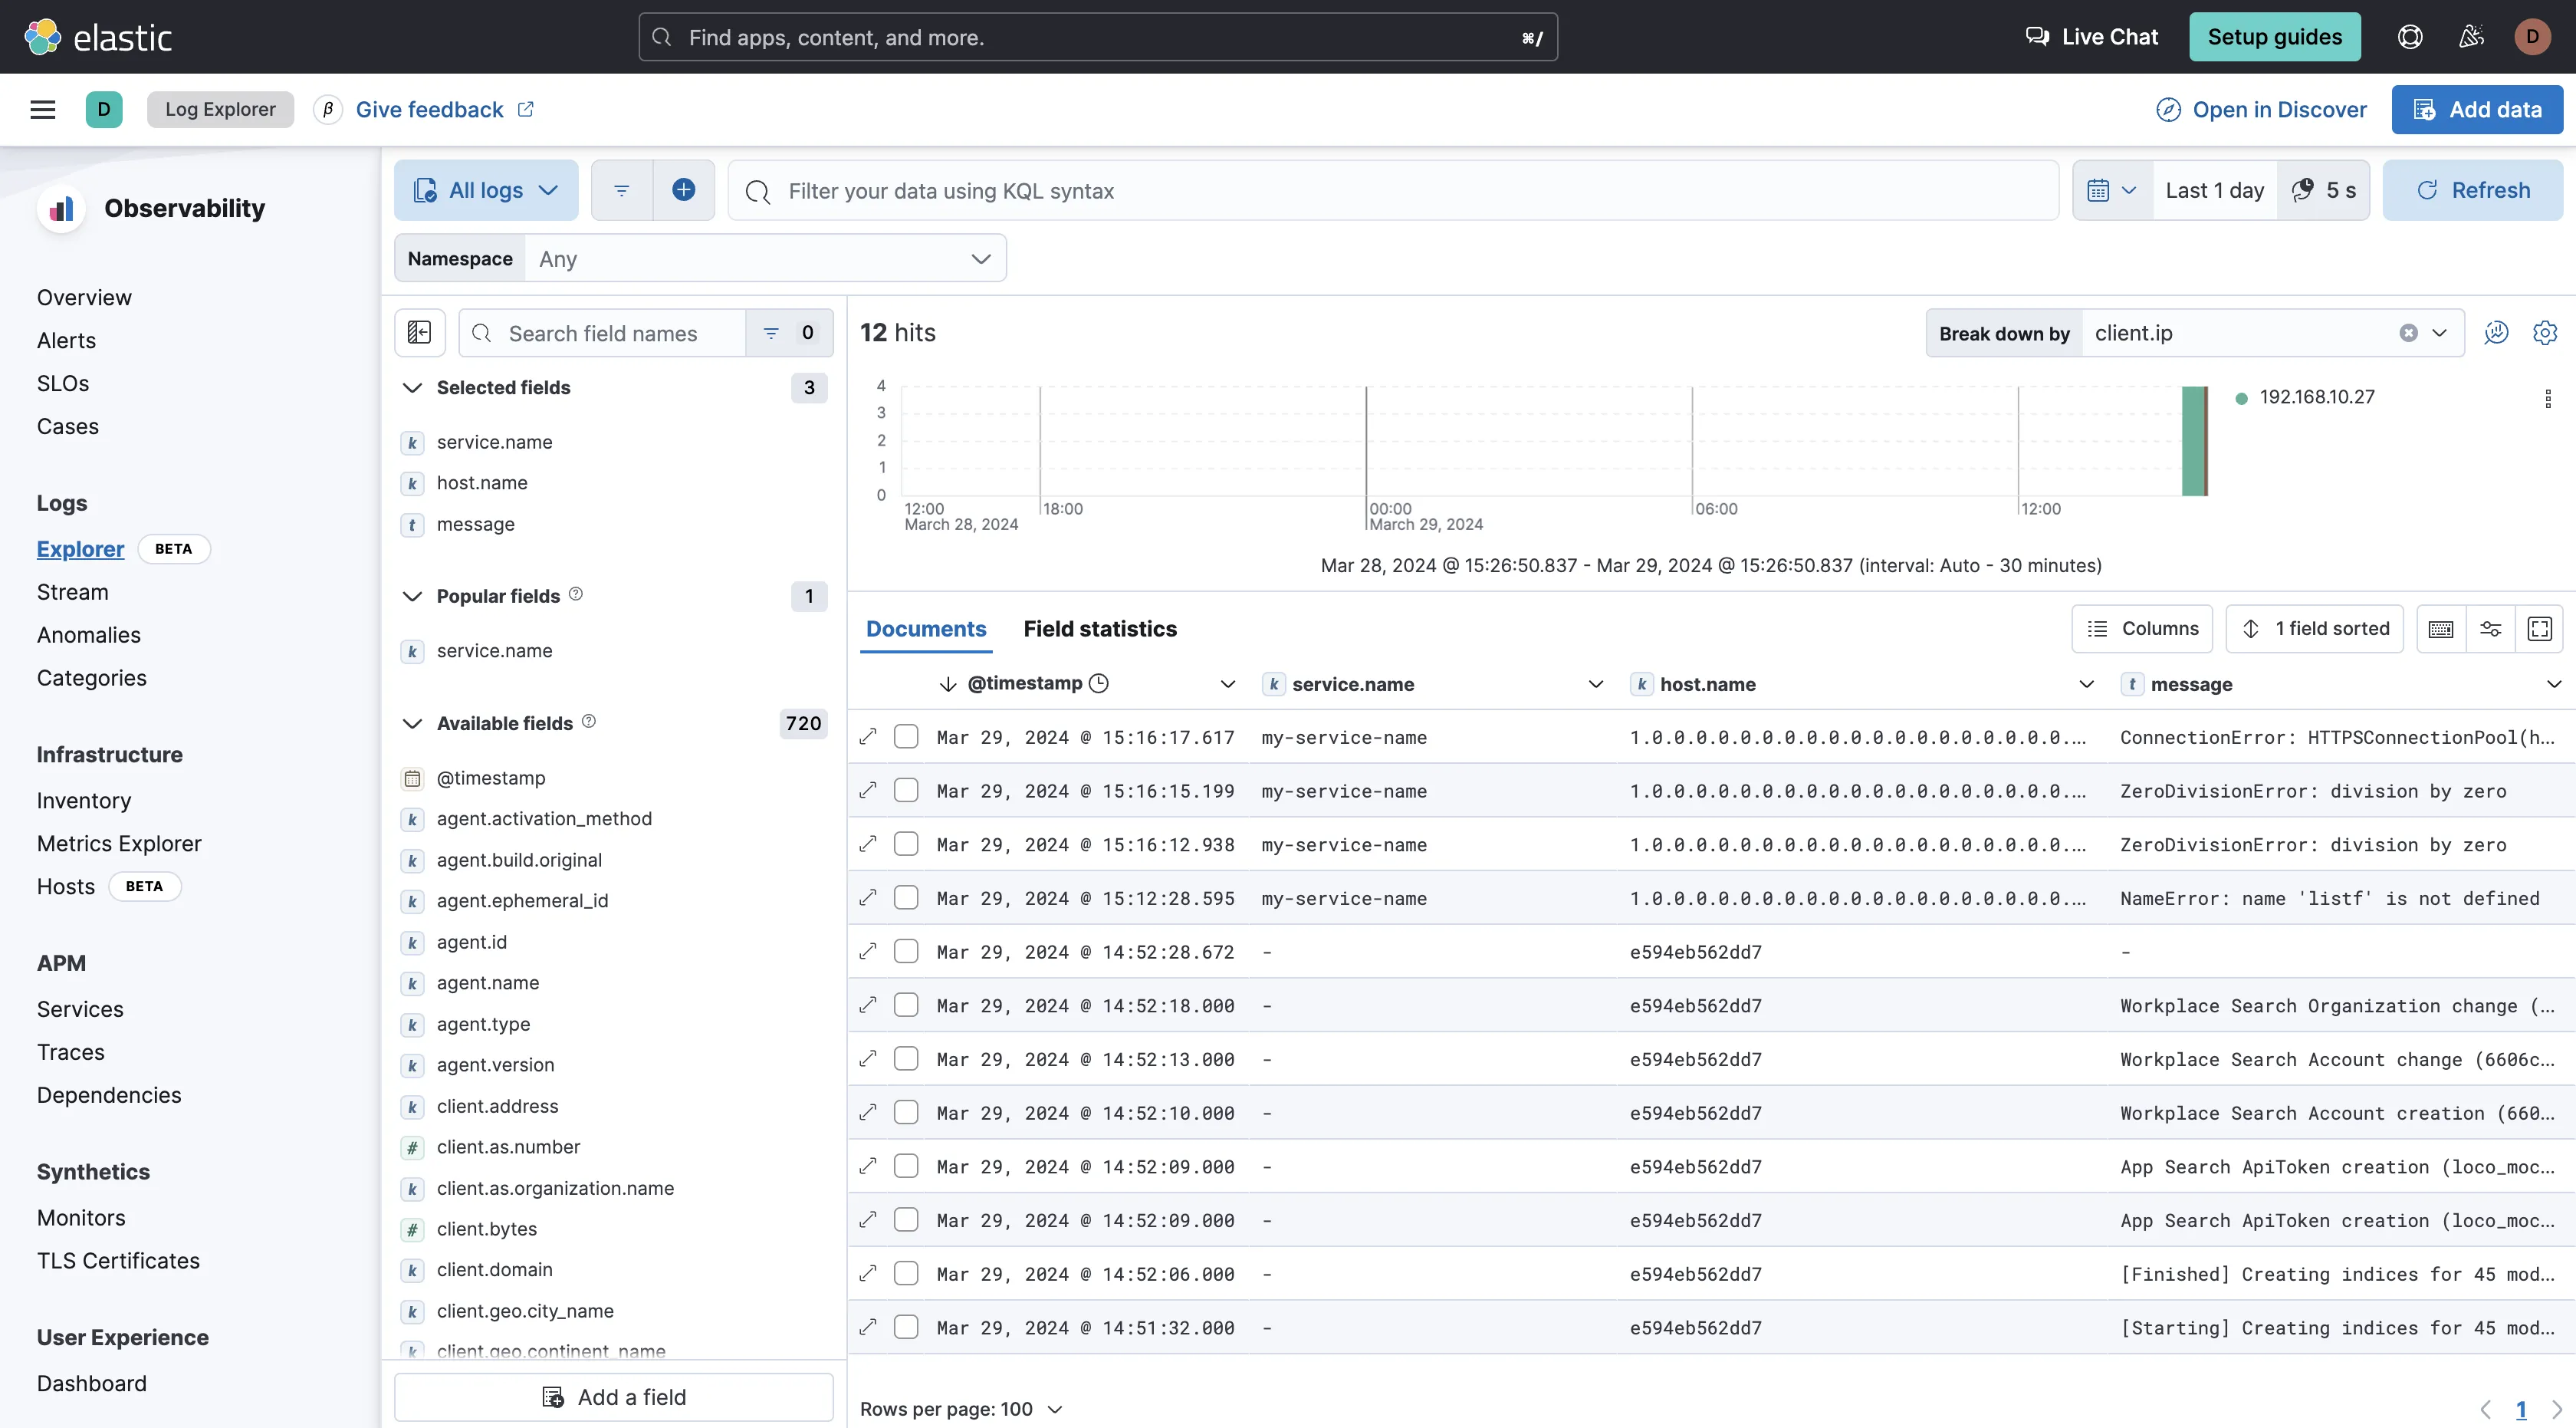
The Stream tab allows for real-time streaming of logs. It also allowed for filtering and searching of log entries.
Elastic Stack typically performs better at log management due to its core component, Elasticsearch, which is optimized for handling large volumes of log data efficiently. Elasticsearch's distributed architecture and powerful indexing capabilities enable fast and flexible search queries, making it well-suited for log analysis tasks.
Cut Your Observability Spend by 80%—Here's How
Switch from Datadog seamlessly with our automated migration tool, comparable features and up to 80% cost savings.
Infrastructure Monitoring: Both tools perform well
Datadog
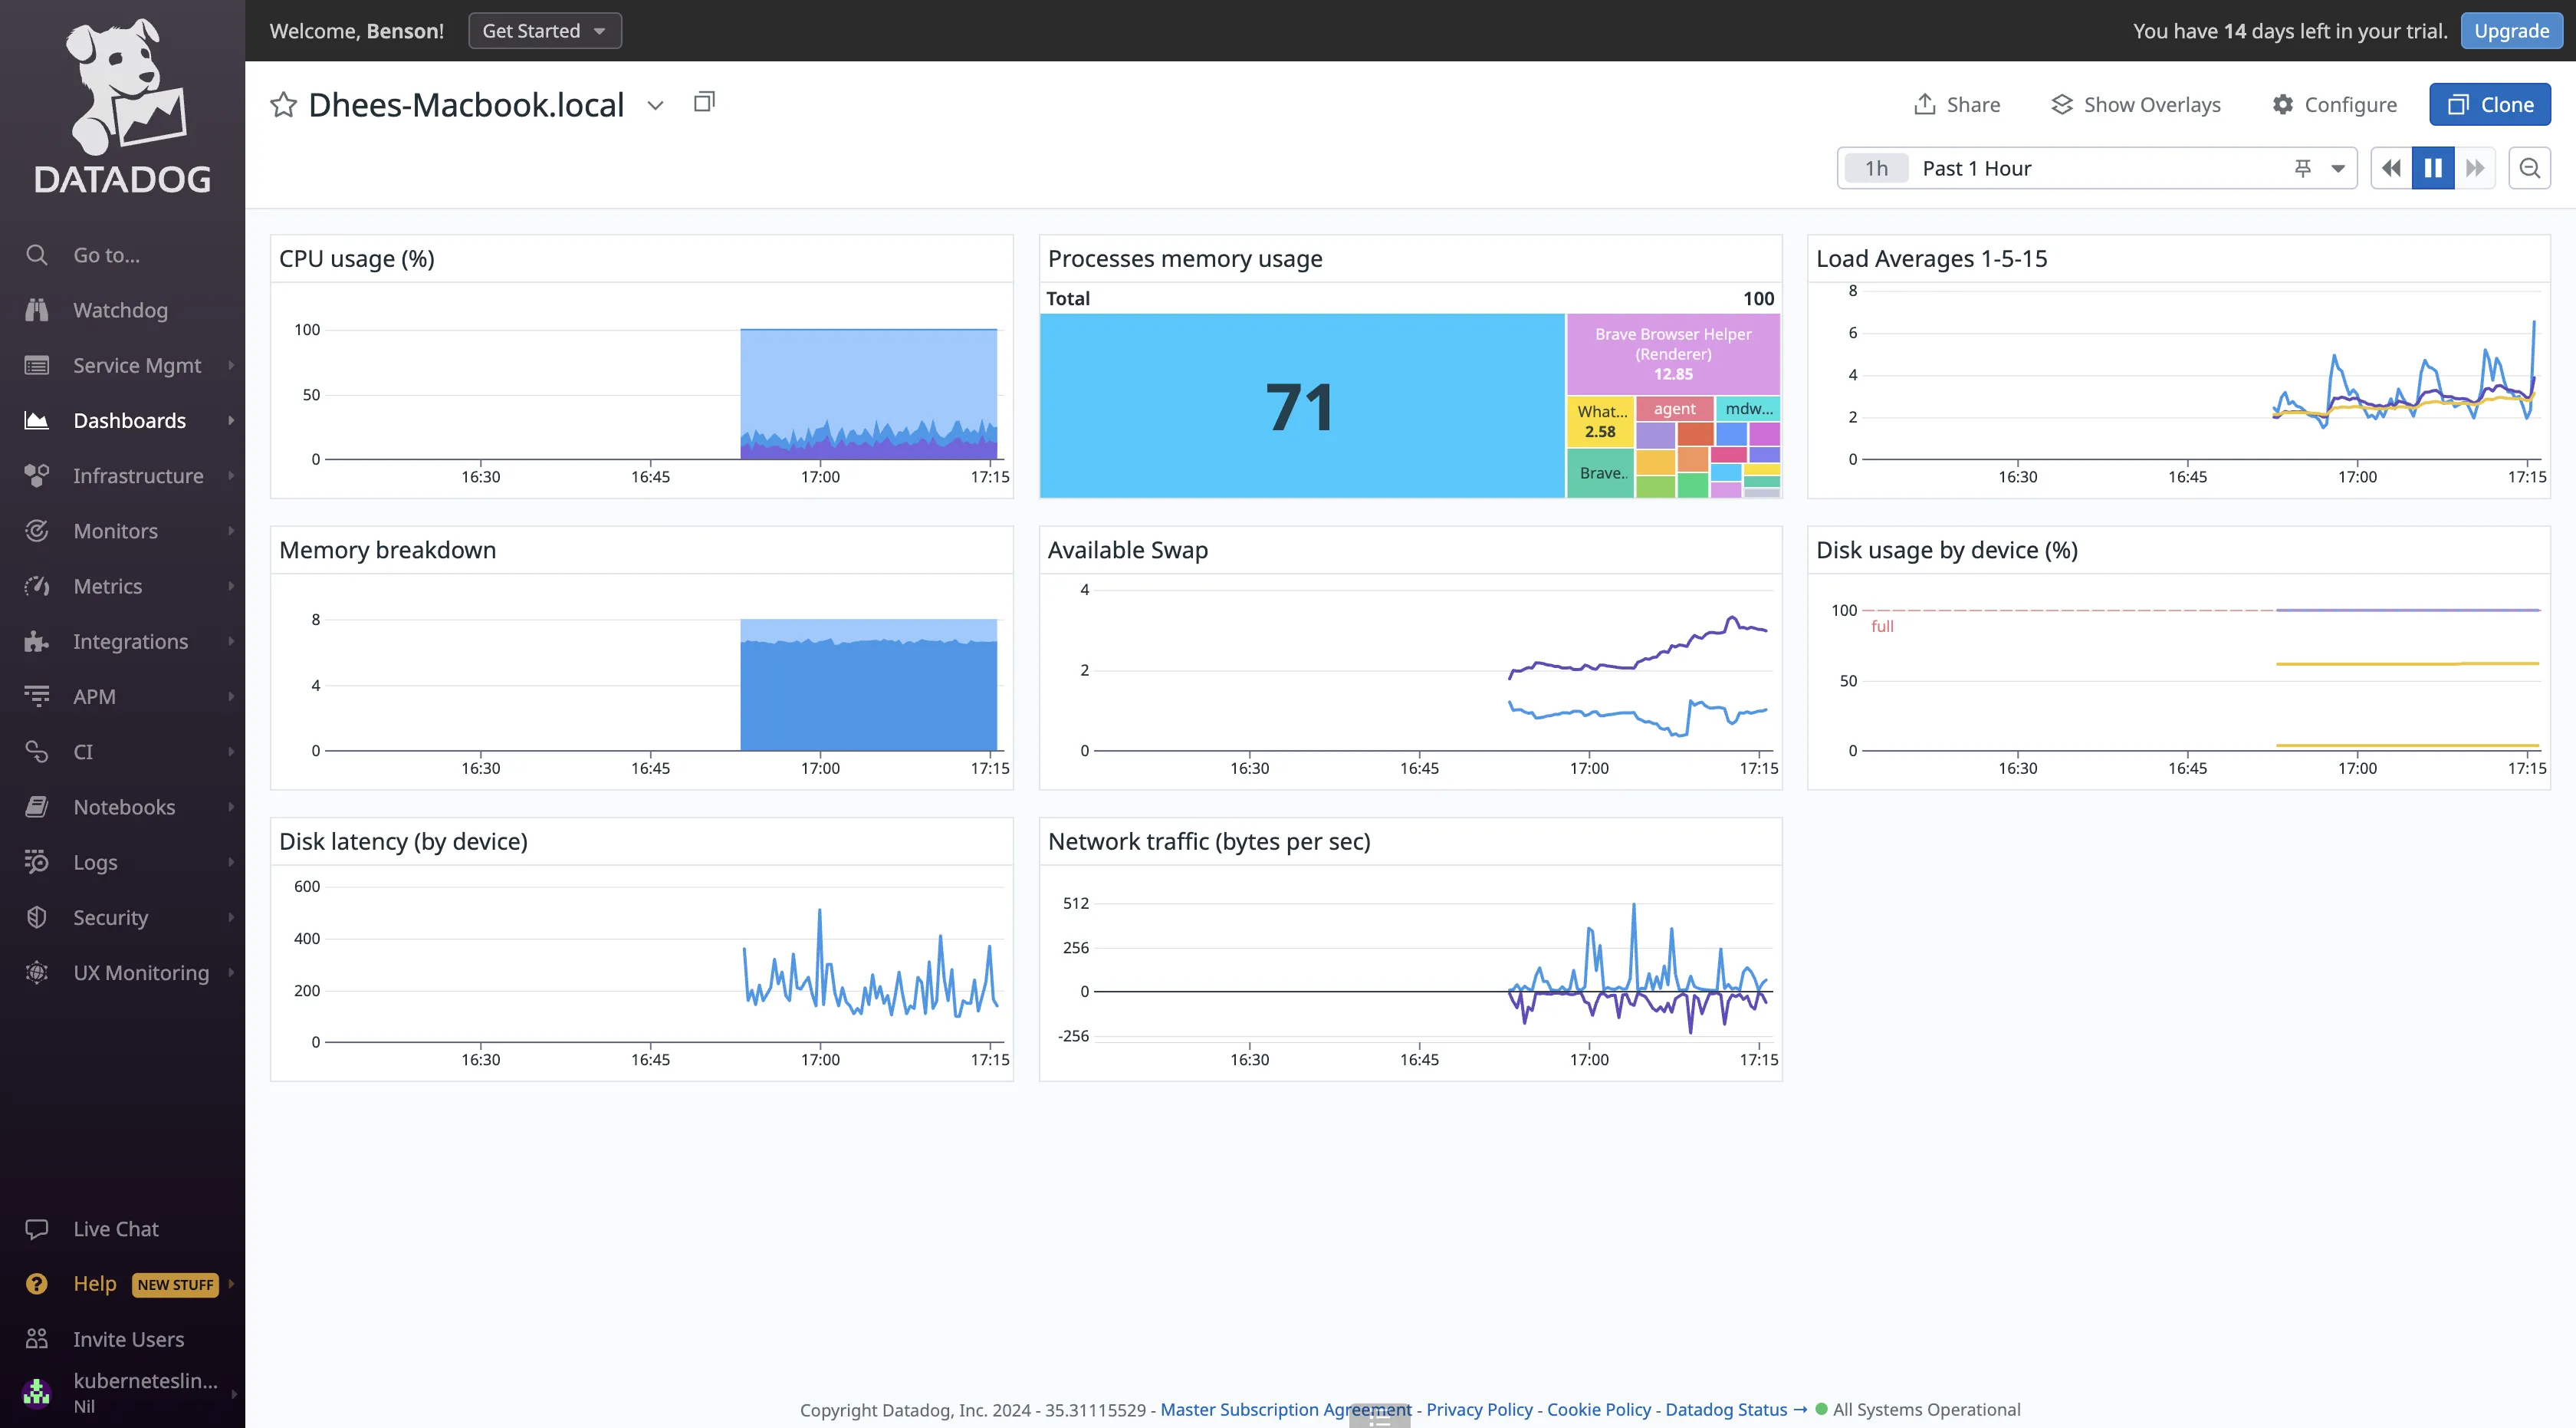
The Datadog agent is responsible for collecting system-level metrics from the hosts being monitored. This includes CPU usage, memory usage, disk IO, network latency, and more in real-time. It displays this information in out-of-the-box dashboards providing users with immediate insights into the health and performance of their infrastructure. Users have the option to clone these dashboards for modifications or create new custom dashboards to monitor distinct performance metrics.
Elastic Stack
Infrastructure monitoring with the Elastic Stack provides real-time insights into the health and performance of servers, containers, and services, enabling quick identification and resolution of issues. It helps users visualize infrastructure metrics to help diagnose problematic spikes, identify high resource utilization, automatically discover and track pods, and unify your metrics with logs and APM data in Elasticsearch.
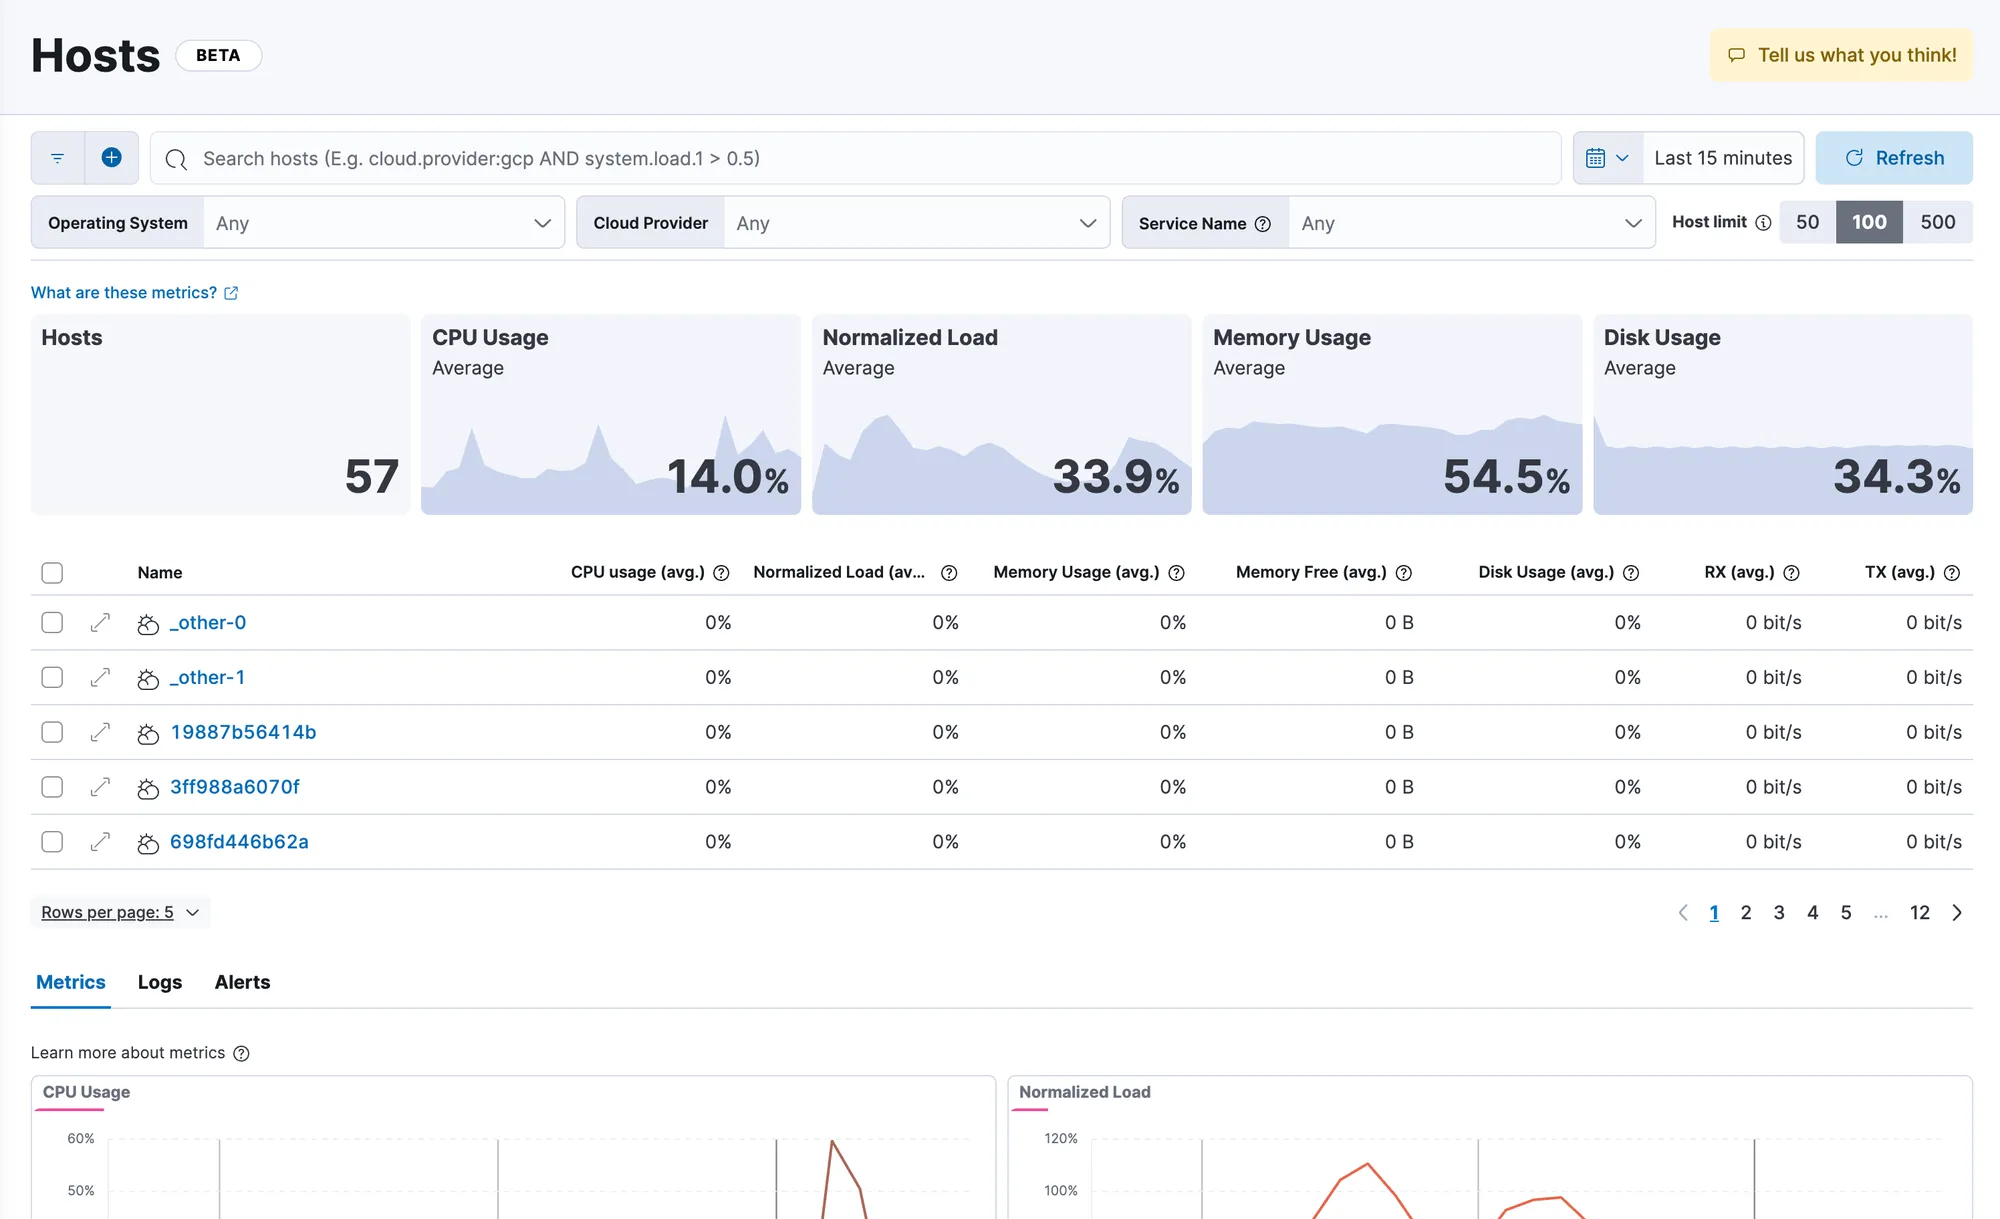
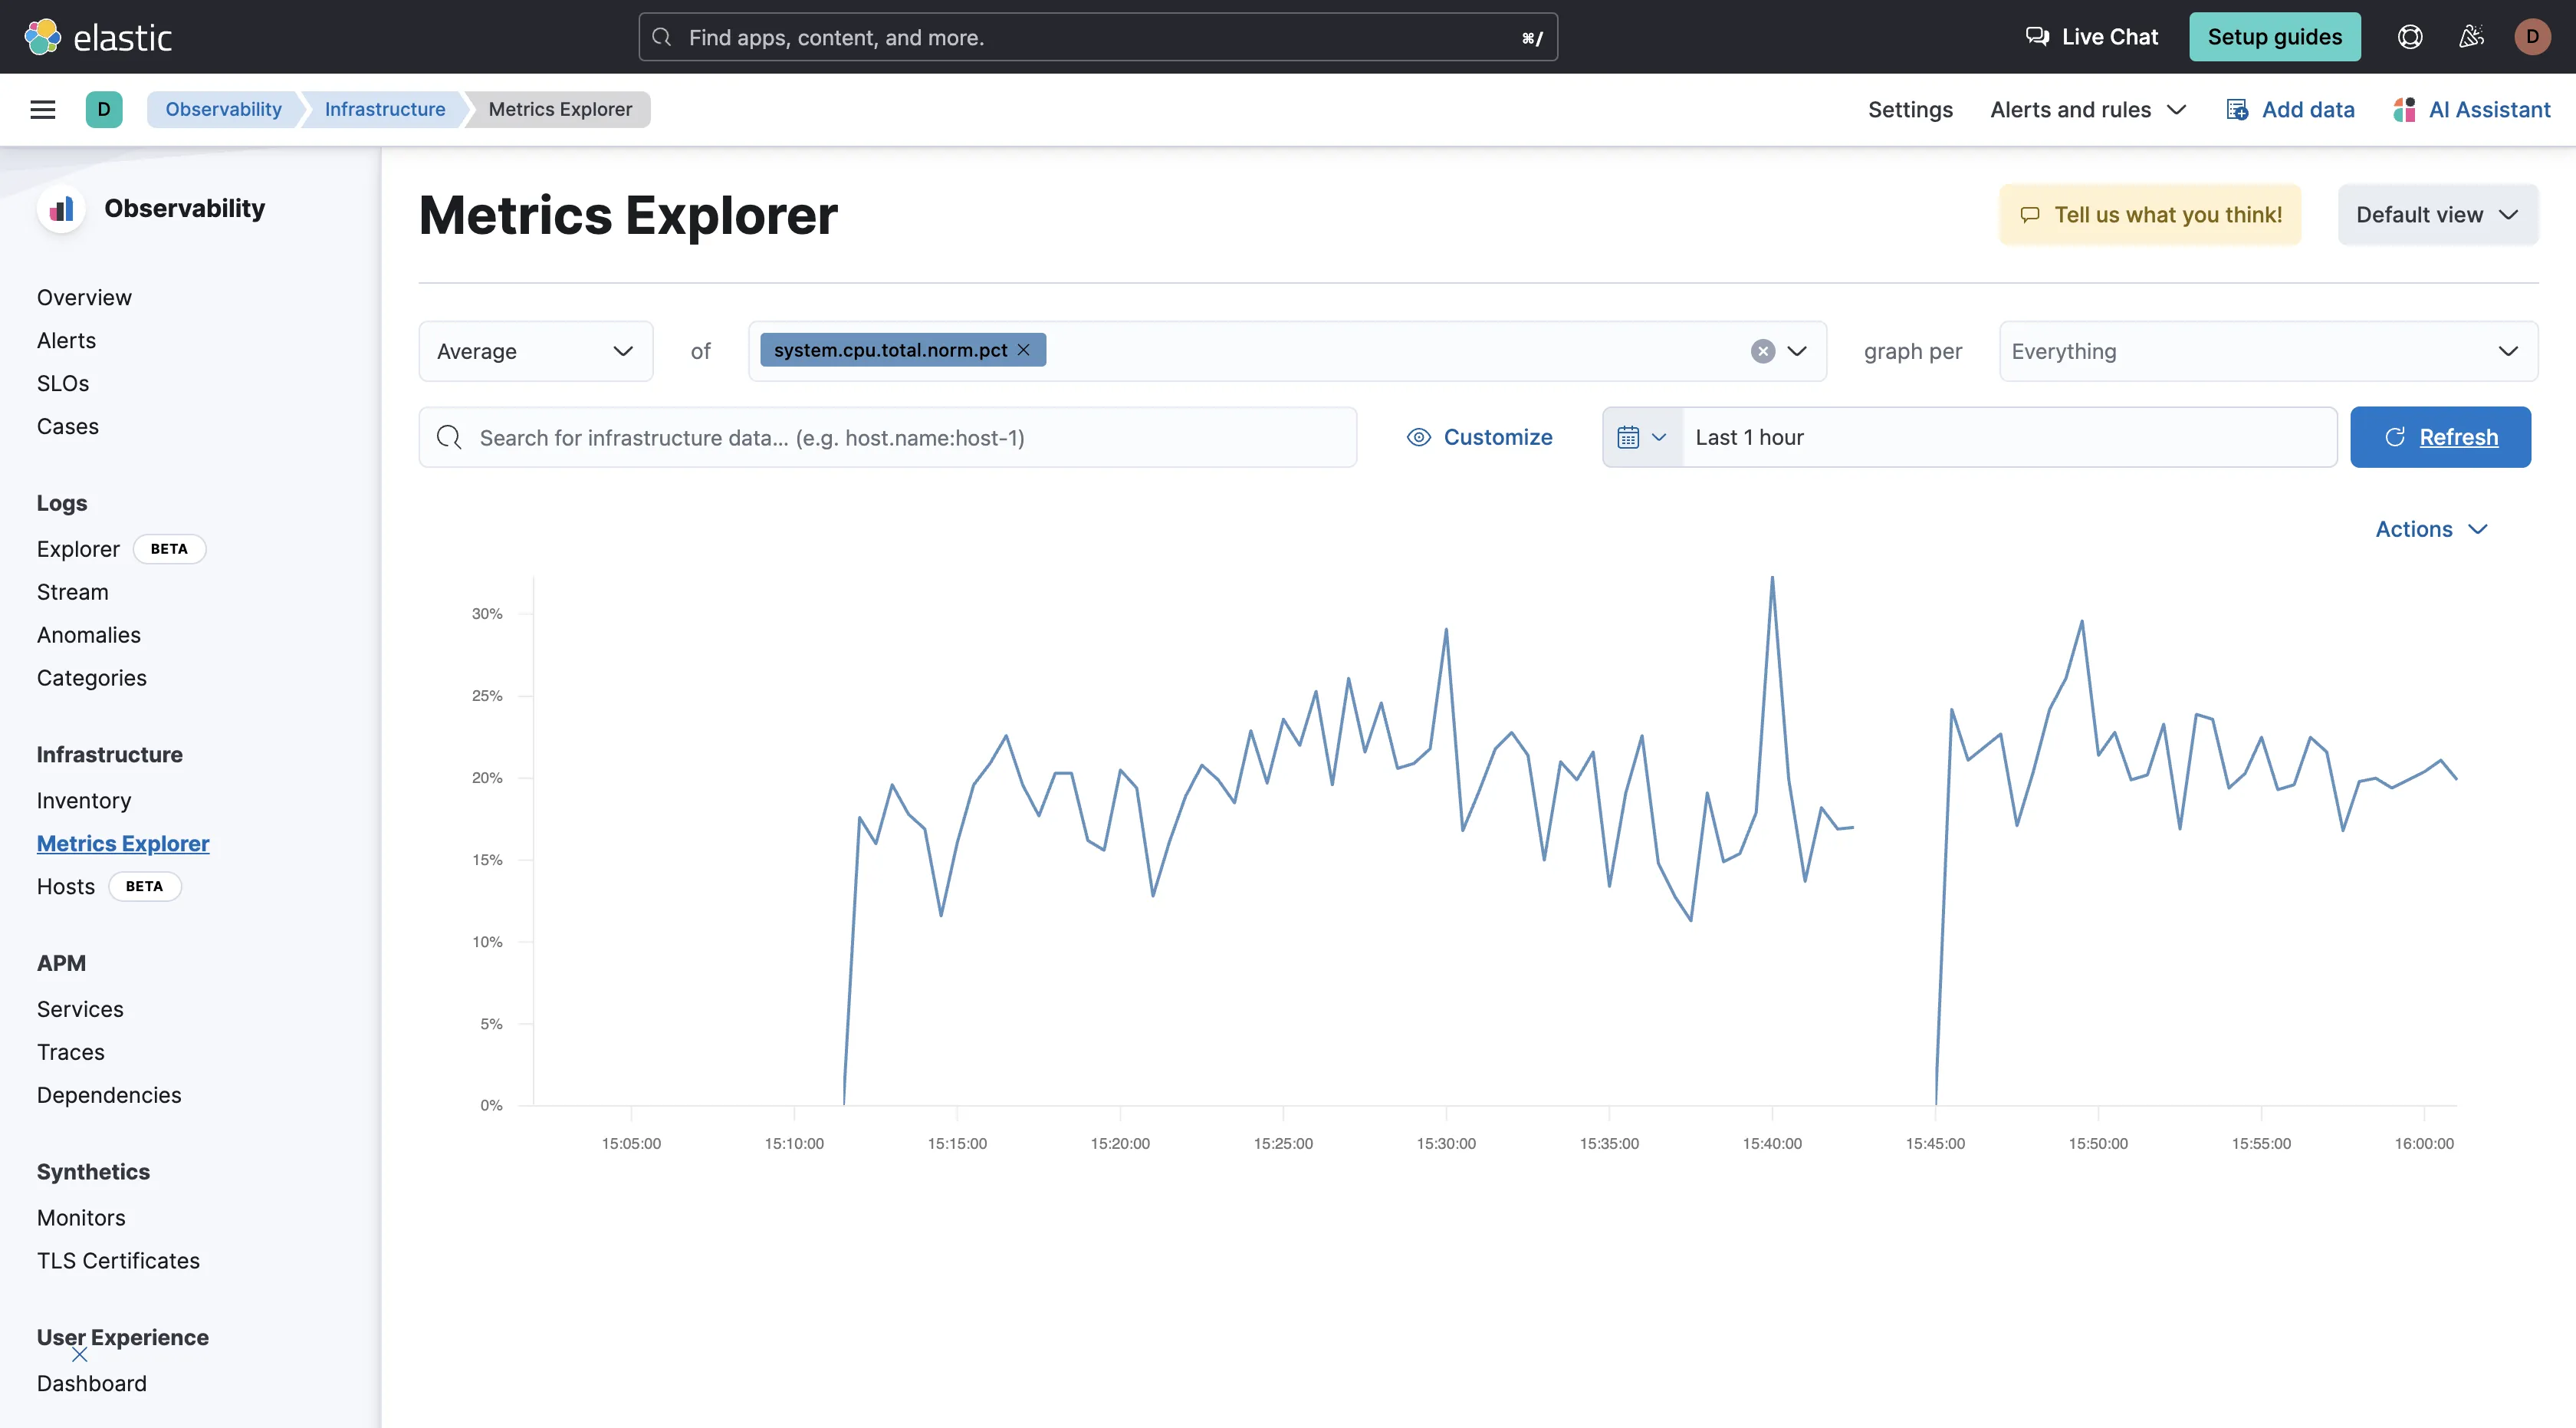
By default, the Metrics Explorer displays CPU usage metrics for these resources, offering a comprehensive overview of system performance. Users can customize the visualizations by selecting different metrics, such as system load metrics for hosts, and adjusting the aggregation method to suit their monitoring needs.
Datadog and Elastic Stack both perform well in monitoring host infrastructure performance.
APM: Datadog
Datadog
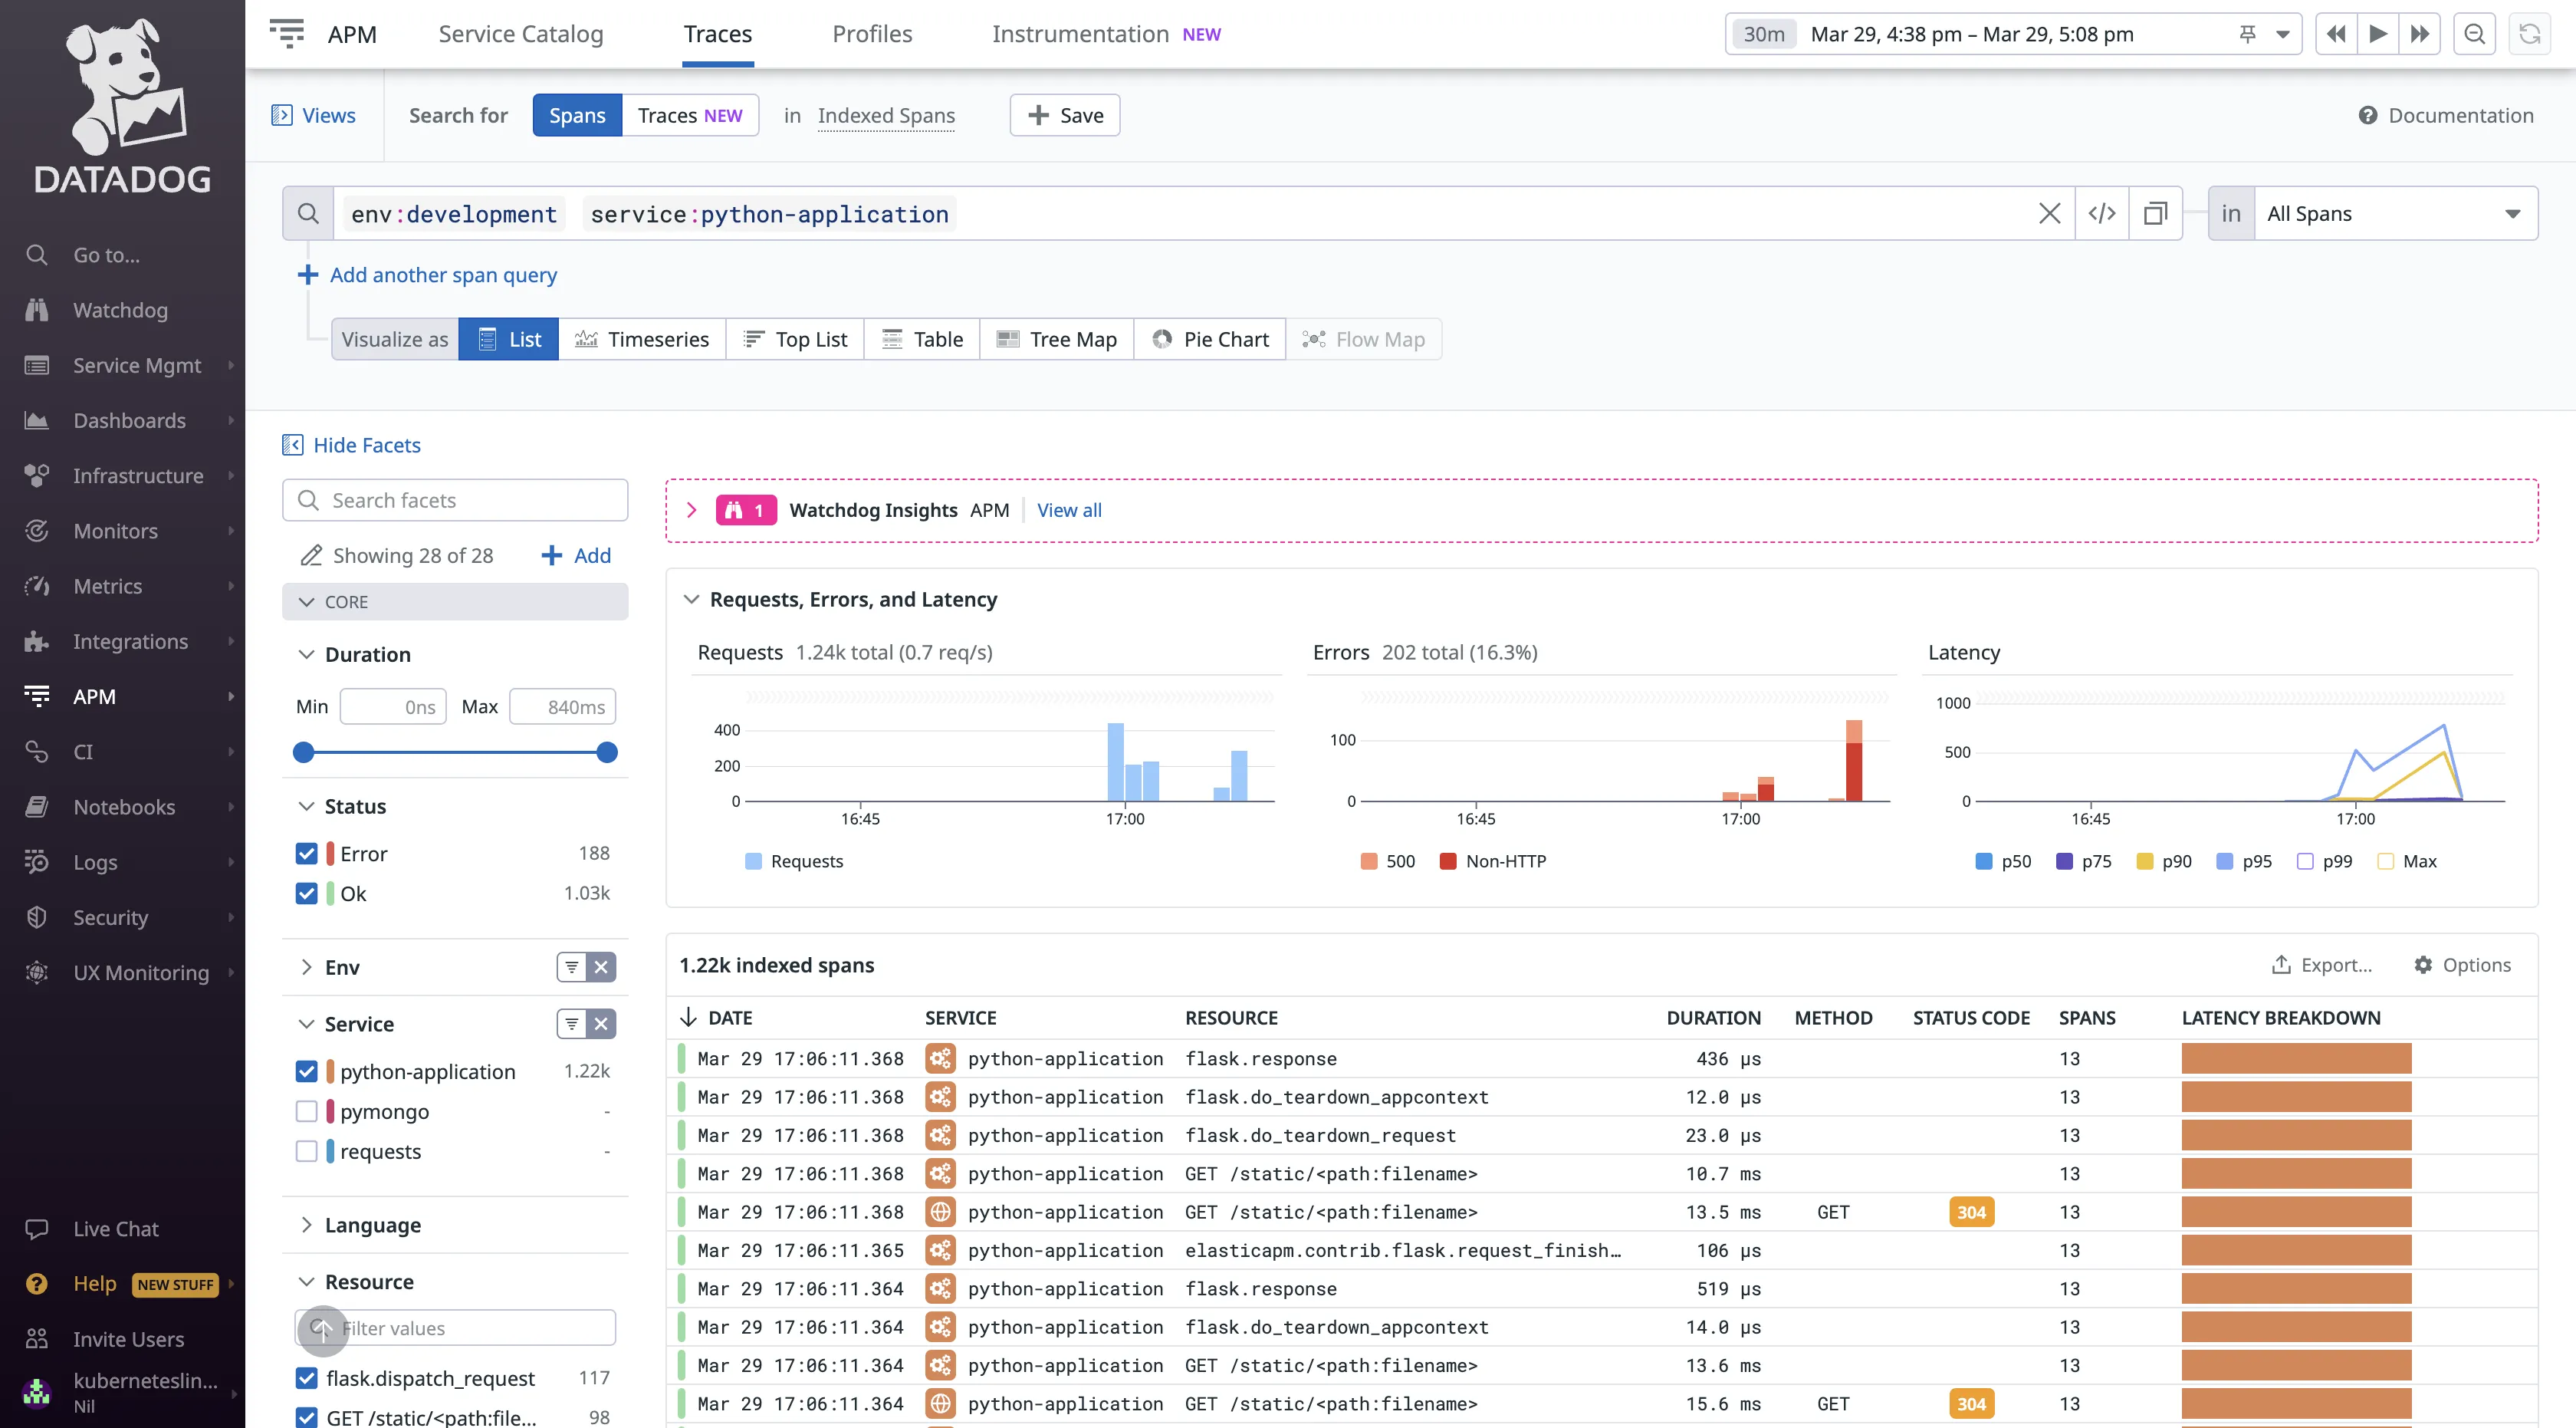
Datadog's APM provides end-to-end monitoring of applications in real-time. It helps identify bottlenecks and errors within applications. This is achieved through a feature known as "Tracing without Limits," which allows for real-time monitoring and analysis. It also allows for correlating traces with logs and metrics to provide a holistic view of application performance.
Datadog's APM also introduces filters for analyzing application performance without the need for a query language. Additionally, the continuous profiler feature for code-level tracing offers deep insights into the application's performance, enabling developers to pinpoint and resolve issues more efficiently.
Elastic Stack
The Elastic Stack’s APM is designed for monitoring software services and applications in real-time. It collects detailed performance information on various aspects of application performance, such as response time for incoming requests, database queries, cache calls, and external HTTP requests. This made it easy to pinpoint and fix the performance problems in my application quickly.
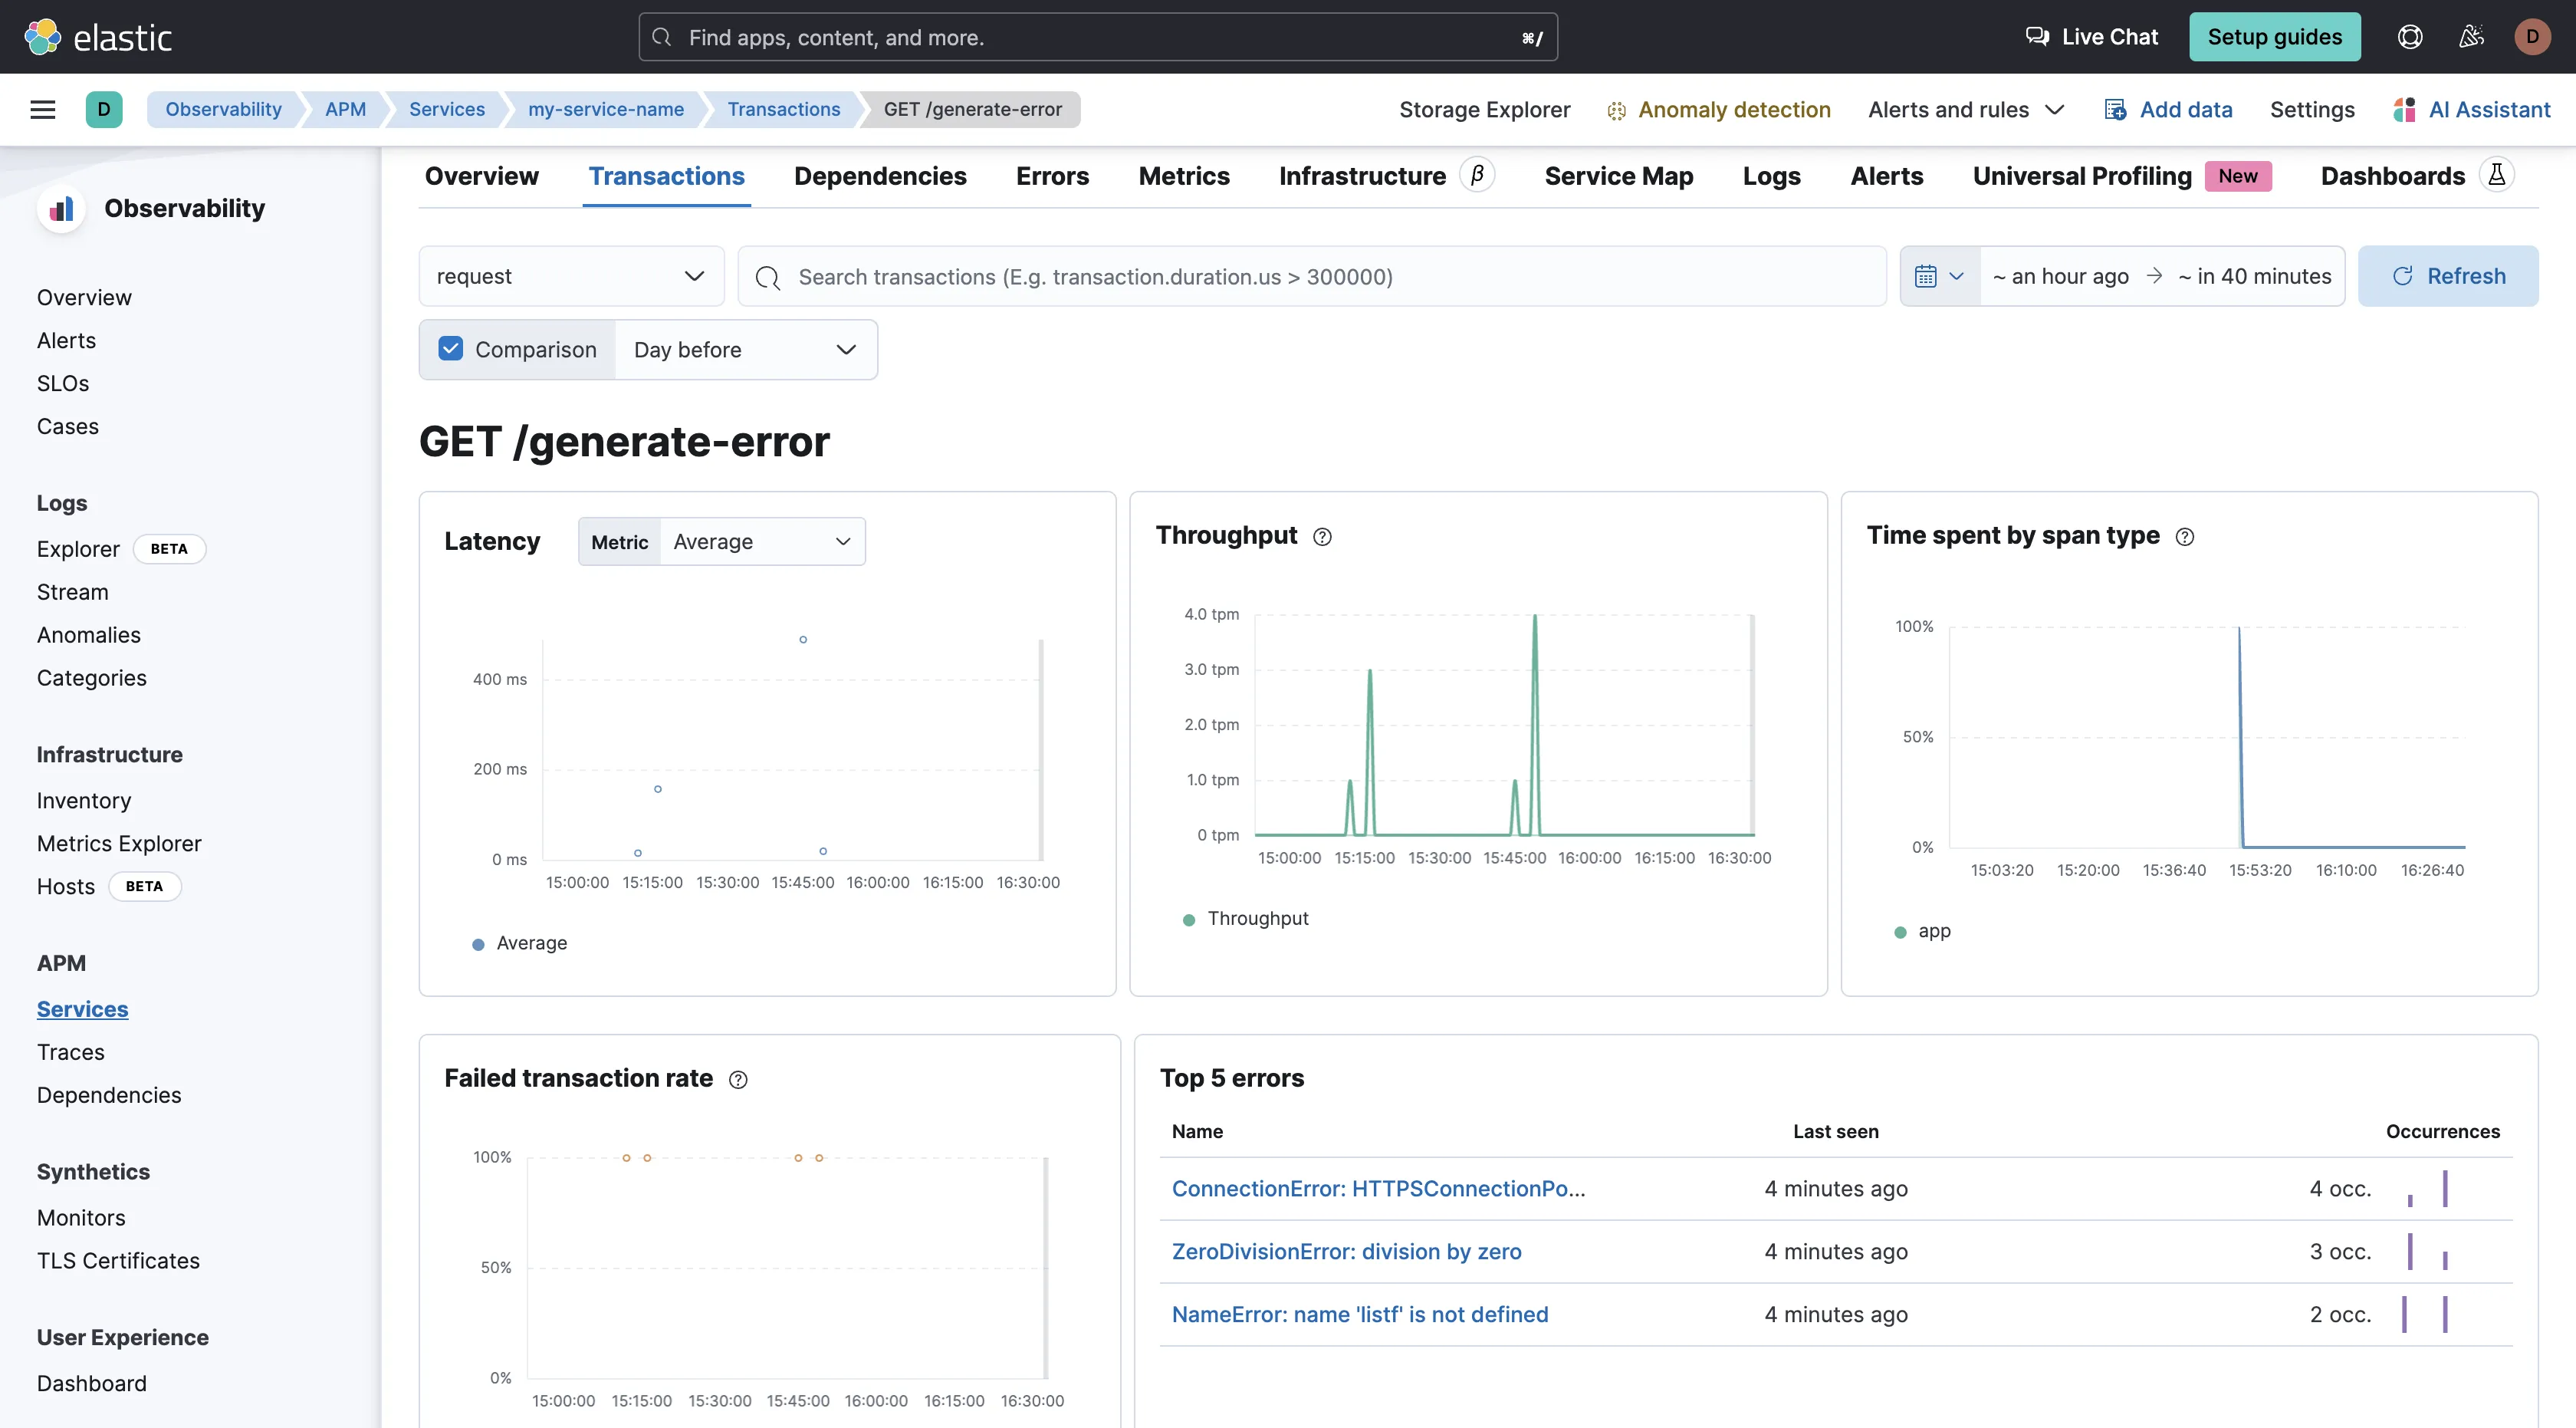
Datadog APM offers near-live visibility, comprehensive visibility, and real-time insights into application performance compared to the Elastic Stack.
Pricing: Elastic Stack
Datadog
Using Datadog can be costly due to its SKU pricing model. Monitoring expenses may not be predictable if you have data that changes over time. Additionally, Datadog imposes charges for extra monitoring features such as generating custom metrics (at $0.05 per custom metric) and activating error tracking (with additional fees based on event volume).
Datadog provides a 14-day free trial allowing users to thoroughly explore the platform's features without incurring any costs. Following the trial period, users are required to upgrade to a subscription plan to continue accessing the platform's services.
Elastic Stack
The pricing structure for the Elastic Stack varies depending on the deployment choice. For users opting for the open-source version, there are no direct costs associated. However, organizations leveraging the cloud-based version, Elastic Cloud, will incur fees based on their selected subscription plan and resource usage. It provides a 14-day free trial and monthly charges for the standard, gold, platinum, and enterprise plans.
Costs for using each should be determined by the number of services monitored and the specific features utilized, as well as factors such as data volume ingested and storage requirements. Overall, Elastic Stack is less expensive when compared to Datadog.
Choosing Between Datadog and Elastic Stack
The Elastic Stack (Elasticsearch and Kibana) added an AGPLv3 license option in 2024, reinforcing its open-source positioning, and Elastic has continued pushing into full observability beyond search and logs. Datadog remains a premium, fully managed SaaS suite. The core contrast is a self-hostable, search-rooted stack versus an all-in-one managed platform.
Here’s a use-case-based guide to help you:
- If you want full visibility into your application performance, choose Datadog.
- If you want to ingest and search through your log data, choose Elastic Stack.
- If your use case is log analysis, choose Elastic Stack.
- If you want more control, flexibility, and insights into your infrastructure, application, and services, choose Datadog.
SigNoz: A Better Alternative to Datadog and Elastic Stack
SigNoz is an open-source observability platform that provides a comprehensive suite of tools for monitoring, including metrics, traces, and logs, all within a single pane of glass. This unified approach simplifies the observability stack for developers and operators.
In terms of pricing, SigNoz stands out with its transparent and cost-effective open-source model. Unlike Datadog, which employs an SKU-based pricing model, and Elastic Stack's cloud-based subscription fees, SigNoz offers a straightforward pricing structure that eliminates the unpredictability often associated with other solutions. It also addresses the limitations of the Elastic Stack by offering a more efficient and scalable solution for handling high volumes of telemetry data.
Related comparisons: OpenTelemetry vs ELK and Datadog vs Splunk, plus the Datadog alternatives roundup. For more log-analytics comparisons, see Elasticsearch vs Splunk, Kibana vs Splunk, and OpenSearch vs Splunk.
Getting Started with SigNoz
SigNoz Cloud is the easiest way to run SigNoz. Sign up for a free account and get 30 days of unlimited access to all features.

You can also install and self-host SigNoz yourself since it is open-source. With 24,000+ GitHub stars, open-source SigNoz is loved by developers. Find the instructions to self-host SigNoz.
Frequently Asked Questions
Q: What are the main challenges in migrating from Elastic Stack to Datadog or vice versa?
A: Migrating between these platforms can be challenging due to differences in data formats, APIs, and the way they handle data ingestion and processing. Organizations may need to reconfigure their data pipelines, rewrite queries, and retrain their teams on the new platform. Additionally, the cost implications of switching platforms should be carefully considered, as pricing models can vary significantly between Datadog and Elastic Stack.
Q: How does Datadog handle scalability and performance for large-scale deployments?
A: Datadog is designed to scale automatically with the size of your infrastructure, ensuring that you can monitor and analyze data from thousands of servers, containers, and services without any performance degradation. It uses a distributed architecture to collect, process, and store data efficiently, allowing for high performance even in large-scale deployments.
Related Content
