Grafana vs Splunk - Key Features and Differences
Grafana and Splunk are both used as monitoring tools. But while Grafana is majorly used as a data visualization tool, Splunk is an enterprise security and observability platform. Monitoring tools are essential for any business that wants to have visibility into its IT infrastructure. They provide real-time data that can be used to identify and troubleshoot problems. Grafana and Splunk are two of the most popular monitoring tools on the market.
So, which one is better for your business? In this article, we’ll compare Grafana and Splunk side by side, looking at features, pricing, supported data sources, and more. Understanding these differences can help you choose the right tool for your data needs.
By the end, you should have a good idea of which tool is a better fit for your business.
Grafana vs Splunk: At a glance
| Splunk | Grafana | |
|---|---|---|
| Type | Proprietary, closed-source, commercial software | Open-source, free with a paid plan |
| Pricing | Splunk is a costly tool used by enterprises. | Free to use open-source, paid cloud option |
| Data Integration | Can collect data from different channels, including file-based, script-based, network-based, and API | Has a lot of data integration plugins, with ability to develop custom plugins |
| Data Querying | Uses Search Processing Language (SPL); Splunk SOAR | Supports multiple query languages like SQL and PromQL |
| UI/UX | Needs a bit of learning curve | Easy to use and understand |
| Community | Accessible customer support and training resources | Active open-source community, and paid support |
What is Grafana?
Grafana is a robust, open-source data visualization and monitoring tool that allows users to create interactive dashboards and charts. It is used to monitor and visualize data from a variety of data sources — including time series databases such as QuestDB or InfluxDB. Grafana's real-time data display capabilities have made it the choice among many people for monitoring systems and infrastructure.
What is Splunk?
Splunk is a log analysis platform that collects, indexes, and analyzes data from various sources, including messaging systems, databases, network devices, and more. It doesn't matter where your data is coming from; Splunk can normalize and extract fields from it automatically, which makes it a great tool for troubleshooting and identifying patterns in data.
Three key components in Splunk are its forwarder, indexer, and search head.
The forwarder pushes data to a remote indexer. The indexer manages all the indexing and search queries. The search head is the front-end web interface where these 3 components can be combined.
With Splunk, you can search and analyze large amounts of data in real-time, and it provides pre-built visualizations to help you quickly create informative dashboards.
Grafana vs Splunk: Key Differences
Data Collection & Integration
While Splunk and Grafana are both data collection and analysis tools, they have different features and approaches in regard to data collection & ingestion.
Splunk is a centralized log management tool that can collect and store large amounts of data from various sources. This data is stored in an index, where it can be analyzed using Splunk's powerful search language.
As per the official documents of Splunk, data collection depends on what type of data source a client is using. These are the methods that Splunk uses for data collection.
- Ingest service which collects JSON objects from
/eventsand/metricsendpoint of the ingest REST API. - Forwarder service, which collects data from the Splunk forwarder.
- DSP HTTP event collector which collects data from HTTP clients and Syslog data sources.
- DSP Collect connectors that collect data from several types of data sources such as Amazon S3, Amazon CloudWatch, Azure, etc. These collectors collect data through jobs that run on a schedule.
- Steaming connectors collect data from several data sources such as Apache Kafka, Apache Pulsar, Google Cloud Pub/Sub, etc. These types of connectors receive data continuously emitted by the sources.
Splunk also has over 600 apps providing reports, dashboards, and data knowledge available at Splunkbase.
Grafana, meanwhile, is an open-source platform for data visualization and monitoring. It focuses on providing graphical representations of metrics. It can connect to various data sources, including InfluxDB, Prometheus, Elasticsearch, etc., and retrieve data using SQL-like query language.
Unlike Splunk, Grafana is open-source, thus making integration with any data source possible both through the community-published plugins and by creating your own plugins.
Data Querying
In the previous step you’ve learned how the two tools integrate data, now its time to query and that data (and visualize).
Splunk
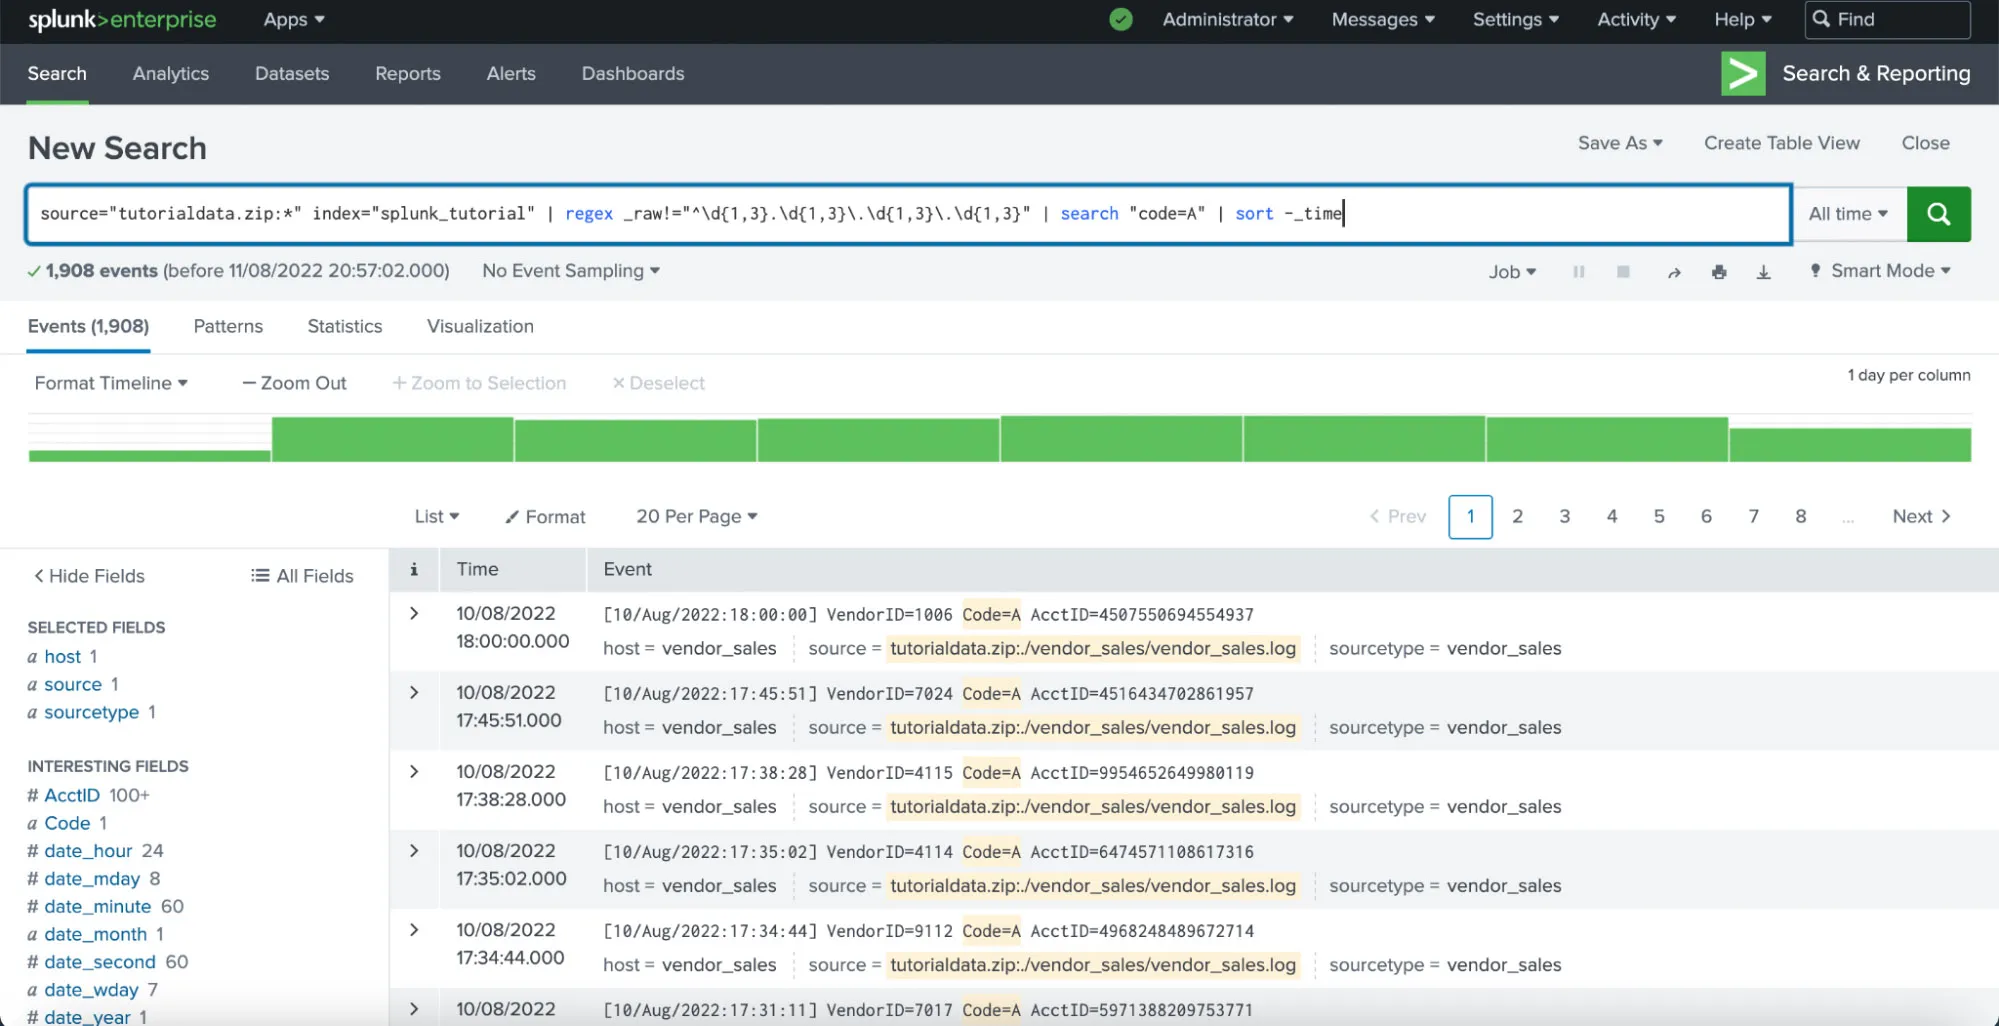
Splunk has dozen of ways for data querying. The simplest solutions is to use Splunk Search - a simple method for data query from the dashboard.
Splunk SOAR (Cloud) is a REST API for data query that allows deep query customization from the backend.
Splunk also uses its custom Splunk Search Processing Language (SPL) which is optimized for searching, analyzing, and visualizing large volumes of machine-generated data. SPL offers a rich set of commands for data manipulation, extraction, and analysis.
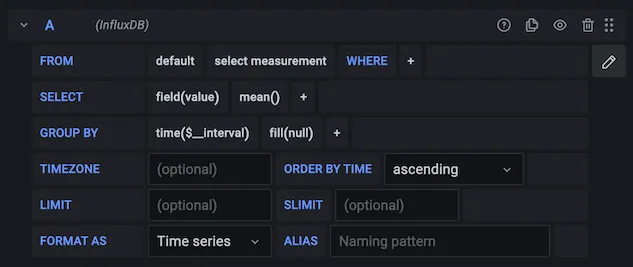
Grafana
Data source queries retrieve data that can be transformed and displayed in Grafana. Each data source utilizes its unique query language, and plugins for data sources incorporate a query editor to construct queries.
Take a deeper overivew about queries and data transformation in Grafana.
Data Visualisation & UI/UX
Both Grafana and Splunk offer a great set of visualization capabilities.
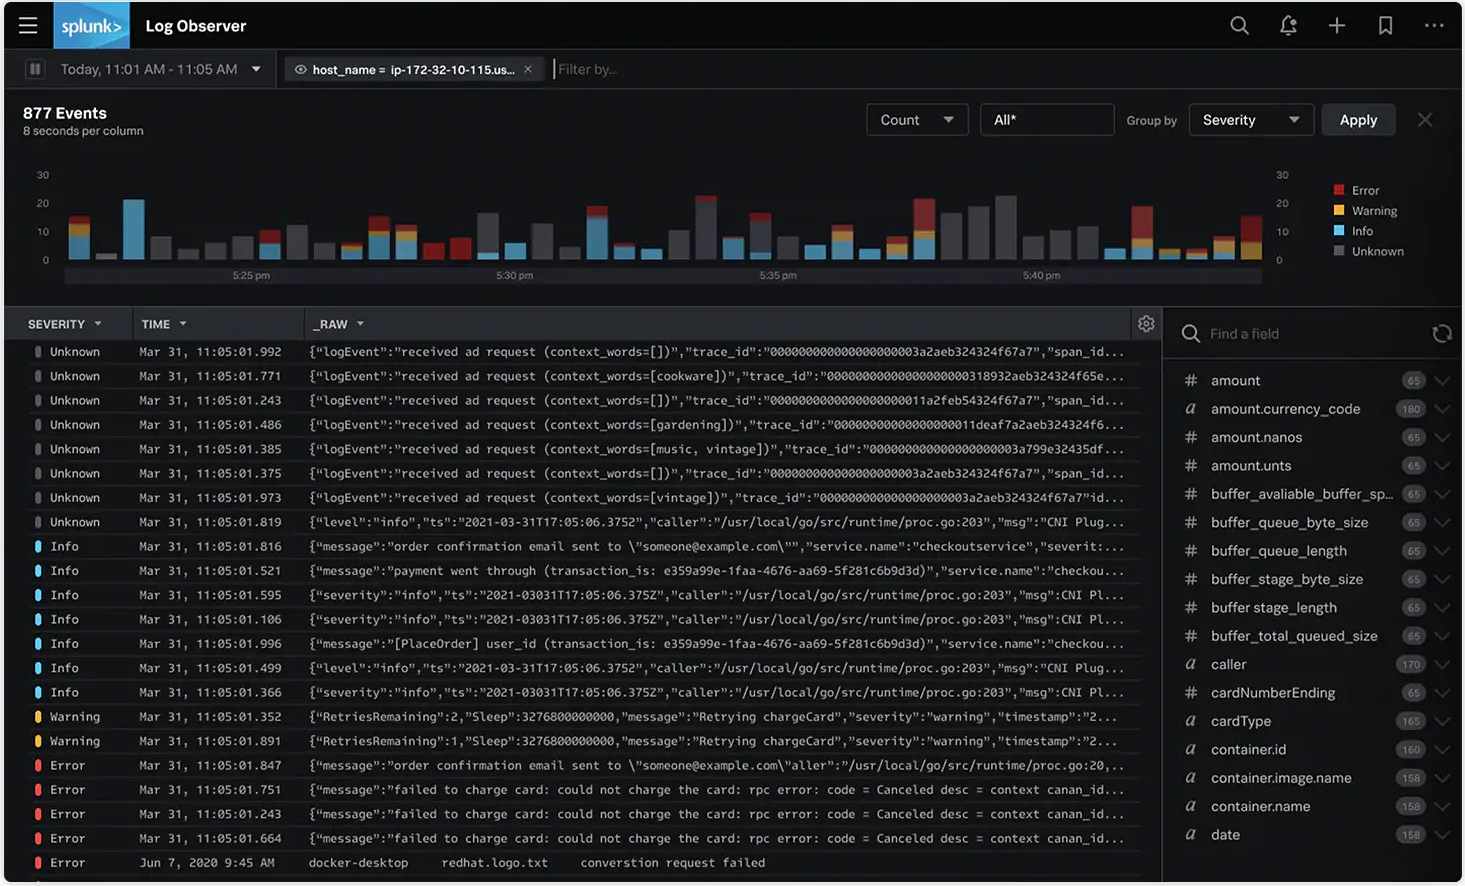
Splunk
In our research, Splunk's UI/UX experience has been excellent. Some parts of the UI, documentation and overall product do lack clarity and can be hard to navigate and read. But, Splunk's customizability is where it shines. Splunk provides a dashboard studio that lets you customize dashboards in Splunk with control over dashboard’s layout, images, colors, and more.
You can literally make anything in Splunk, change every single bit on a given dashboard to customize it to your customers' needs.
Grafana
As a multi-year Grafana user, I have really adopted the interface since my early adoption I've managed to work easily without many hiccups.
Grafana's UI is very simple, without many elements (though you can add many, many elements in the dashboard) that interfere with the mental/visual overload. The UI elements have enough clarity and intuitiveness.
In Grafana, you need to set up these dashboards and panels, which requires some bandwidth depending on which metrics you wish to visualize. You can build a powerful dashboard by selecting a data source and then combining panels associated with different data sources together.
Alerting and Notifications:
Splunk provides robust alerting capabilities, so alerts can be triggered based on conditions and thresholds. Alerts are sent through different channels, such as Slack, PagerDuty, ServiceNow, SMS, and email — and the built-in alert manager allows users to manage & track multiple sources of alerts in one place.
Grafana has a built-in alert manager for real-time monitoring and alerts. Alerts can be configured based on conditions and thresholds and can be sent through various notification channels such as email, Slack, etc. Grafana enables users to create alerting rules at a dashboard panel level, making it easy to set up and manage alerts for specific data sets.
Both Splunk and Grafana provide robust capabilities, but Splunk provides more advanced alert management and tracking, while Grafana provides more granular control over alerting rules at the panel level.
Pricing
Splunk
As an enterprise-oriented product, you need to schedule a sales meeting with a Splunk Pricing Expert to get an estimate. Scheduling a long sales meeting isn't very convenient, as such products tend to require a minimum amount of seats and bill annually, so depending on your use case Splunk may not be the best option.
What we do know without a sales meeting is how Splunk tiers its pricing:
-
Workload Pricing: This pricing plan makes it very economical to bring more data into Splunk that is less frequently searched.
-
Ingest Pricing: Pay based on the amount of data you bring into the Splunk Cloud Platform.
-
Entity Pricing: Controllable plan that is based on the number of hosts using Splunk observability products.
-
Activity-based pricing: Connect costs directly to activities being monitored by Splunk observability products like metric time series (MTS), traces analyzed per minute, sessions, or uptime requests.
Grafana
Grafana, on the other hand, has simpler pricing. It has a simpler model than Splunk's pricing model. Grafana has a decent "free forever" plan with the following key specs:
- all Grafana Cloud features
- 10k metrics billable series, 14 days retention
- 3 active users with Enterprise plugins
Like Splunk, Grafana also offers a (similar) pay-as-you-go plan starting free, then you just pay for the used resources. That's the simple part of Grafana's pricing, they also have detailed usage-based pricing.
Grafana vs Splunk: Features
Splunk and Grafana are both powerful tools used for monitoring, visualizing, and analyzing data. Here's a comparison of some key features of both platforms:
-
Data Sources
-
Grafana: Supports a wide range of data sources including databases (MySQL, PostgreSQL, etc.), cloud services (AWS CloudWatch, Google Stackdriver, etc.), and various monitoring systems (Prometheus, Graphite, etc.). It's highly extensible and supports plugins for additional data sources.
-
Splunk: Splunk is particularly well-known for its ability to ingest and analyze machine-generated data such as logs, metrics, and events. It supports a variety of data sources including log files, syslog, SNMP, APIs, and custom applications.
-
-
Visualization and Dashboards
-
Grafana: Offers a wide array of visualization options including graphs, charts, histograms, and gauges. You can create interactive dashboards by combining data from multiple sources. Grafana's dashboarding capabilities are highly customizable with support for templating and annotations.
-
Splunk: Splunk also provides robust visualization capabilities with a focus on real-time data exploration. It offers features like customizable dashboards, drill-down capabilities, and support for creating reports and alerts based on visualizations.
-
-
Querying and Search
-
Grafana: Grafana relies on data sources to handle querying, so the querying capabilities vary depending on the underlying data source. However, it provides a powerful query editor that supports syntax highlighting, auto-completion, and query history.
-
Splunk: Splunk has its own search processing language called SPL (Splunk Processing Language), which is optimized for searching, analyzing, and visualizing large volumes of machine-generated data. SPL offers a rich set of commands for data manipulation, extraction, and analysis.
-
-
Alerting
-
Grafana: Grafana provides alerting capabilities through its built-in alerting engine. You can set up alerts based on thresholds and conditions, and receive notifications via various channels such as email, Slack, and PagerDuty.
-
Splunk: Splunk also offers alerting functionalities allowing users to create alerts based on search results. It supports real-time alerts and can trigger actions like sending emails, running scripts, or executing other commands.
-
-
Community
-
Grafana: Grafana has a vibrant open-source community and a rich ecosystem of plugins and integrations. You can leverage community-developed plugins to extend Grafana's functionality.
-
Splunk: Splunk also has a strong community and a wide range of third-party apps and integrations available on Splunkbase, its app store.
-
In summary, both Grafana and Splunk are powerful platforms with distinct strengths and use cases. Grafana is well-suited for monitoring and visualization tasks, especially when integrating with various data sources, while Splunk excels in log management, real-time analysis, and operational intelligence. The choice between the two often depends on specific requirements, preferences, and existing infrastructure.
Pros and Cons
Splunk Pros:
- Data Safety: Splunk keeps multiple copies of indexed data providing better data safety in case of technical failures.
- Advanced Features: Splunk provides advanced analytics and can be used to process large data sets.
- Security: Since Splunk is commercial software, the security features, including data encryption, authentication, and access control, are very robust compared to what Grafana offers.
Splunk Cons:
- Expensive: Splunk is commercial enterprise-grade software, and it can be expensive for many organizations to implement.
- Steep learning curve: Although Splunk is a powerful tool, the learning curve for it can be very steep, and new users struggle with it.
Grafana Pros:
- Open Source: Grafana is open source project, which means it can be used
- GNU Licensing: Organizations don't need any type of license to run Grafana which makes it a cost-effective monitoring option.
- Engagement: Grafana has an active community of users and developers who talk about their experiences and help each other.
Grafana Cons:
- Limited Storage: Grafana on other hand has limited data storage capacity which can be a major issue for organizations that have large data sets.
Both of these monitoring solutions have different approaches when it comes to scalability:
-
Splunk is built on top of distributed architecture which means it can process large amounts of data and index it on different nodes making it highly scalable.
-
In terms of storage, Splunk is built in a way that it can easily handle petabytes of data which can also scale horizontally by adding more nodes to the cluster.
-
Grafana, on the other hand, is built on plug-in architecture which allows it to integrate with different types of data sources and its functionality can be extended by using plugins.
-
The plug-in architecture in Grafana can be scaled by adding more servers.
In general, Splunk is comparatively more scalable than Grafana especially when it comes to organizations that have large amounts of data. --> */}
Choosing between Grafana and Splunk
If you are looking for a comprehensive platform that can help you ingest, analyze, and visualize diverse types of data and logs, then Splunk would be a great choice. Splunk is a top-notch log aggregator that can collect and index data from various sources. It offers advanced search and filter capabilities, making it easy to search and analyze data of any format or source. Its powerful search engine enables advanced data processing and analytics while providing robust security and alert management features.
Splunk is suitable for businesses facing complex data analysis needs, businesses that require complex data analysis, especially large enterprises that deal with extensive log volumes and require robust security and alert management features.
However, it's worth noting that Splunk's extensive features come with substantial maintenance costs and licensing expenses. Implementing Splunk for large-scale log ingestion requires a high level of expertise and resources. The pricing model is based on the volume of indexed data, which means that strategic planning is necessary to prevent incurring unnecessary expenses.
If you prioritize comprehensive monitoring and actionable insights from your applications and services, Grafana is an excellent choice. It boasts superior data visualization capabilities and real-time monitoring features, positioning it as a leading option for effectively tracking key performance indicators (KPIs).
Grafana excels at managing time-series data, which is data collected over time. It organizes raw numerical data points sequentially and presents them through various visual elements that are both informative and easy to understand. Its visualizations span numerous panel types and dashboards, enabling a dynamic and interactive approach to monitoring KPIs in real-time.
In addition, Grafana is recognized for being a robust, open-source solution that is not only cost-effective but also user-friendly and straightforward to deploy. It offers a range of deployment options to suit different needs and environments. However, note that Grafana lacks data storage capabilities, and it doesn't offer as many features or provide the same level of security when compared to Splunk.
In summary, choose Splunk if you need a versatile platform for comprehensive data analysis and management, and Grafana if you require dynamic visualization and monitoring of time-series data.
SigNoz - an alternative to Grafana and Splunk
SigNoz is an open source APM that provides metrics, logs, and traces under a single pane of glass. It uses OpenTelemetry for application instrumentation. OpenTelemetry is quietly becoming the world standard for instrumenting cloud-native applications. SigNoz can be a great alternative to Grafana and Splunk.
It is available both as an open-source software and a cloud offering.

Getting Started with SigNoz
SigNoz Cloud is the easiest way to run SigNoz. Sign up for a free account and get 30 days of unlimited access to all features.

You can also install and self-host SigNoz yourself since it is open-source. With 24,000+ GitHub stars, open-source SigNoz is loved by developers. Find the instructions to self-host SigNoz.
Grafana vs Splunk: FAQ
Q: Is Slunk open-source?
A: Unlike Grafana, Splunk is not open-source.
Q: What are the key differences between Splunk and Grafana?
A: Splunk is a comprehensive data platform offering log management, real-time analytics, and machine learning capabilities, while Grafana is primarily a visualization and dashboarding tool focused on monitoring metrics and time-series data.
Q: Which tool is more suitable for large-scale enterprise deployments?
A: Splunk is often preferred for enterprise deployments due to its robust data management features, scalability, and support for complex data analysis needs. Grafana, while powerful for visualization, may require additional integration for enterprise-grade data management.
Q: How do pricing models compare between Splunk and Grafana?
A: Splunk typically follows a per-gigabyte pricing model based on data ingestion volume, Grafana, on the other hand, is open-source with optional paid enterprise features and support, making it more cost-effective for some use-cases.
Q: Which tool offers better integration with other systems and data sources?
A: Splunk has extensive integrations with a wide range of systems and data sources out-of-the-box, along with a robust ecosystem of apps and add-ons. Grafana also supports various integrations but may require additional plugins or customization for specific data sources.
Q: What level of expertise is required to use Splunk versus Grafana?
A: Splunk typically requires specialized knowledge to set up and administer due to its complexity and range of features. Grafana, with its user-friendly interface and simpler setup process, may be more accessible to users with varying levels of technical expertise.
Q: Which tool is better suited for real-time monitoring and alerting?
A: Splunk is renowned for its real-time monitoring capabilities, including advanced alerting features based on complex queries and thresholds. While Grafana supports alerting, it may not offer the same level of sophistication out-of-the-box as Splunk.
Q: Can Grafana be used alongside Splunk?
A: Yes, many organizations use Grafana alongside Splunk to leverage Grafana's superior visualization capabilities while still benefiting from Splunk's powerful data management and analytics features. Integrations can pull data from Splunk into Grafana for visualization and analysis.
Related Posts
