DataDog is a paid SaaS tool that provides a range of products for monitoring applications and tech infrastructure. While Grafana is an open-source web visualization tool that can be used with a variety of data sources to create dashboards.
If you're looking for a one-stop observability solution and price is not a concern for you, choose Datadog. In case you're looking to visualize data from a lot of different data sources especially time-series data, then choose Grafana.
If you're in looking for an all-encompassing observability solution and are not constrained by budget, Datadog is the ideal choice. Conversely, if your priority is to visualize data from a multitude of different sources, particularly time-series data, then Grafana is your go-to option. Grafana will be more cost-effective than Datadog but it will not provide the range of features Datadog provides for monitoring software systems.
Grafana is primarily used to visualize your time-series database data into meaningful charts from which you can draw insights. Grafana can be used to build an open-source stack for APM, time-series, and logs monitoring, but you will need to consider the effort and cost of maintaining a self-hosted stack.
In this post, we will compare DataDog with Grafana based on the following categories:
- Getting Started
- Monitoring use-cases
- User Experience
- Pricing
We will also explore the key features of DataDog and Grafana.
Comparing DataDog and Grafana
The disadvantage of DataDog is that it does not specialize in any one domain. And the good thing about Grafana is that it can be combined with specialized tools for monitoring your application.
The disadvantage of using Grafana is the cost and bandwidth required to maintain it. GrafanaLabs, the company behind Grafana, also offers a cloud version that aims to provide a fully managed observability stack.
Some of the key differences between DataDog and Grafana:
Getting started
You need to sign up for a DataDog account and then install DataDog agents on your host. The DataDog agent can be installed on many platforms either directly or as a containerized version. The agent reports events and metrics from the host.For getting started with Grafana, you first need to install it. Check out the different operating systems and requirements for installation. Once Grafana is installed you can connect it to your desired data source and start visualizing the data.
Some of the popular data sources that Grafana supports are:
- Prometheus
- Jaeger
- Zipkin
- AWS CloudWatch
- Graphite
- Azure Monitor
Monitoring use-cases
DataDog has an extensive list of monitoring services it offers. List of all monitoring products that DataDog provides:- Log Management
- APM
- Security Monitoring
- Infrastructure Monitoring
- Network Monitoring Grafana can be combined with popular tools for monitoring use-cases:
- ElasticSearch(for logs)
- Prometheus(for metrics)
- Jaeger(for traces)
User Experience
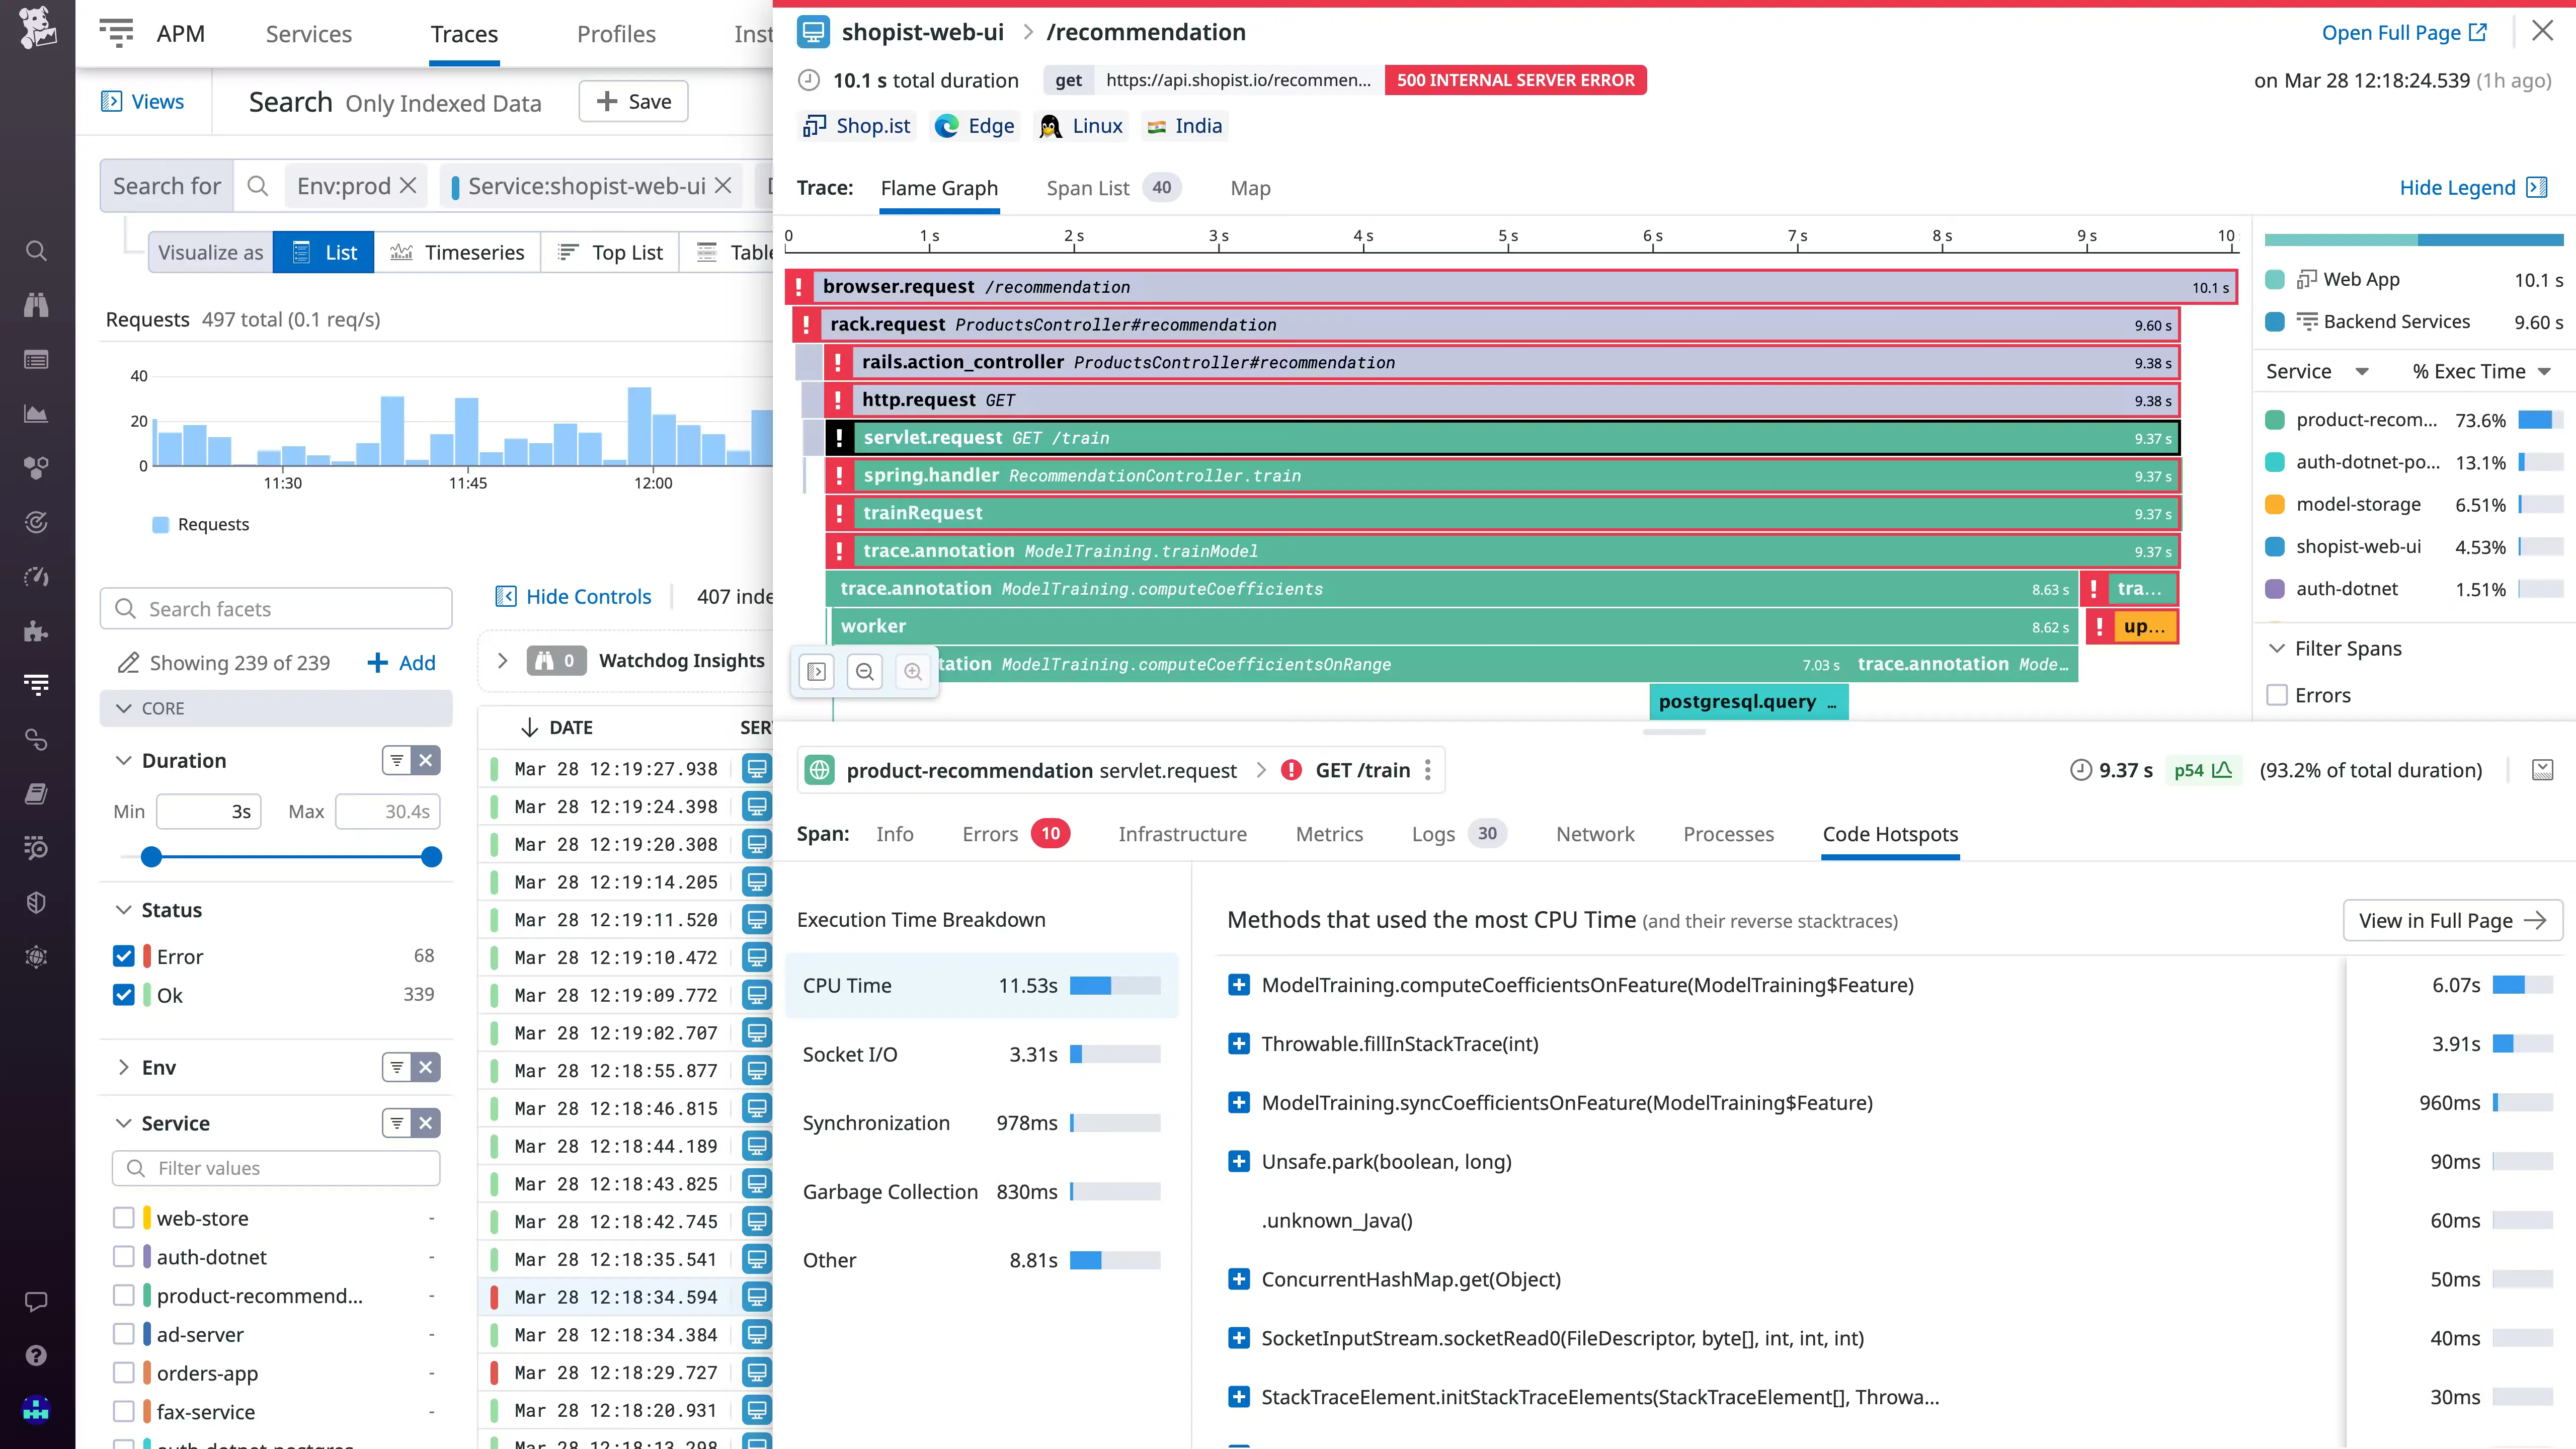
With DataDog, everything comes out of the box. Based on the plan you purchase, DataDog provides in-built dashboards and widgets to take care of popular use-cases of monitoring.
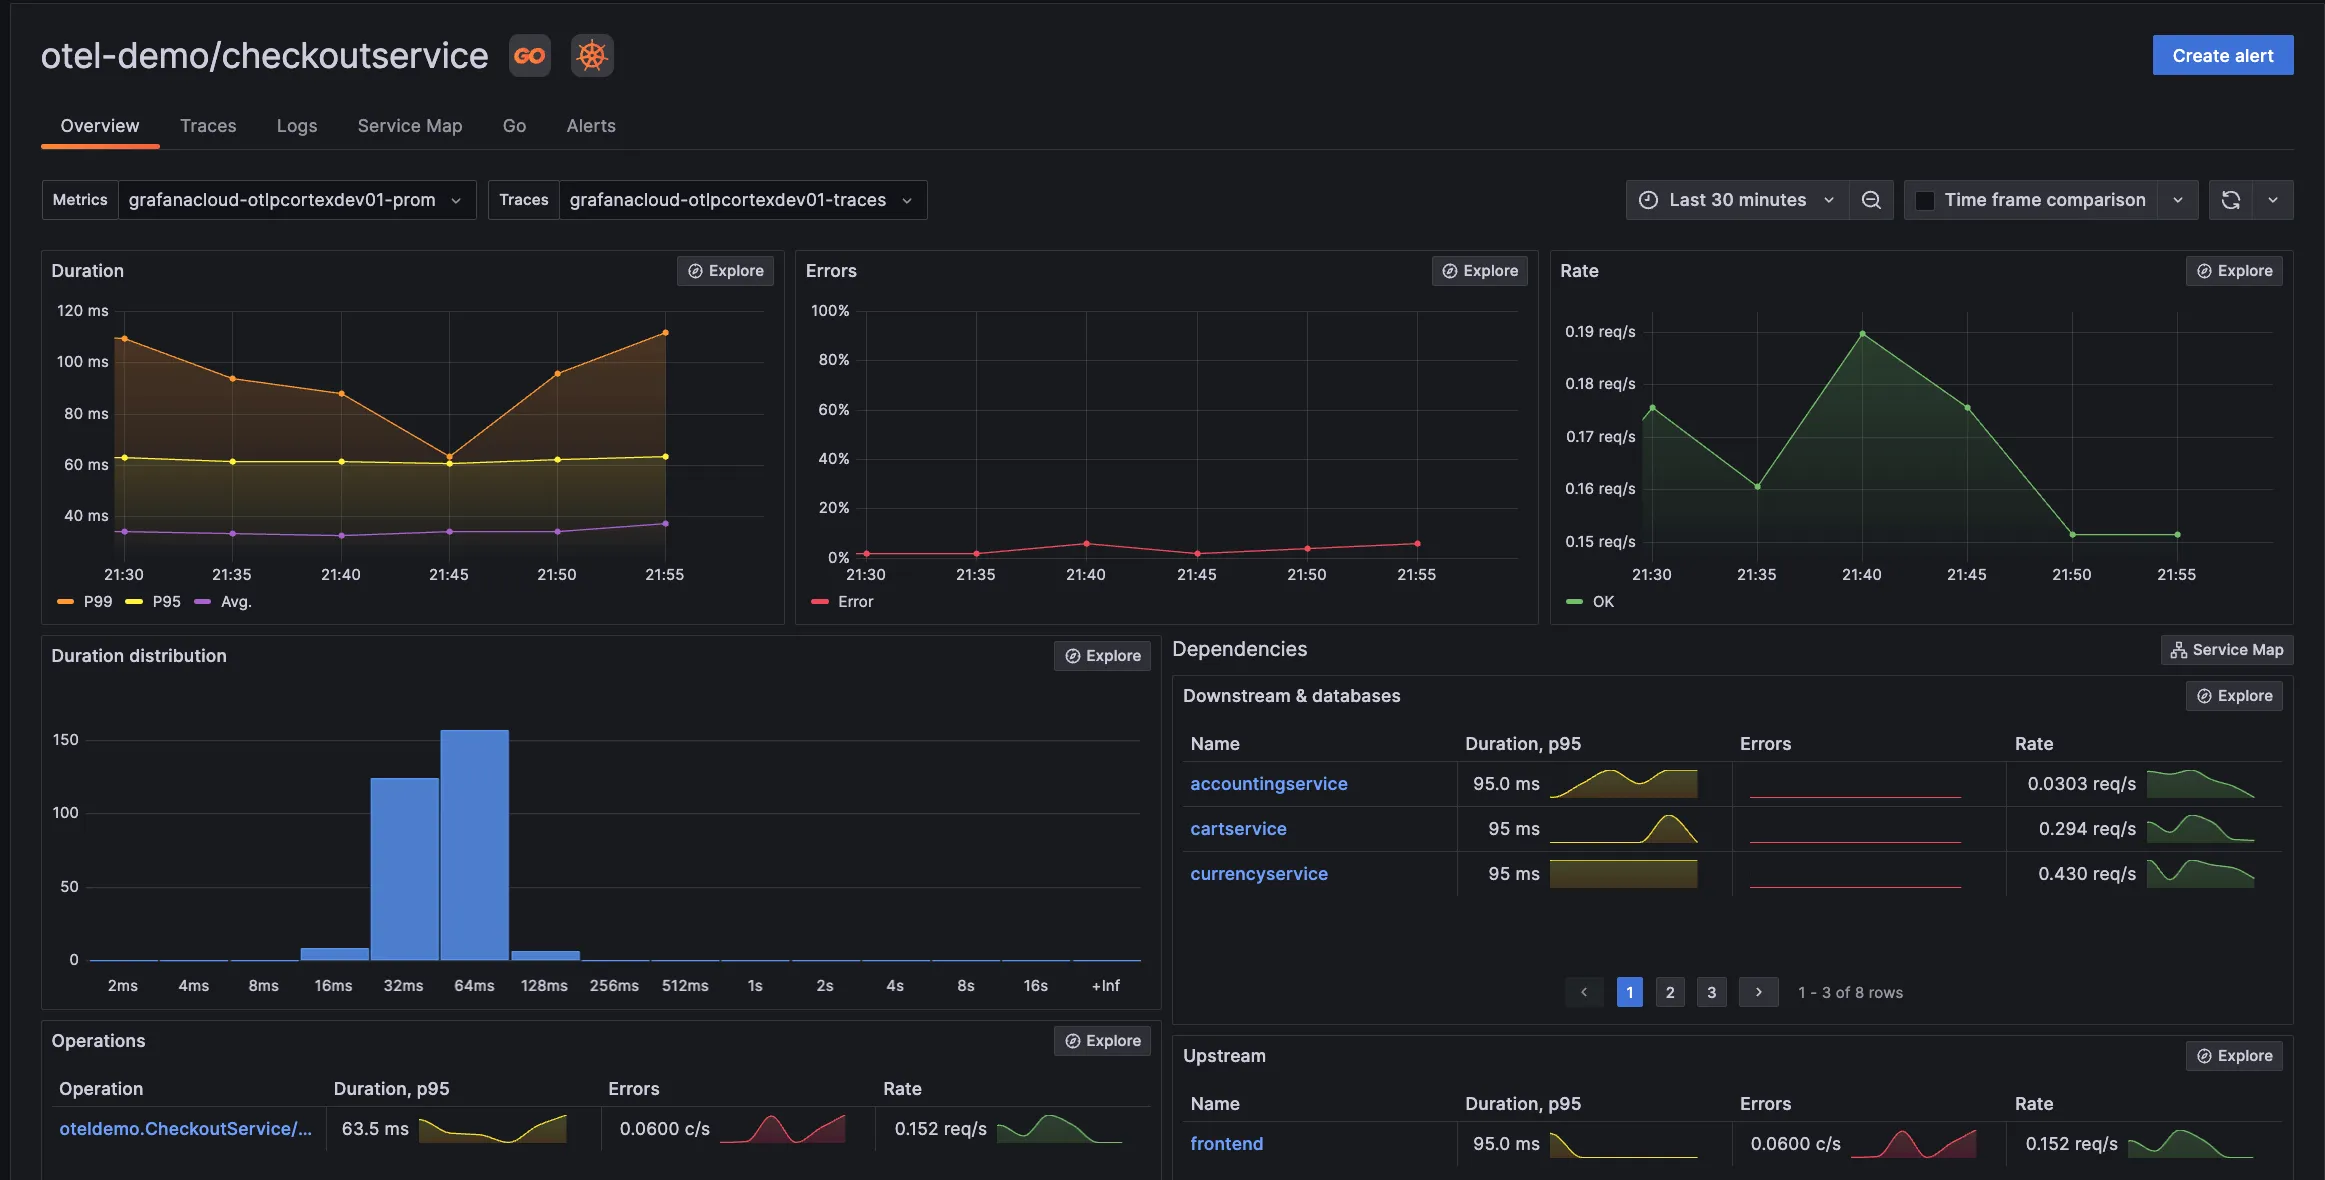
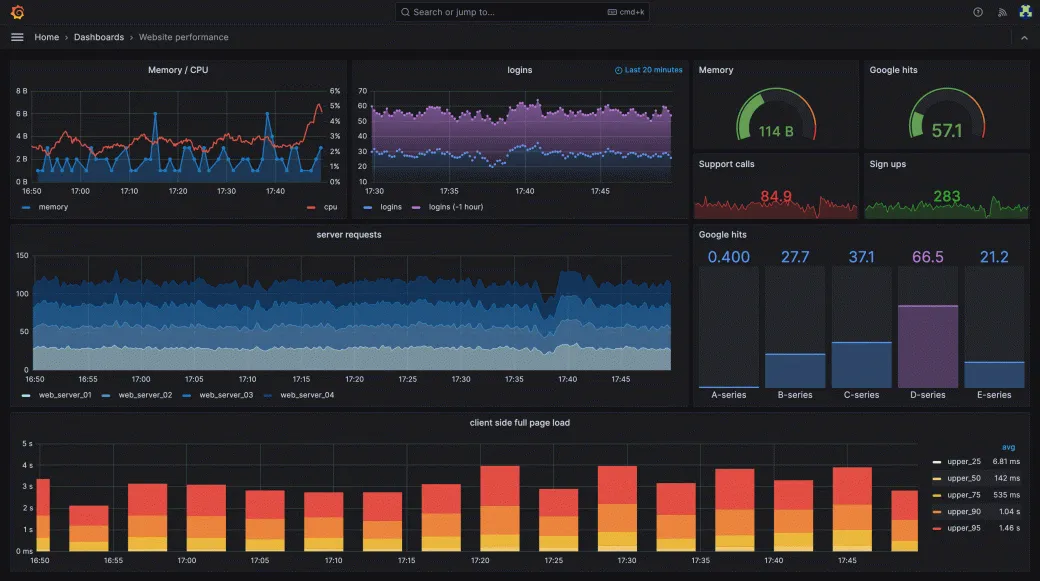
Datadog APM (source: Datadog website) Grafana is a popular open-source analytics and visualization tool. But you need to set up these dashboards and panels which requires some bandwidth. You can build a powerful dashboard by selecting a data source and then combining panels associated with different data sources.

Grafana dashboard (Source: Grafana website) Another great point to consider is that you can build an open-source monitoring stack using Grafana and other open-source specialized tools meant for monitoring like Prometheus. You can host this stack within your infra, which takes care of data privacy concerns.
DataDog is a third-party SaaS vendor and your data will be sent to DataDog cloud for analyses and visualization.
Pricing
The ease of use and the varied use-cases that DataDog provides are not cheap. DataDog is an expensive enterprise monitoring tool that has many different pricing tiers which vary on your use-cases. For example, infrastructure enterprise monitoring starts at $23 per host per month while its APM sand continuous profiler starts at $40 per host per month.The open-source version of Grafana comes for free, although you do need to account for the cost of data storage and networking. Grafana labs offers paid Grafana cloud services which has different pricing tiers and prices vary based on what type of data you're sending.
Key Features of DataDog
DataDog is an enterprise SaaS tool that offers an array of services in the monitoring domain. Some of the key features of the DataDog monitoring platform includes:
Log Management
DataDog offers scalable log ingestion and analytics through its log management product. You can search, filter, and analyze log data through its dashboard. You can route all your logs from one central control panel.Application performance monitoring
DataDog's APM tool provides end-to-end distributed tracing from frontend devices to databases. You can connect the collected traces to infrastructure metrics, network calls, and live processes.Security monitoring
Using DataDog security monitoring, you can analyze operational and security logs in real-time. It provides built-in threshold and anomaly detection rules to detect threats quickly.Network monitoring
With DataDog network monitoring, you can analyze traffic as it flows across applications, containers, availability zones, and on-premise servers. You can track key network metrics like TCP retransmits, latency, and connection churn.Real user monitoring
With DataDog's real user Monitoring, you can have end-to-end visibility into user journeys for web and mobile applications.
Key Features of Grafana
Grafana is an open-source dashboard tool. The biggest feature of Grafana is that you can use it to combine different data sources and then visualize data in a central dashboard. It also comes with admin features for effective collaboration with the team.
Some of the key features of Grafana are:
Flexible dashboards
Grafana provides a lot of panels that can be used for building dashboards. To build dashboards that suit your needs, you can choose from multiple chart types like heatmaps, histograms, pie charts, etc.
You can build many types of dashboards in Grafana (Source: Grafana website) Plugins
Grafana provides an extensive set of plugins to extend Grafana capabilities. Some of the plugins that Grafana offers are:- Data Source plugins
- App plugins
- Panel Plugins
Alerting system
Grafana provides a central UI to set and manage alerts with a central UI.
A better alternative to DataDog and Grafana - SigNoz
SigNoz is a full-stack open-source observability tool that can better replace DataDog or Grafana. It provides logs, metrics, and traces under a single pane of glass.
Some of the key features of SigNoz are:
- Out-of-the-box charts for application metrics like p90, p99, latency, error rates, request rates, etc.
- Distributed tracing to get end-to-end visibility of your services
- Monitor any metrics important to you, build dashboards for specific use-cases
- Logs Management equipped with a powerful search and filter query builder
- Exceptions monitoring to track exceptions in your application
- Easy to set alerts with DIY query builder
You can compare SigNoz with DataDog and Grafana. SigNoz Cloud is the easiest way to run SigNoz. You can get started for free.
You can also self-host SigNoz as it is open source.
Getting started with SigNoz
SigNoz cloud is the easiest way to run SigNoz. Sign up for a free account and get 30 days of unlimited access to all features.
You can also install and self-host SigNoz yourself since it is open-source. With 20,000+ GitHub stars, open-source SigNoz is loved by developers. Find the instructions to self-host SigNoz.
Related Content
SigNoz vs Grafana
SigNoz vs Datadog
Cut Your Observability Spend by 80%—Here’s How
Discover how SigNoz offers a seamless migration path from Datadog with comparable features and up to 80% cost savings.

