Deep dive into observability of Messaging Queues with OpenTelemetry
Introduction
Over the past few years in the observability and monitoring space, we've received numerous complaints from users about the lack of detailed monitoring for messaging queues, particularly Kafka. With the introduction of instrumentation standards like OpenTelemetry, we realized there must be a better solution to this problem.
We delved deeper into the problem, seeking to understand how to improve the process of identifying and resolving issues in messaging systems, making it much easier for users.
The following sections focus on Kafka as a representative messaging queue to illustrate some common problems and potential solutions. Though Kafka is a more generic distributed event store, we are using it as a representative abstraction for a messaging queue, which is a common way in which it is used.
We would love to hear if these problem statements resonate with the community and welcome any feedback on how this can be more useful to you. We have also shared some wireframes of proposed solutions to concretize our current thought process. We appreciate any feedback on which flows and starting points would be most useful to you.
One of our key objectives is to leverage distributed tracing. Most current monitoring solutions for Kafka show metrics about Kafka, but metrics are often aggregated and don’t give much details on exactly where things are going wrong. Traces on the other hand show you the exact path a message takes, offering much more detailed information. Our focus is on how we can use this trace information to resolve issues more quickly and effectively.
Background
In the modern distributed architecture, Infrastructure monitoring has become crucial, there are many components which contribute to system stability. In this blog post, we will see how end-to-end observability of Messaging queues can be achieved using OpenTelemetry and the problems it can solve to ensure the stability and scalability of Distributed Asynchronous Architectures.
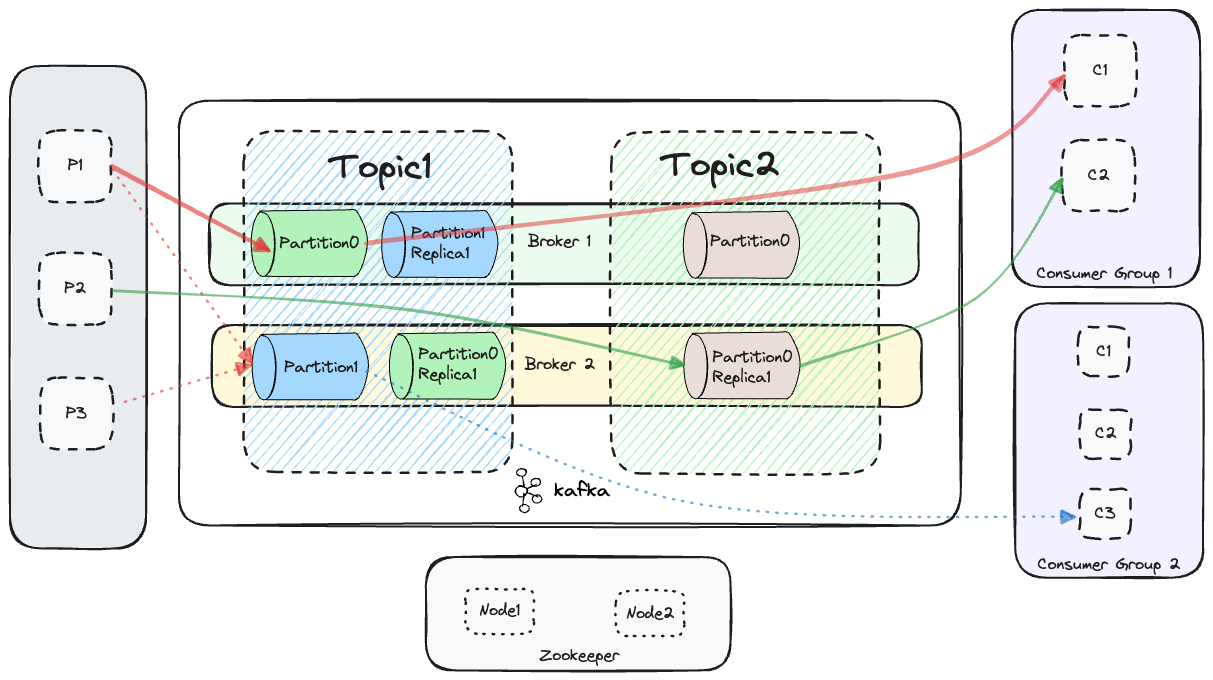
Fig. 1: Request flow through Kafka
Today there are solutions which can help with visualising out of the box JMX metrics from a messaging queue like Kafka, but it’s still hard to see what’s happening in a single trace and how kafka components are affecting every request. We will see what can be done to improve the reliability and performance by using client side instrumentation of async systems using OpenTelemetry.
To better understand the problem let’s take a look at a single request that’s flowing through a Messaging queue, we will take an example of Kafka throughout the blog, and the same logic is applicable to all the other messaging queues like RabbitMQ, Amazon SQS etc.

Messaging semconv is standardising on the semantics that are being used by OpenTelemetry for all the messaging queues to make an interoperable layer of observability on top of any messaging queue.
In Fig. 1 We have multiple producers publishing to different topics of kafka, 2 consumer groups, Topic1 have 2 partitions with replication factor as 2, and Topic2 has 1 partition with replication factor as 2.
For a given request that flows through Topic1 to a certain partition (can be defined or undefined on the client side), we want to see how the system performs, and what deep insights we can have from correlating traces that propagate via Kafka with the corresponding metrics.
Some challenges that can be solved include:
- Deep visibility into the cause of Consumer Lag
- Factors affecting produce to consume latency
- Deep insights into Kafka at every time down to every request
- Insights into maintaining, scaling and capacity planning of brokers of Kafka
For this, we assume that the Kakfa producers and consumers use OpenTelemetry client libraries for context propagation. If you’re new to OpenTelemetry or want to follow along with an example, you can follow the github guide which will help you configure the above kafka setup along with producer and consumer applications in Java, which are automatically instrumented with Opentelemetry Java Agent. You’d be able to see metrics and traces in the SigNoz UI.
Fig 2 below describes the setup from the guide. We use JMX receiver, Kafkametrics receiver from OpenTelemetry and also traces data sent in OTLP format.
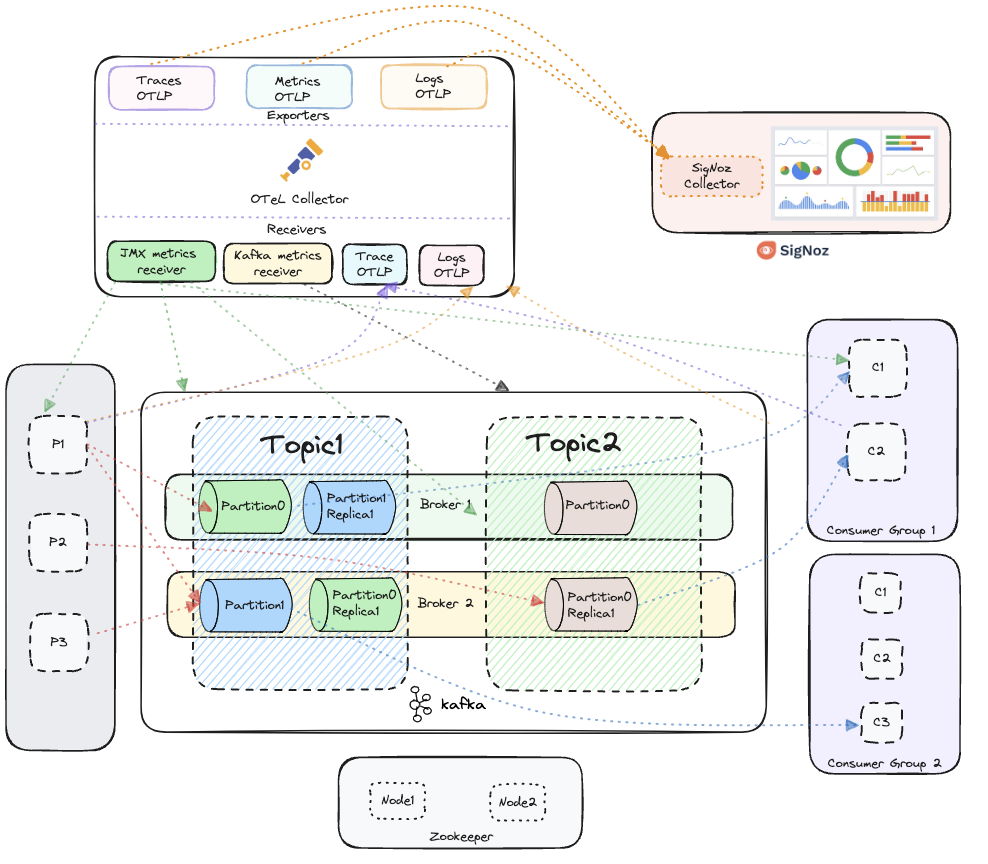
Fig. 2: Kafka setup with 2 topics, multiple producers and 2 consumer groups
Tracing the complete path - Producers → Kafka → Consumers
To trace the complete path of a message from producer to consumer, you need to instrument both the producer and consumer. In the below example, we have instrumented both the producer and consumer application with OpenTelemetry.
As you can see, both kafka-producer and kafka-consumer are shown in the trace and you can infer the time it spent in Kafka by the difference between the two. You also have interesting attributes like messaging.destination which shows the exact topic to which the consumers are reading from and producers are writing to.
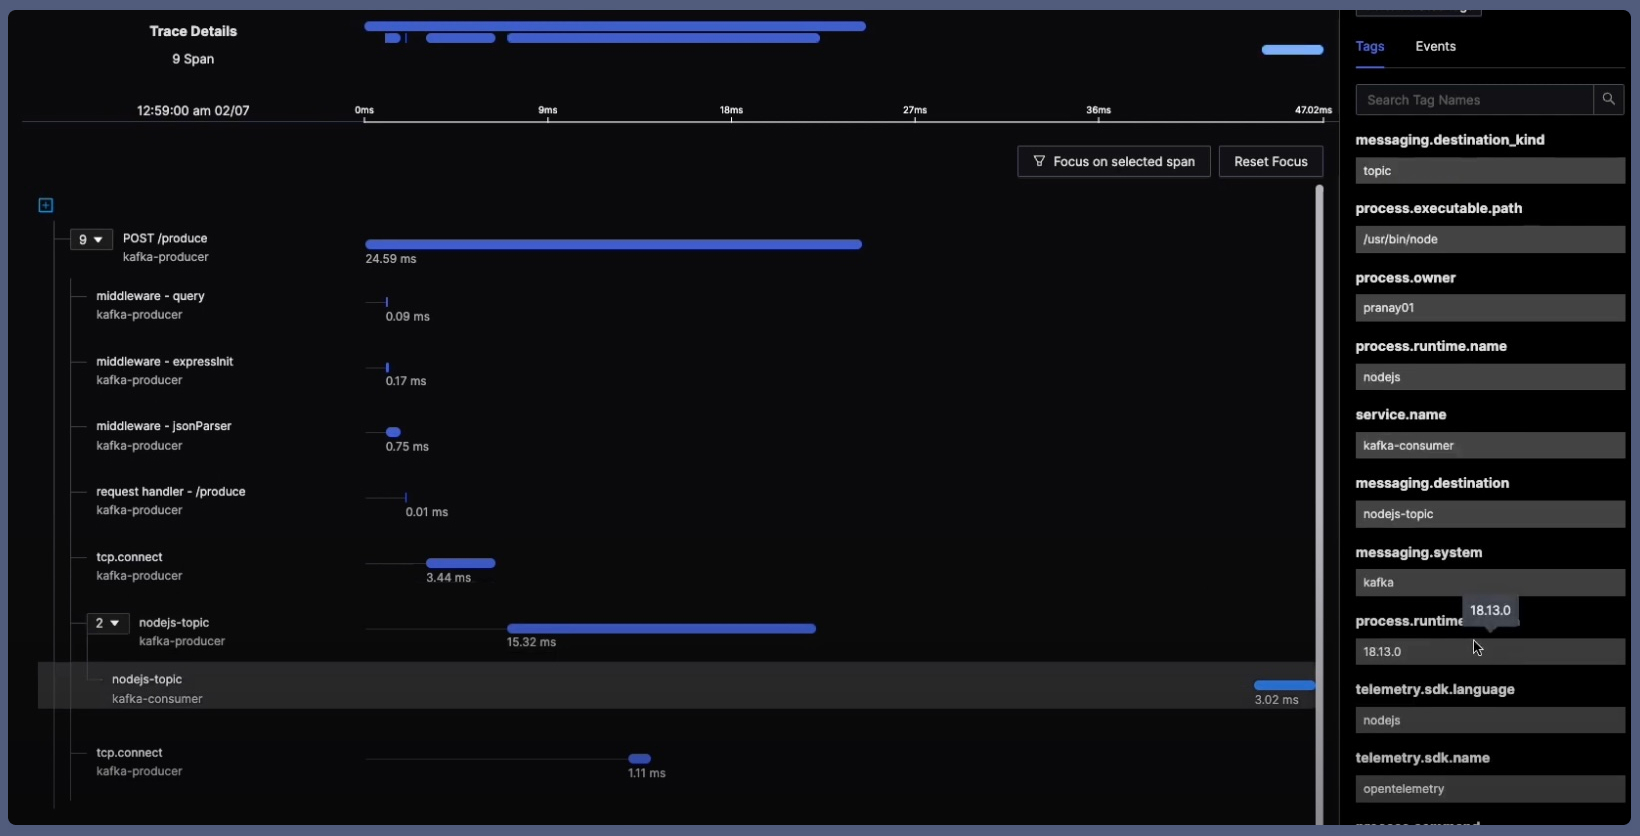
Fig. 3: Tracing the message path from Producers to Consumers
If we look at the attributes collected from Producer and Consumer spans, we can identify some attributes that can help us correlate with metrics for a given time period.
You can follow along in kafka opentelemetry instrumentation GitHub repo to implement the above example.
// Some important attributes from producer span

Attributes:
-> messaging.kafka.message.offset: Int(4)
-> messaging.kafka.message.key: Str(MY_KEY)
-> messaging.system: Str(kafka)
-> [messaging.destination.partition.id](http://messaging.destination.partition.id/): Str(0)
-> [messaging.destination.name](http://messaging.destination.name/): Str(topic1)
-> messaging.operation: Str(publish)
-> messaging.client_id: Str(producer-1)

// Some important attributed from consumer span

Attributes:
-> messaging.kafka.message.offset: Int(4)
-> messaging.kafka.consumer.group: Str(my-consumer-group)
-> messaging.kafka.message.key: Str(MY_KEY)
-> messaging.system: Str(kafka)
-> [messaging.destination.partition.id](http://messaging.destination.partition.id/): Str(0)
-> [messaging.destination.name](http://messaging.destination.name/): Str(topic1)
-> messaging.operation: Str(process)
-> messaging.client_id: Str(consumer-my-consumer-group-1)
-> messaging.message.body.size: Int(10)
Fig. 4: Key attributes available in Producer and Consumer spans instrumented with OpenTelemetry
You check out our detailed video tutorial on how to set up complete client-side monitoring of Kafka
Common debugging scenarios in Kafka
Here are the most common debugging scenarios most users face and some proposals on how these can be addressed. Our general approach has been to create workflows which can highlight common causes of these underlying scenarios.
Scenario 1 : Kafka partition wise end-to-end latency is high and you want to understand why it’s happening
Approach
Possible reasons for an increase in partition latencies are:
-
Partition is getting resource-constrained potentially with high usage of memory or CPU
-
Consumers are slow and are not processing messages fast enough. This can be because of 2 reasons a. Consumers are getting slow (either they call some other services like DBs internally and they are having issues or some other reasons) b. Consumers have high number of errors
-
Producers are sending a high volume of data
Fig 5: Kafka Partition latency troubleshooting
In the above proposal, users can find Topic and Partition wise latency and throughput metrics. As shown in Fig. 4, the producer and consumer spans have topic and partition as attributes and we will leverage this to show the above details.
If a particular latency/ throughput looks problematic, users can dive deeper into the issue by clicking on action links to see:
- Partition Host Metrics
- Consumer Group details
- Producer details
The key parameters we show are:
-
Partition host metrics - The user can find CPU usage, memory usage and other details about the machine in which the partition resides. This can help him judge if the partition is performing poorly because of any issues with the machine.
-
Consumer Group issues - The other source of issues can be consumers getting slow. These will be reflected in RED metrics of the consumer services, and users can dive deeper into traces of any service that they find having high latency to understand the exact traces that are causing the issue. This could surface issues like the consumer calling a DB internally and getting blocked. Or if a third-party API being called by the consumer is getting slow. This could also happen if a consumer is stuck in a retry or got blocked in processing due to a weird/heavy message.
-
Producer Throughput - Producer throughput tab can help users understand if there is an increase in message throughput from producers. If this is unexpected, it can be good area to investigate further if why the producer service is getting too chatty.
We are able to provide details as shown in the wireframe as we can track a message across the kafka partitions. You can exactly check, which messages are causing the increase in latency and if needed drill down to relevant consumer and producer traces to find the issue.
Compared to metrics, this doesn’t aggregate over all messages going to different consumer groups and partitions. You can drill down if messages going through a particular partition and a particular consumer group has an issue.
Scenario 2 : Kafka consumer lag is high and you want to understand why
Approach: Possible reasons for an increase in consumer lag are:
- Slow consumers: Slow consumers that take a long time to process messages can cause consumer lag.
- Message size: Large message sizes can cause consumer lag, especially if the consumer is not configured to handle large messages.
- Partitions getting resource-constrained with high memory or CPU usage.
- High message throughput: High message throughput can overwhelm consumers, causing consumer lag.
- Network latency: High network latency between the Kafka cluster and the consumer can cause consumer lag.
In this proposal, a user can see consumer lag graphs for for different Consumer Group - Partition ordered by average consumer lag.
If she wants to find more details about a particular point ( which corresponds to a specific consumer group and partition), she can find more details about it in a side panel.
Fig 6: Consumer Lag troubleshooting and possible causes
Question: Are consumer group and partition the right keys here to plot the chart, or should we start with showing services facing high consumer lag?
They key parameters we show are:
- Partition host metrics - The user can find CPU usage, memory usage and other details about the machine in which the partition resides. This can help him judge if the partition is performing poorly because of any issues with the machine.
- Consumer Group issues - The other source of issues can be consumers getting slow. These will be reflected in RED metrics of the consumer services, and users can dive deeper into traces of any service that they find slow to understand the exact traces that are causing the issue. Either an internal DB call or a third-party API call could also be a culprit here.
The other source could be the message size getting bigger and the consumer not being able to handle it. Average message size information, which we can get from the traces, can help users find if this is a potential issue.
-
Producer Throughput - Producer throughput tab can help users understand if there is an increase in message throughput from producers. If this is unexpected, it can be good area to investigate further if why the producer service is getting too chatty.
-
Network Latency - Consumers can also face issues in getting messages from Kafka because of network issues. Understanding fetch latencies for each of the consumer instances in the selected consumer group could be a good way to find if this is an issue.
Question: Is breaking down a consumer group into corresponding consumer instances more useful or are consumer services a better grouping parameter?
Scenario 3: Producer and Consumer RED Overview metrics with correlation to traces
This use case is designed to cater scenarios where platform owners want to get an overview of all the producers and consumers which are writing to Kafka and their performance.
Fig 7: Producer and Consumer Overview
Approach
In this proposal, we plan to have two tabs listing producer and consumer services grouped by topics. A user would be able to see details about producer and consumer services, and on clicking a particular Topic & Service group, they can see a side panel that will show more detailed RED (Rate, Error, Duration) metrics for each partition.
Since, all of these are powered by traces, users can dive deeper into partitions where p99 latency or error rates are high. By clicking on the latency/error rate values, they will be taken to detailed trace list pages showing the spans with high latency or errors. Users can then further investigate the traces to hypothesize the underlying issues.
Scenario 4: Messages not consumed within a specified time
Another issue we have observed users facing is around the dropping of messages from producer to consumer services. More explicitly - the messages were not consumed within an accepted time interval by the consumer. A typical use case for this scenario could be an email delivery system - where emails are sent to a queue and from there forwarded to multiple inboxes. If they are not delivered within a specified time (say 5 minutes), they could be considered as having been dropped.
With the above solution approaches, you can find if latency has increased between producer and consumer services. But sometimes, the messages have not reached consumers, and in that case, the end-to-end latency is undefined, and is not included in the p99 latency calculations.
In such a case, the producer metrics will be fine, and the consumers metrics will be fine. Consumer lag will be going up, but you need to know which messages could not make to consumer with a given SLO and might want to look into those traces and drill down by customers affected by doing a group by on customer_id and even deciding to act on the SLO breach by escalation.
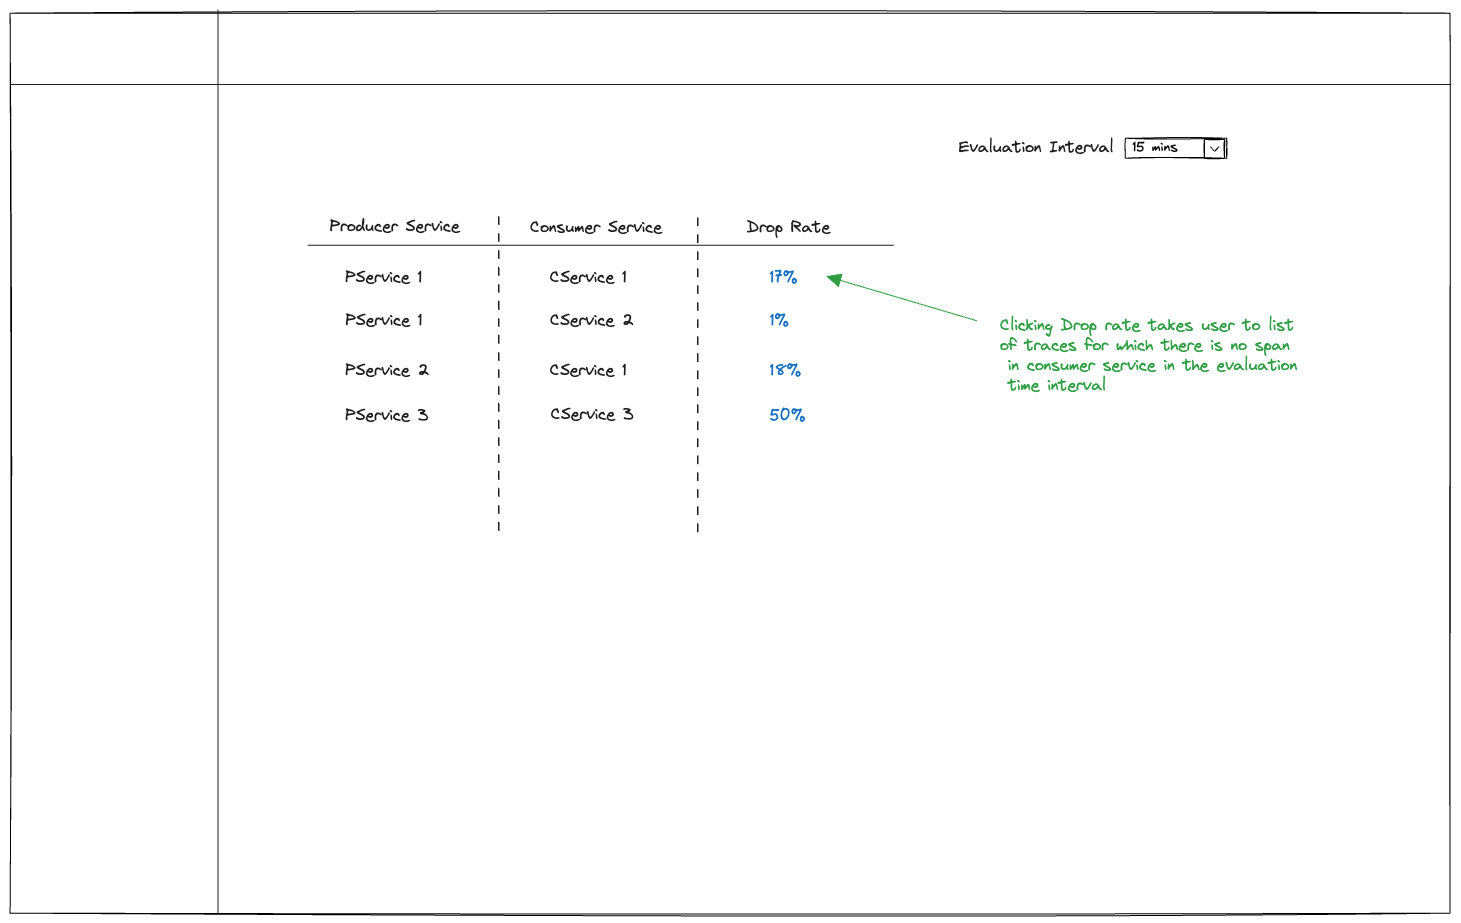 Fig 8: Dropping messages between Producer and Consumer
Approach
It may help users if there is a funnel chart that shows the drop rate between producer and consumer services. Assuming all the producer and consumer services are instrumented correctly, we have the complete traces of messages going from producer to consumer. And we can identify if a message has reached from producer to consumer in a given time period.
In this proposal, we plan to show the list of producer and consumer services and the drop rate between them after a given time period. Users can dive deeper into the drop rates by clicking them to see traces for which we have not received the consumer span in the selected time period.
The evaluation period for determining the drop rate would be configurable as different businesses have different expectations of when the messages should reach the consumer.
Conclusion and Questions
In the above sections, we have explained the limitations of currently available solutions for monitoring messaging systems (more specifically, Kafka). We have proposed solutions on how this can be improved by deeply leveraging tracing powered by OpenTelemetry.
Which of the scenarios seem most relevant to you and is the proposed solution useful or you would like to see any more data points. Would love to get any inputs on that.
Write to us at support@signoz.io or book a call
Read more about Monitoring Kafka Clients with OpenTelemetry:
Complete Guide to tracing Kafka clients with OpenTelemetry in Go
Hands on follow along Java example with Kafka and OTeL Client side instrumentation
[Video] Detailed tutorial on setting up tracing for Kafka clients with OpenTelemetry
