Kubectl Top Pod/Node - Monitor K8s Resource Usage
Kubernetes clusters can quickly become complex, making resource monitoring a critical task for maintaining optimal performance. Enter kubectl top — a powerful command-line tool that provides real-time insights into your cluster's resource usage.
Kubectl Top command can be used to retrieve snapshots of resource utilization of pods or nodes in your Kubernetes cluster.
In this article, we will see how to use kubectl Top command to get and read metrics about pods and nodes. We will also breakdown the output to understand what it means.

Quick Guide: How to Use kubectl top Command
Before diving into the details, here's a quick reference for using kubectl top:
- Monitor node resources:
kubectl top node - Track pod resource usage:
kubectl top pod - View specific namespace:
kubectl top pod -n <namespace> - Sort by CPU usage:
kubectl top pod --sort-by=cpu - Sort by memory usage:
kubectl top pod --sort-by=memory
These commands give you a snapshot of resource utilization across your cluster. Let's explore each in more depth.
What is kubectl?
kubectl is the Kubernetes command-line tool, and it allows you to run commands against your Kubernetes cluster. kubectl lets you interact with your Kubernetes cluster for day-to-day management. For example, kubectl get nodes lets you retrieve details about nodes running in your cluster or namespace.
Under the hood, kubectl interacts with the API server. The API server is responsible for all communication between Kubernetes components, including both the internal components of your Kubernetes cluster and external components. kubectl sends out POST commands to the API server endpoint in order to execute its commands.
What is a pod in Kubernetes?
Kubernetes is meant to orchestrate the management of containers. Pods are the first level of abstraction that it provides over containers.
Pods are groups of one or more containers with shared resources like storage and networks. They are used as units of replication in cases where applications need to be scaled up or down.
What is a node in Kubernetes?
Nodes are where Kubernetes pods run. Nodes can be virtual machines, bare metal servers in a data center, or instances in a private or public cloud. Kubernetes uses nodes to handle on-demand scaling of resources.
A single node can have multiple pods separated by namespaces.
What is kubectl top and Why is it Essential?
As mentioned before, kubectl - pronounced (Kube: c-t-l) - is a CLI for running commands that can help you interact with a Kubernetes interface or resources in a k8 cluster. These resources include pods, deploy, replica set, etc.
It's essential for several reasons:
- Real-time monitoring: Get instant insights into CPU and memory usage.
- Performance optimization: Identify resource bottlenecks and overutilized components.
- Capacity planning: Make informed decisions about scaling and resource allocation.
- Troubleshooting: Quickly spot abnormal resource consumption patterns.
Each node in Kubernetes comes with cAdvisor, which is an open-source agent that monitors resource usage about containers. kubectl command gets resource utilization metrics from cAdvisor via the metrics-server.
Understanding Kubernetes Resource Metrics
Before diving deeper into kubectl top, it's crucial to understand the metrics it provides:
- CPU: Measured in cores or millicores (1 core = 1000 millicores).
- Memory: Typically measured in bytes (B, KiB, MiB, GiB).
Kubernetes distinguishes between:
- Requests: The minimum amount of resources guaranteed to a container.
- Limits: The maximum amount of resources a container can use.
- Actual usage: The real-time consumption of resources.
kubectl top shows the actual usage, helping you compare it against the requests and limits to optimize your resource allocation.
To obtain these metrics, you need to run the kubectl top command which shows the CPU, memory, and network utilization for the containers, pods, or nodes. For the kubectl top command to work, you need to have metrics API installed. You can find instructions to install metrics API here.
Now that you have a brief understanding of the concepts let’s see how the kubectl top command operates.
How to Use kubectl top: A Comprehensive Guide
Monitoring Node Resources with kubectl top node
Running the kubectl top node command lists metrics of the current node which would look like this:
kubectl top node

NAME                 CPU(cores)   CPU%   MEMORY(bytes)   MEMORY%
kind-control-plane   338m         4%     1662Mi          10%
How to read the output from kubectl top?
The output from kubectl top node gives you information about CPU(cores), CPU%, memory, and memory%. Let’s see what these terms mean:
- CPU(cores)
338mmeans 338 millicpu.1000mis equal to 1 CPU, hence 338m means 33.8% of 1 CPU. - CPU%
It is displayed only for nodes, and it stands for the total CPU usage percentage of that node. - Memory
Memory being used by that node - Memory%
It is also displayed only for nodes, and it stands for total memory usage percentage of that node.
Running the kubectl top node <node-name> command lists metrics for a specific node:
NAME                 CPU(cores)   CPU%   MEMORY(bytes)   MEMORY%
kind-control-plane   338m         4%     1662Mi          10%
Running the kubectl top node <node-name> -containers command lists metrics for each container running on a specific node:
NAME                     CPU(cores)   CPU%   MEMORY(bytes)   MEMORY%
nginx-653c7b42sd-4g5ce   20m          12%    14Mi            18%
nginx-653c7b42sd-7c9ae   15m          7%     12Mi            12%
Running the kubectl top node <node-name> -containers -n namespace command lists metrics for each container running on a specific node in a specific namespace:
NAME                     CPU(cores)   CPU%   MEMORY(bytes)   MEMORY%
nginx-653c7b42sd-4g5ce   22m          12%    12Mi            19%
nginx-653c7b42sd-7c9ae   16m          7%     10Mi            16%
webserver-container      13m          5%     10Mi            15%
Tracking Pod Resource Consumption with kubectl top pod
Running the kubectl top pod command displays the metrics about pods from the default namespace which looks like this:
NAME                     CPU(Cores)   MEMORY(Bytes)
nginx                    3m           1Mi
nginx-653c7b42sd-4g5ce   3m           1Mi
nginx-653c7b42sd-7c9ae	 3m	          1Mi
Here Mi under memory stands for mebibytes.
Running the kubectl top pod command with --all-namespaces lists down pods from all namespaces in your k8s cluster. For example, below is a snapshot from SigNoz k8s cluster.
kubectl top pod --all-namespaces
NAMESPACE            NAME                                                        CPU(cores)   MEMORY(bytes)
kube-system          coredns-558bd4d5db-k7mfl                                    8m           11Mi
kube-system          coredns-558bd4d5db-qwrrk                                    8m           12Mi
kube-system          etcd-kind-control-plane                                     32m          45Mi
kube-system          kindnet-trm65                                               1m           7Mi
kube-system          kube-apiserver-kind-control-plane                           105m         408Mi
kube-system          kube-controller-manager-kind-control-plane                  22m          62Mi
kube-system          kube-proxy-8n86t                                            2m           17Mi
kube-system          kube-scheduler-kind-control-plane                           5m           28Mi
kube-system          metrics-server-57bfd75b9-bhrwl                              5m           14Mi
local-path-storage   local-path-provisioner-547f784dff-tjnqb                     3m           9Mi
platform             chi-signoz-cluster-0-0-0                                    43m          149Mi
platform             clickhouse-operator-8cff468-hggdm                           1m           24Mi
platform             my-release-signoz-alertmanager-0                            2m           14Mi
platform             my-release-signoz-frontend-f8587978f-7wj8f                  1m           6Mi
platform             my-release-signoz-otel-collector-cbf578f44-69twr            4m           52Mi
platform             my-release-signoz-otel-collector-metrics-5dcb767c77-5bgpt   4m           38Mi
platform             my-release-signoz-query-service-0                           3m           57Mi
platform             my-release-zookeeper-0                                      5m           90Mi
You can also use the --namespace flag to get information about pods from a particular namespace. For example, in the below snapshot, we can see details about pods from the platform namespace.
kubectl top pod --namespace platform
NAME                                                        CPU(cores)   MEMORY(bytes)
chi-signoz-cluster-0-0-0                                    44m          165Mi
clickhouse-operator-8cff468-hggdm                           1m           24Mi
my-release-signoz-alertmanager-0                            2m           14Mi
my-release-signoz-frontend-f8587978f-7wj8f                  1m           6Mi
my-release-signoz-otel-collector-cbf578f44-69twr            5m           54Mi
my-release-signoz-otel-collector-metrics-5dcb767c77-5bgpt   5m           38Mi
my-release-signoz-query-service-0                           3m           57Mi
my-release-zookeeper-0                                      4m           91Mi
Running the kubectl top pod -l <label-selector> command lists metrics for pods that match a specific label selector:
NAME                       CPU(Cores)   MEMORY(Bytes)
webserver-1                3m           1Mi
webserver-2                5m           3Mi
Running the kubectl top pod <pod-name> -containers command lists metrics for each container running in a specific pod:
NAME                     CPU(cores)   CPU%   MEMORY(bytes)   MEMORY%
nginx-653c7b42sd-4g5ce   20m          12%    14Mi            18%
nginx-653c7b42sd-7c9ae   15m          7%     12Mi            12%
Running the kubectl top pod -n <namespace> -containers command lists metrics for each container running in pods in a specific namespace:
NAME                     CPU(cores)   CPU%   MEMORY(bytes)   MEMORY%
nginx-653c7b42sd-4g5ce   20m          12%    14Mi            18%
nginx-653c7b42sd-7c9ae   15m          7%     12Mi            12%
Running the kubectl top pod -l <label-selector> -containers command lists metrics for each container running in pods that match a specific label selector:
NAME           CPU(cores)    CPU%   MEMORY(bytes)   MEMORY%
webserver-1    50m           15%    40Mi            30%
mwebserver-2   26m           8%     15Mi            16%
Use Cases of kubectl top pod/node command
Here are some use cases where kubectl top pod or kubectl top node command can be useful:
Use cases of kubectl top node command:
- Node Health Monitoring: Monitoring the resource usage of nodes to ensure they are not overburdened, which is crucial for maintaining cluster health.
- Load Balancing: Identifying under-utilized or over-utilized nodes, which can inform decisions on workload distribution and node scaling.
- Preventive Maintenance: Detecting nodes with consistently high resource usage, potentially indicating the need for maintenance or upgrade.
Use cases of kubectl top pod command:
- Resource Optimization: Identifying pods consuming excessive CPU or memory resources, enabling optimization of pod resource allocation.
- Troubleshooting: Helping diagnose issues in applications by monitoring pod resource usage, especially when pods are not performing as expected.
- Capacity Planning: Assisting in understanding current pod resource usage, facilitating better decisions for scaling and infrastructure planning.
Advanced kubectl top Usage
kubectl top becomes even more powerful when combined with other kubectl commands and options:
-
Use labels and selectors: Filter pods based on labels:
kubectl top pod -l app=nginx -
Monitor individual containers: View container-level metrics within a pod:
kubectl top pod --containers -
Combine with other kubectl commands: Use
kubectl getwithkubectl top:kubectl get pods | grep running | cut -d' ' -f1 | xargs kubectl top podThis command shows resource usage for all running pods.
Best practices for regular monitoring include:
- Set up automated checks using
kubectl topin scripts - Establish baseline metrics for your applications
- Regularly compare current usage against historical data
Troubleshooting Common kubectl top Issues
When using kubectl top, you might encounter some common issues:
-
"Metrics not available" error: Ensure the Metrics Server is properly installed and running:
kubectl get deployment metrics-server -n kube-system -
Delayed metrics: The Metrics Server aggregates data every 15 seconds by default. Allow some time for metrics to populate.
-
Permission issues: Verify your RBAC settings allow access to the Metrics API:
kubectl auth can-i get pods.metrics.k8s.io
Monitoring Kubernetes in Production
Resource utilization metrics are key to understanding the health of your Kubernetes cluster. From the article, you learned how to get resource utilization snapshots using the kubectl top command.
Though the kubectl top command gives you basic metrics about resource utilization, it is very convenient to inspect your nodes and pods at any time. For example, if you see that there is a sudden spike in your resource utilization, you can check which pod is consuming the most resources.
But if you're using Kubernetes in production, you can't rely on manual spot-checks to monitor your system's health and performance. Kubernetes provides us with a smarter way to manage our resources for scaling cloud-native applications on demand. You need to monitor your Kubernetes resources effectively. If you want to dive deeper into Kubernetes monitoring, you can check out SigNoz.
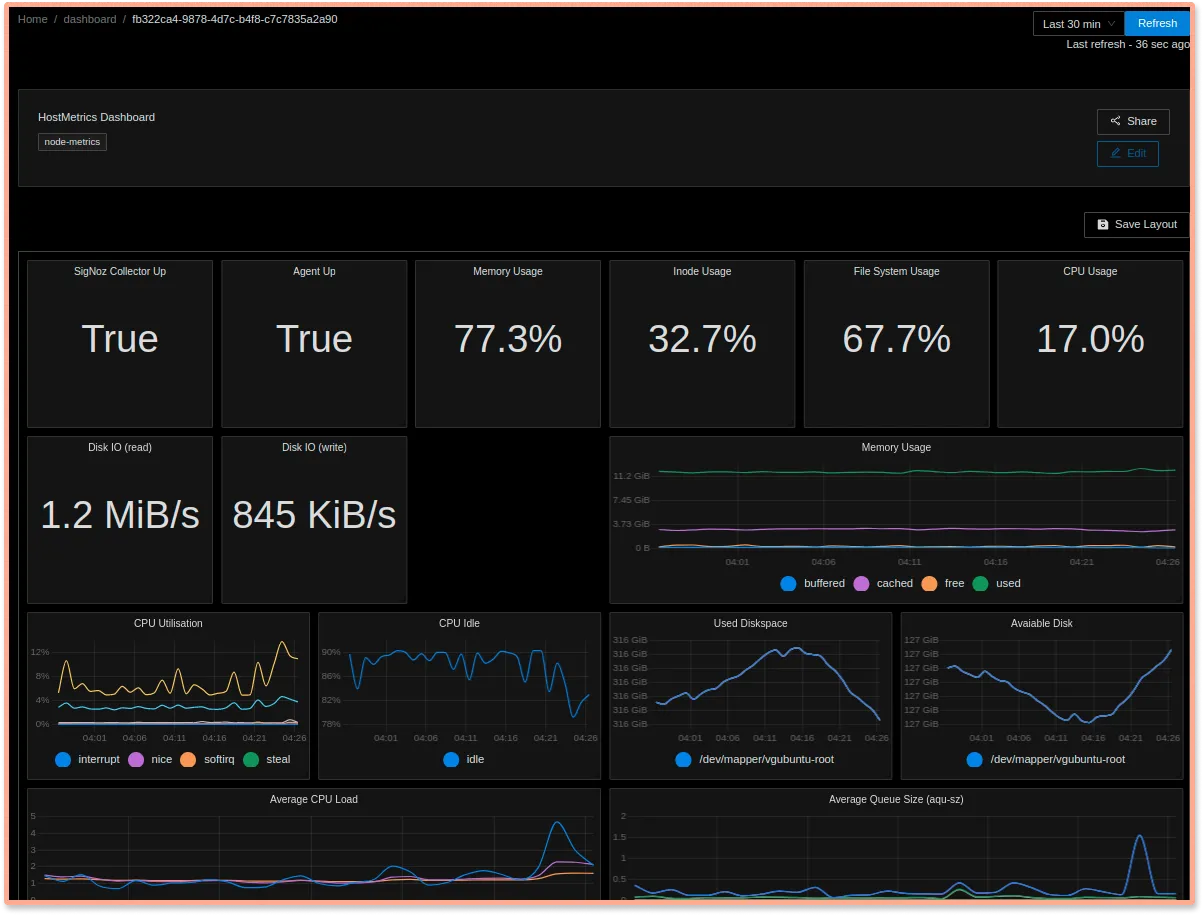
SigNoz is a full-stack open-source APM tool that can help you monitor your Kubernetes cluster. It uses OpenTelemetry to collect metrics from your K8s cluster for monitoring. OpenTelemetry is becoming the world standard for instrumentation of cloud-native applications, and it is backed by CNCF foundation, the same foundation under which Kubernetes graduated.
Getting started with SigNoz
SigNoz Cloud is the easiest way to run SigNoz. Sign up for a free account and get 30 days of unlimited access to all features.

You can also install and self-host SigNoz yourself since it is open-source. With 24,000+ GitHub stars, open-source SigNoz is loved by developers. Find the instructions to self-host SigNoz.
Kubectl top Best Practices and Tips
To make the most of kubectl top, consider these best practices:
- Establish monitoring routines: Regularly check resource usage to catch issues early.
- Combine with other tools: Use
kubectl topalongside tools like SigNoz for a holistic view. - Use for capacity planning: Analyze trends to make informed scaling decisions.
- Automate checks: Incorporate
kubectl topinto your CI/CD pipelines for continuous monitoring.
Key Takeaways
- The kubectl top command provides snapshots of resource utilization metrics for pods and nodes in a Kubernetes cluster.
- This command is essential for monitoring the health and performance of your Kubernetes infrastructure.
- The kubectl top node command shows CPU and memory usage for each node, helping with load balancing and preventive maintenance.
- The kubectl top pod command displays resource usage for individual pods, aiding in resource optimization and troubleshooting.
- For more in-depth and continuous monitoring in a production environment, tools like SigNoz, which leverage OpenTelemetry, are recommended.
FAQs
How often should I run kubectl top to monitor my cluster?
Run kubectl top at regular intervals, such as every 5-15 minutes, for ongoing monitoring. For more frequent checks, consider using a monitoring solution like SigNoz.
Can kubectl top show historical data or trends?
No, kubectl top only shows current usage. For historical data and trends, use a dedicated monitoring tool like SigNoz.
What's the difference between kubectl top and kubectl describe when it comes to resource information?
kubectl top shows real-time resource usage, while kubectl describe provides static configuration information, including resource requests and limits.
How can I use kubectl top to identify pods that are approaching their resource limits?
Compare the output of kubectl top pod with the resource limits set in your pod specifications. If usage is consistently close to the limits, consider adjusting your resource allocation.
What is the kubectl top command used for?
The kubectl top command is used to retrieve snapshots of resource utilization metrics for pods and nodes in a Kubernetes cluster. It provides real-time insights into CPU and memory usage, helping with monitoring and performance optimization.
How do I monitor node resources using kubectl top?
To monitor node resources, use the command kubectl top node. This will display CPU and memory usage for each node in your Kubernetes cluster.
Can I view resource usage for specific pods?
Yes, you can view resource usage for specific pods using the command kubectl top pod. You can also use flags like -n <namespace> to specify a particular namespace or -l <label-selector> to filter pods based on labels.
What do the CPU values mean in kubectl top output?
In kubectl top output, CPU is measured in cores or millicores. For example, "338m" means 338 millicores, which is equivalent to 33.8% of 1 CPU core.
How can I view container-level metrics within a pod?
To view container-level metrics within a pod, use the command kubectl top pod --containers. This will display CPU and memory usage for each container in the pods.
Does kubectl top show historical data or trends?
No, kubectl top only shows current usage data. For historical data and trends, you need to use a dedicated monitoring tool like SigNoz or set up your own metrics collection and storage system.
How often should I run kubectl top for effective monitoring?
For basic monitoring, running kubectl top every 5-15 minutes can be effective. However, for more frequent checks and comprehensive monitoring, it's recommended to use a dedicated monitoring solution that continuously collects and analyzes data.
What's required for kubectl top to work properly?
For kubectl top to work, you need to have the Metrics API installed in your Kubernetes cluster. This typically involves deploying the Metrics Server, which collects resource usage data from kubelets and makes it available through the Metrics API.
Related Posts
