Kubernetes Metrics Server | How to deploy k8s metrics server and use it for monitoring
Modern digital businesses have adopted cloud technology and distributed architectures to enable on-demand scaling of resources. Containerization technologies like Kubernetes and Docker have made it possible to handle customer demands at scale. However, orchestrating a complex microservices architecture with Kubernetes is challenging. Monitoring your Kubernetes cluster can give you insights to better manage your cluster.
In this blog post, I’ll assume you have orchestrated your microservices with Kubernetes, and you want to monitor those services with Kubernetes Metrics Server. Let’s first define what this k8s metrics server is.
What is Kubernetes Metrics Server?
The Kubernetes Metrics Server is a resource metrics monitoring tool for Kubernetes. The Kubernetes Metrics Server measures CPU and memory usage across the Kubernetes cluster. This metrics-server collects metrics and then shows resource usage statistics for your cluster so that you can monitor resource usage for each node and also for each pod.
You can monitor your resource usage with simple commands using the top command like kubectl top pods and kubectl top nodes.
Setting up Kubernetes Local Cluster
In this tutorial, I will use kind which is a tool to run a Kubernetes cluster locally using Docker containers, unlike the popular minikube project, which uses virtual machines.
Let’s create a new k8s cluster with this command:
kind create cluster
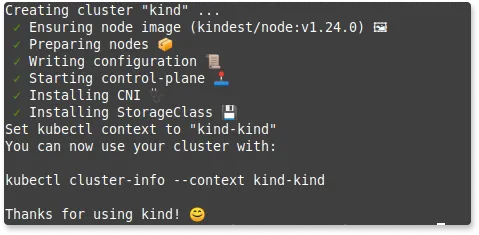
kind will create a default cluster called kind. If you want to configure the name of the cluster, you can add the --name option with its value like kind create cluster --name prod1.
To list the currently used context by kubectl, use the following:
kubectl config current-context
which will show you the kind-kind as the currently used context.
If you want to make sure you use this context not something else, make sure to use kind-kind context with the following command:
kubectl config use-context kind-kind
You will get an output like this: Switched to context "kind".
Kubernetes metrics-server is available on Github. Let’s open that link and head over to the Installation section.
Installing Kubernetes Metrics Server
The k8s metrics server is not installed by default in your Kubernetes cluster.
With the following command:
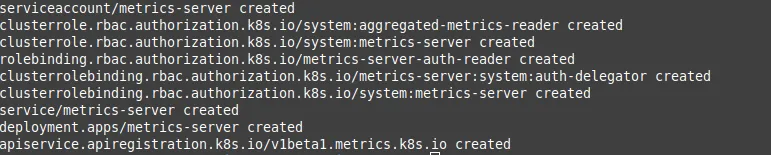
kubectl apply -f https://github.com/kubernetes-sigs/metrics-server/releases/latest/download/components.yaml
you will create the necessary components for kubernetes metrics server:
To get the stats about your resources, you just need to run these commands. To monitor the resources of your nodes:
kubectl top nodes
To monitor the resource of your pods:
kubectl top pods
Sometimes you’ll need to add more configurations to your setup. This depends on your initial cluster configs.
In my case, I encounted this error:
Error from server (ServiceUnavailable): the server is currently unable to handle the request (get nodes.metrics.k8s.io)
which means the monitoring service is unavailable yet. So how can we troubleshoot this to make the server handle the request?
If you face the same error, don’t worry. It needs a bit more configs to the components yaml file.
You can investigate this and see if the metrics server is installed properly or not with the following command:
kubectl get apiservices | grep metrics
which shows something like:
NAME                         SERVICE                      AVAILABLE                       AGE
v1beta1.metrics.k8s.io       kube-system/metrics-server   False (MissingEndpoints)        42m
You’ll find that the metrics server is not available. (False in the AVAILABLE column)
kubectl edit deployments.apps -n kube-system metrics-server
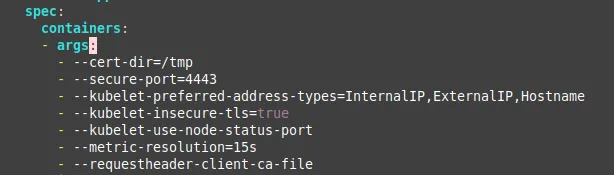
and then use your favorite text editor to edit the YAML file. For example, when you use vim scroll down until you see the spec object. Make sure you add the following options:
--kubelet-insecure-tls=true
--requestheader-client-ca-file
like this:
After you finish editing, press ESC on your keyboard to close the vim insert mode and be in the normal mode. Press :wq! to close vim and save your edits.
On the terminal, you’ll see a message appeared like this:
deployment.apps/metrics-server edited
Now you’ll see that the metrics server is set up properly. If you try to grep the metrics-server API service, you’ll find something like the following:
v1beta1.metrics.k8s.io kube-system/metrics-server True 42m
which means the service is now avaiable and you can use it.
Congrats! You’re ready to use the top command to monitor your application:
kubectl top no
NAME                 CPU(cores)   CPU%   MEMORY(bytes)   MEMORY%
kind-control-plane   212m         5%     759Mi           12%
no is the same as nodes and node
In my case, this is kind of a trivial experiment. In your case, you might have a bunch of nodes spun up. So make sure you wait until the metrics server collects metrics from all nodes.
The top command is real-time and shows you resource usage at the moment. For example, it can’t show you what your resource usage was yesterday or a week ago.
If you want to monitor your resource usage across a wider time span, you’ll need a dedicated monitoring tool like SigNoz.
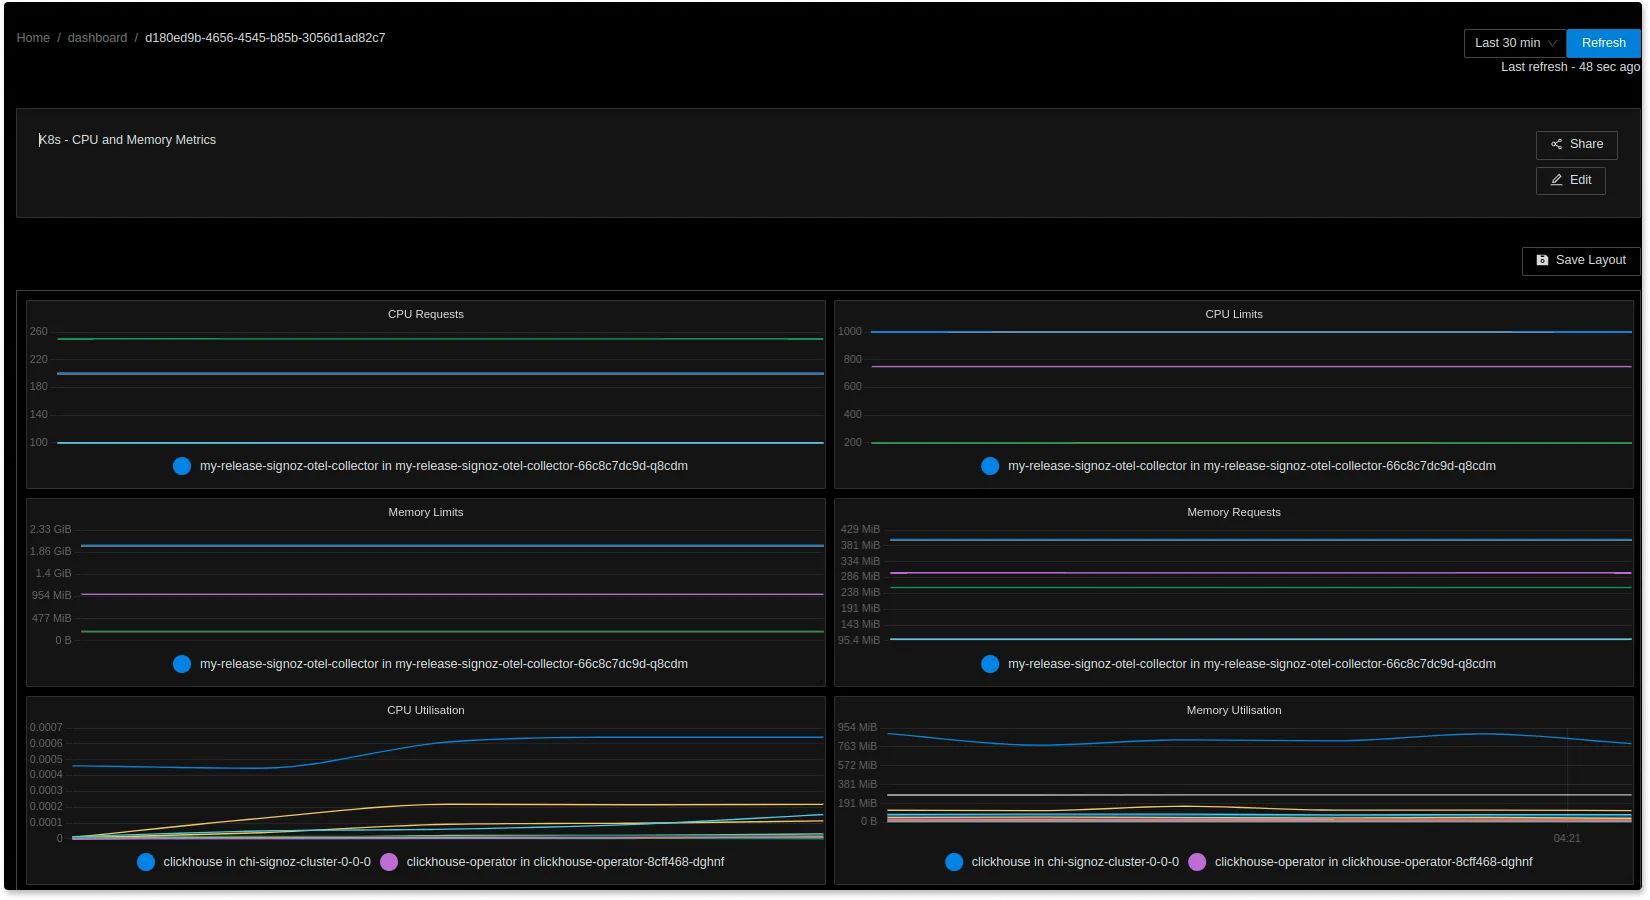
Visualizing Kubernetes resource metrics with SigNoz
SigNoz is a full-stack open source observability tool. It uses OpenTelemetry to collect telemetry data (logs, metrics, and traces). OpenTelemetry is quietly becoming the world standard for instrumenting cloud-native applications. It is incubated by Cloud Native Computing Foundation (CNCF), the same foundation under which Kubernetes graduated.
SigNoz can help you store and visualize your telemetry data with out-of-box charts. It can help you monitor Kubernetes metrics and logs with customized dashboards.
If you want to learn more about monitoring your Kubernetes cluster with SigNoz, read the following blog:
Kubernetes Monitoring with Open Source Tools - OpenTelemetry and SigNoz
If you want to know more about SigNoz, read the following blog:
