Kubernetes Logging | Set Up K8s Log Monitoring with OpenTelemetry
For a more comprehensive, modern, and automated guide using the official OpenTelemetry Helm charts, check out our new definitive tutorial: Kubernetes Observability with OpenTelemetry.
Kubernetes is a powerful orchestration tool for managing containers, but it comes with its own set of challenges. One of the biggest hurdles is effectively logging what's happening in your system. As your applications grow and spread across clusters, keeping track of their behavior becomes crucial.
In this article, we will discuss logging in Kubernetes, common Kubernetes log types, and how logs can be effectively tracked and managed. At the end of the article, you will be able to set up Kubernetes Logs monitoring with open-source tools - SigNoz and OpenTelemetry.

Before we dive in, let's first take a quick look at some essential concepts.
What is Kubernetes?
Kubernetes, often abbreviated as K8s, is an open-source container orchestration platform designed to automate the deployment, scaling, and management of containerized applications. It provides a framework for efficiently running multiple containers across a cluster of machines.
What is a log?
Simply put, a log is a text record of an event or incident that took place at a specific time. There are few possibilities of figuring out what went wrong when your software crashes, and you need logging information. This is why logs are very important.
Why Logging Matters in Kubernetes
Logging in Kubernetes is not just a best practice; it's a fundamental necessity. In traditional monolithic applications, logs were primarily generated by a single application running on a single server. However, in the Kubernetes landscape, with applications split into microservices and distributed across clusters, logs become the lifeblood of observability. They provide essential insights into the behavior, performance, and health of each container and pod.
What Should You Log in Kubernetes?
Effective logging is essential for troubleshooting issues and ensuring application health. By capturing the right data, you gain valuable insights for proactive management and root cause analysis. Here are some of the important logs you can collect in Kubernetes:
- Container Logs
- Node Logs
- Cluster Logs
- Event Logs
- Audit Logs
Container logs
Container logs refer to the output generated by applications or processes running inside a container, and these containers exist within a pod. When a container runs, it produces various kinds of information, including status updates, error messages, and any other output it might generate during its operation. These logs are essential for monitoring the health and behavior of applications within a Kubernetes cluster. They can provide insights into how an application is performing, help diagnose issues, and aid in troubleshooting.
Container logs are typically written to two standard streams:
- stdout (Standard Output): This stream is used for normal, expected output from an application. It may include status messages, progress updates, and any other information the application is designed to output during regular operation.
- stderr (Standard Error): This stream is used for error messages and exceptional conditions. It contains information about problems, failures, and any unexpected behavior that the application encounters.
To access logs in Kubernetes, we can use kubectl. Kubectl is a Kubernetes command line tool used to manage Kubernetes clusters. It allows users to interact with Kubernetes clusters to deploy, manage, and troubleshoot applications. With kubectl, you can create, inspect, update, and delete resources within a Kubernetes cluster.
To retrieve logs from a particular container within a pod with more than one containers, you can use the kubectl logs command. Here's the format:
kubectl logs <pod-name> -c <container-name>
This command will display the logs from the specified container. By default, it will show the stdout stream.
In a situation when a pod has only one container in it, you can use the below format to retrieve the logs:
kubectl logs <pod-name>
The following YAML code defines a Pod named logging that utilizes a BusyBox container to demonstrate basic logging:
apiVersion: v1
kind: Pod
metadata:
  name: flog-pod
spec:
  containers:
  - name: flog-container
    image: mingrammer/flog
    command: ["flog", "-p", "8080"]
The provided configuration sets up a container that continually logs a timestamp, incrementing with each iteration.
Once the Pod is deployed, you can access its logs using the following command:
kubectl logs logging
The output will display a chronological series of log entries, each tagged with an index and timestamp, as illustrated below:
0: Mon Oct  2 01:18:29 UTC 2023
1: Mon Oct  2 01:18:30 UTC 2023
2: Mon Oct  2 01:18:31 UTC 2023
3: Mon Oct  2 01:18:32 UTC 2023
4: Mon Oct  2 01:18:33 UTC 2023
5: Mon Oct  2 01:18:34 UTC 2023
6: Mon Oct  2 01:18:35 UTC 2023
7: Mon Oct  2 01:18:36 UTC 2023
8: Mon Oct  2 01:18:37 UTC 2023
9: Mon Oct  2 01:18:38 UTC 2023
10: Mon Oct  2 01:18:39 UTC 2023
11: Mon Oct  2 01:18:40 UTC 2023
Node logs
Node logs refer to the logs generated by the Kubernetes components that run on each node, for example, Kubelet, Kube-proxy, within the Kubernetes cluster. They offer critical insights into a node's operations, health status, and behavior, including events, errors, and container activities. Accessing node logs can be achieved in various ways depending on which component you're interested in.
Here's the format for accessing the logs of the kube-proxy component:
kubectl logs -n kube-system <name-of-the-kube-proxy-pod>
Cluster logs
Cluster logs refer to the logs generated by various components and services that make up the Kubernetes control plane and its nodes. These logs provide crucial information about the behavior and activities of the Kubernetes cluster as a whole. Some of the components that generate cluster logs include the API Server, Controller Manager, Scheduler, Kubelet, etcd.
Event logs
Event logs provide a historical record of everything that has happened in the cluster. They capture significant occurrences related to resources, such as pods, deployments, services, etc. These events are typically triggered by actions like creation, modification, or deletion of resources.
To retrieve event logs from your cluster, you can apply the below format:
kubectl get events
If you want to filter events based on specific criteria, you can use field selectors. For example, to get events related to a specific resource, you can use:
kubectl get events --field-selector involvedObject.name=<resource-name>
Audit logs
Audit logs provide a security-focused record of actions taken within the cluster. They track requests made to the Kubernetes API server, detailing who made the request, what action was performed, and other relevant information like the source IP address.
Kubernetes Logging Best Practices
There are essential best practices to follow when it comes to logging in Kubernetes. These practices are important to ensure that your logs are efficiently stored and readily available for analysis when necessary.
Here are some of the best practices to adopt when logging in Kubernetes:
Use Centralized Logging Solutions
Implement a centralized logging solution to aggregate logs from all Kubernetes pods and containers. This simplifies troubleshooting, monitoring of application performance, and enables efficient storage, analysis, and retrieval of logs in one place.
Log Rotation
Configure log rotation policies to prevent log files from consuming too much disk space. This ensures that disk space isn't consumed by excessive logs and that you can access the most recent information.
Avoid Logging Sensitive Data
Refrain from logging sensitive data such as passwords, API keys, or access tokens. Instead, securely store this information using Kubernetes Secrets or environment variables to prevent exposure in logs.
Use Structured Logging
Structured logs are easier to work with than plain text logs, making it simpler to manage and analyze logs effectively. It is best practice to adopt structured logging formats such as JSON to enhance log readability and enable easier parsing, analysis, and filtering.
Log Levels
Use log levels (e.g., debug, info, warn, error) consistently across your applications to categorize log messages based on their severity. This helps in filtering and prioritizing logs during analysis.
Contextual Logging
Include relevant contextual information in your logs, such as timestamps, pod names, container names, application versions, request IDs, and correlation IDs. This helps pinpoint the source of issues, understand the flow of events within your application, and trace requests across microservices when debugging distributed systems.
Limitations of kubectl
Accessing your container logs through the kubectl command is a good way to troubleshoot and know what happens when a pod becomes unavailable. However, when managing multiple Kubernetes clusters with numerous resources in each, it can become challenging to effectively monitor and troubleshoot issues during downtime or other critical events.
In such scenarios, having a comprehensive log management solution, like SigNoz, can significantly enhance your ability to track and analyze logs across your clusters.
An open-source solution for log management
SigNoz is a full-stack open source Application Performance Monitoring tool that you can use for monitoring logs, metrics, and traces. It offers a robust platform for log analysis and monitoring in Kubernetes clusters, making it easy to collect, search, analyze, and visualize logs generated by pods and containers. Its open source nature makes it cost-effective for organizations.
SigNoz uses OpenTelemetry for instrumenting applications. OpenTelemetry, backed by CNCF, is quickly becoming the world standard for instrumenting cloud-native applications. Kubernetes also graduated from CNCF. With the flexibility and scalability of OpenTelemetry and SigNoz, organizations can monitor and analyze large volumes of log data in real-time, making it an ideal solution for log management.
We will be using OpenTelemetry collector to collect and send Kubernetes logs to SigNoz. OpenTelemetry Collector is a stand-alone service provided by OpenTelemetry. It can be used as a telemetry-processing system with a lot of flexible configurations to collect and manage telemetry data.
Features of SigNoz
Here are some of the key features of SigNoz pertaining to its logging capabilities:
- Log query builder
The logs tab in SigNoz has advanced features like a log query builder, search across multiple fields, structured table view, the option to view logs in JSON format, etc.
With the advanced Log Query Builder feature in SigNoz, you can efficiently filter out logs by utilizing a mix and match of various fields. This feature empowers you to quickly narrow down the log data based on specific criteria, enhancing your ability to pinpoint relevant information.

- Real-time log analysis
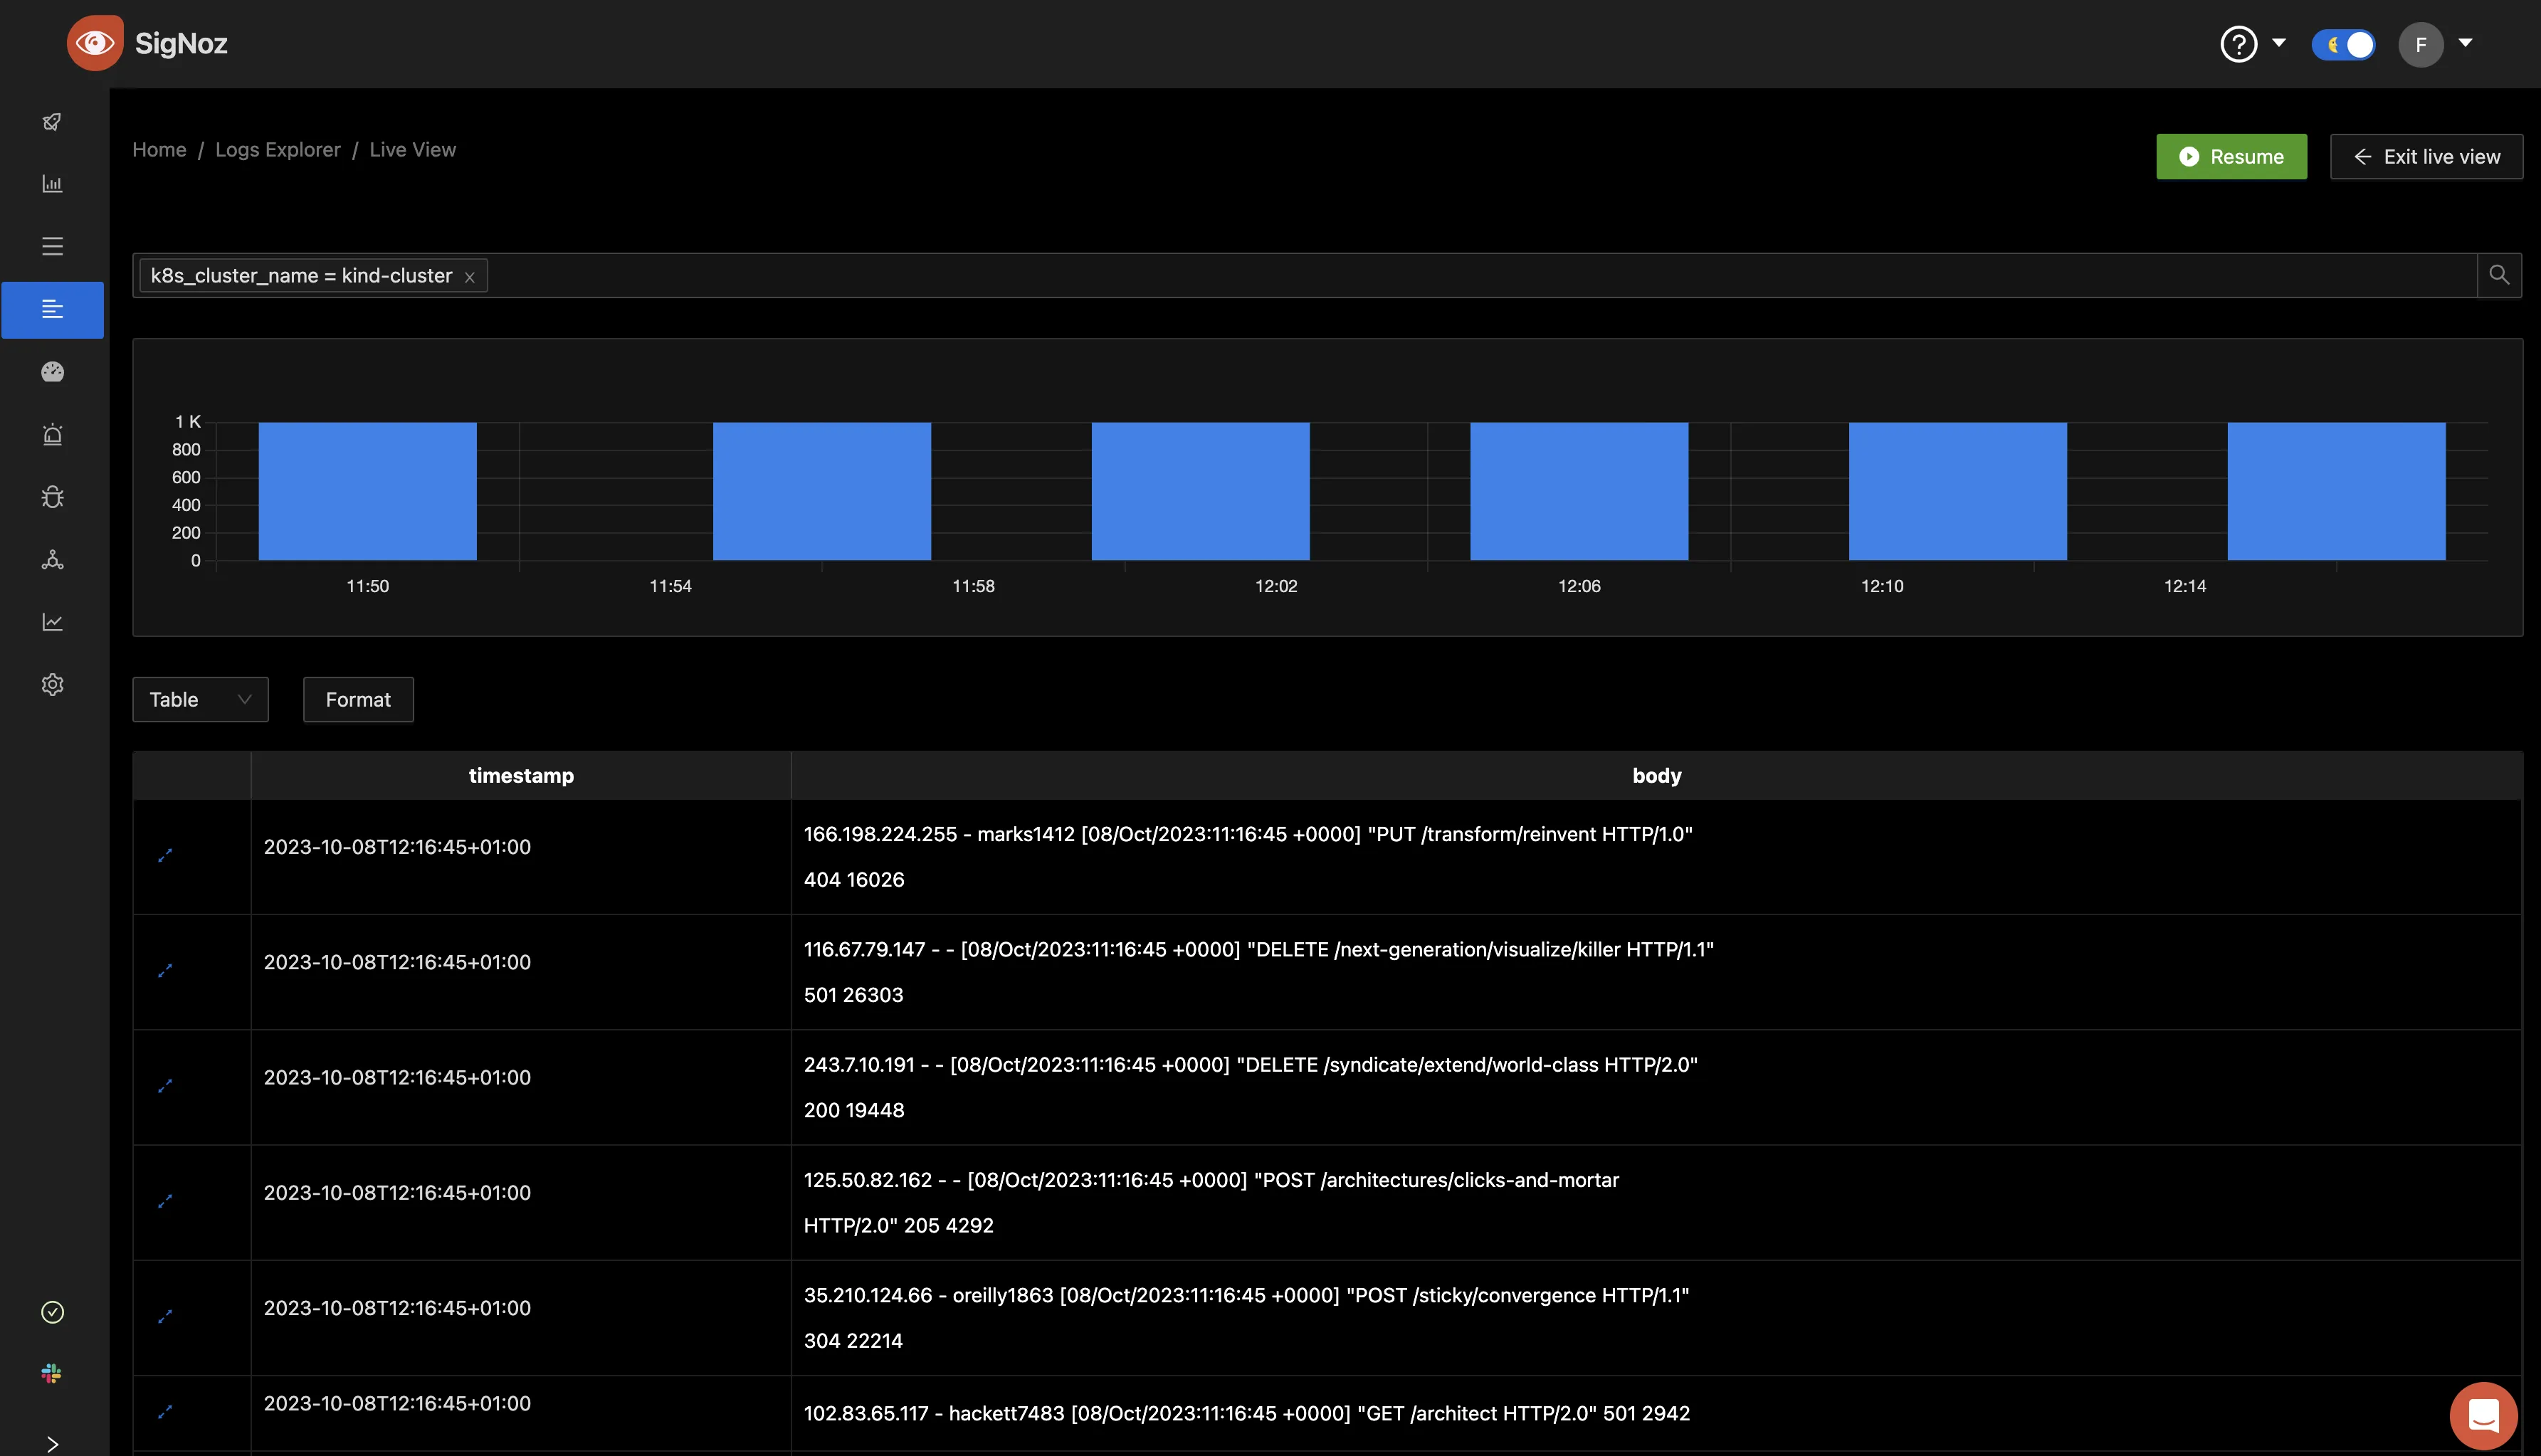
With SigNoz, you have the ability to analyze logs in real-time with live tail logging, allowing for quick searching, filtering, and visualization as they are generated. This can aid in uncovering patterns, trends, and potential issues and resolving them in a timely manner.
- Columnar database
SigNoz uses a columnar database, ClickHouse, to store logs, which is very efficient at ingesting and storing log data. Columnar databases like ClickHouse are very effective in storing log data and making it available for analysis.
Big companies like Uber have shifted from the Elastic stack to ClickHouse for their log analytics platform. Cloudflare, too, was using Elasticsearch for many years but shifted to ClickHouse because of limitations in handling large log volumes with Elasticsearch.
Collecting Kubernetes pod logs in SigNoz
Collecting logs from a Kubernetes cluster is essential for monitoring and troubleshooting applications running in the cluster. SigNoz provides a seamless way to aggregate and analyze these logs, offering valuable insights into your system's performance.
In this section, we will look at how logs from a Kubernetes cluster can be collected in SigNoz.
Prerequisite
Before you learn to collect your Kubernetes pod logs with SigNoz, ensure you have the following:
- A Kubernetes cluster. If you do not have an existing one, you can set up one using Kind.
Create a manifest file
Using a text editor like nano or vim, create a file called
logging.yamland paste the below configuration in it:apiVersion: v1 kind: Pod metadata: name: flog-pod spec: containers: - name: flog-container image: mingrammer/flog command: ["flog", "-p", "8080"]
The above manifest file creates a pod called flog-pod. Flog a fake log generator for common log formats such as apache-common, apache error and RFC3164 syslog. We will be utilizing it here to generate logs for us which we will be collecting in SigNoz.
To create the pod, run the following command in your terminal:
kubectl apply -f logging.yamlRun “kubectl get pods” to get the status of the pod, it should return a similar output as below:
NAME                                     READY   STATUS      RESTARTS    AGE
flog-pod                                 0/1     Completed   0           8s
This shows that the pod flog-pod has been created successfully and is in a completed state. It means that the container within the pod executed its task and then terminated.
To get the logs from the pod:
kubectl logs flog-pod
The output will return a series of events that occurred.
141.104.153.54 - - [06/Oct/2023:09:53:24 +0000] "GET /proactive/cross-media HTTP/1.1" 405 5230
87.8.151.208 - herzog6704 [06/Oct/2023:09:53:24 +0000] "DELETE /integrated/leverage/whiteboard/collaborative HTTP/2.0" 401 21462
177.28.163.73 - - [06/Oct/2023:09:53:24 +0000] "DELETE /schemas/mesh/metrics/convergence HTTP/1.1" 200 414
137.119.87.21 - - [06/Oct/2023:09:53:24 +0000] "POST /scale HTTP/1.0" 204 13569
147.198.228.233 - greenfelder5886 [06/Oct/2023:09:53:24 +0000] "GET /infrastructures/empower/niches/reintermediate HTTP/1.1" 405 18435
123.119.194.105 - reynolds8447 [06/Oct/2023:09:53:24 +0000] "PATCH /open-source/architect/maximize HTTP/1.0" 304 16713
91.94.26.180 - schroeder2618 [06/Oct/2023:09:53:24 +0000] "POST /synergistic/roi/convergence HTTP/1.1" 500 28384
42.129.142.123 - - [06/Oct/2023:09:53:24 +0000] "GET /applications/integrated/wireless HTTP/1.0" 200 29653
95.240.208.134 - mcglynn4013 [06/Oct/2023:09:53:24 +0000] "DELETE /open-source HTTP/2.0" 301 20973
210.176.77.131 - bode1417 [06/Oct/2023:09:53:24 +0000] "POST /transparent/enhance/communities/back-end HTTP/1.0" 405 4488
18.45.212.207 - - [06/Oct/2023:09:53:24 +0000] "PUT /strategic/technologies/maximize HTTP/1.1" 201 3020
122.106.190.147 - - [06/Oct/2023:09:53:24 +0000] "GET /e-business/intuitive/communities/revolutionary HTTP/1.1" 403 11206
42.140.17.150 - waelchi1534 [06/Oct/2023:09:53:24 +0000] "HEAD /seamless/value-added/b2b/deliver HTTP/1.1" 302 1310
79.150.67.28 - dare4802 [06/Oct/2023:09:53:24 +0000] "PATCH /open-source/front-end/partnerships HTTP/2.0" 400 271
51.161.12.176 - - [06/Oct/2023:09:53:24 +0000] "PUT /recontextualize/transparent/schemas HTTP/2.0" 302 2253
23.247.91.161 - vandervort5445 [06/Oct/2023:09:53:24 +0000] "POST /leverage/seize/synergies/deploy HTTP/1.1" 100 18335
71.83.241.129 - - [06/Oct/2023:09:53:24 +0000] "PUT /e-business/deliver/exploit HTTP/2.0" 502 7345
68.214.27.108 - hoppe8287 [06/Oct/2023:09:53:24 +0000] "PUT /partnerships/ubiquitous HTTP/1.0" 400 23764
87.119.173.34 - - [06/Oct/2023:09:53:24 +0000] "HEAD /real-time/synergize/viral/mission-critical HTTP/1.0" 403 878
238.162.147.123 - - [06/Oct/2023:09:53:24 +0000] "PATCH /extensible/ubiquitous/e-tailers HTTP/1.1" 500 21098
250.5.22.27 - - [06/Oct/2023:09:53:24 +0000] "POST /world-class HTTP/2.0" 403 16363
159.252.93.208 - - [06/Oct/2023:09:53:24 +0000] "DELETE /scale/matrix/roi HTTP/2.0" 504 12637
238.216.74.33 - - [06/Oct/2023:09:53:24 +0000] "POST /maximize/deliverables HTTP/2.0" 203 29944
........
From the provided logs, it's evident that a range of HTTP request methods were employed, including GET, POST, PUT, PATCH, HEAD, and OPTIONS. These requests returned various response codes, such as 200 OK, indicating success, 201 Created for successful resource creation, and 204 No Content for successful requests without a response body. Alongside these successful responses, several errors were encountered, including 400 Bad Request, 401 Unauthorized, 403 Forbidden, 404 Not Found, and 500 Internal Server Error. Notably, the server frequently returned 500 Internal Server Error and 501 Not Implemented.
Now to understand the logs better, we will send it to SigNoz.
Setup a SigNoz cloud account
SigNoz offers a free trial of 30 days with full access to all features. If you don’t already have an account, you can sign up here.
After signup, you should receive a mail to verify your email address and another containing an invitation URL, a URL to your cloud account, and an ingestion key for sending telemetry data.
You can also use the self-host version of SigNoz if you want. It’s completely free to use!
Install OTel-collectors in your k8s infra
To export Kubernetes metrics, you can enable different receivers in the OpenTelemetry collector, which will send metrics about your Kubernetes infrastructure to SigNoz.
These OpenTelemetry collectors will act as agents that send metrics about Kubernetes to SigNoz. OtelCollector agent can also be used to tail and parse logs generated by the container using filelog receiver and send it to the desired receiver.
We will be utilizing Helm, a Kubernetes package manager, to install the OtelCollector. To do this, follow the below steps:
Add the SigNoz helm repo to the cluster:
helm repo add signoz https://charts.signoz.ioIf the chart is already present, update the chart to the latest using:
helm repo updateInstall the release
helm install my-release signoz/k8s-infra  \
--set otelCollectorEndpoint=ingest.{region}.signoz.cloud:443 \
--set otelInsecure=false \
--set signozApiKey=<SIGNOZ_INGESTION_KEY> \
--set global.clusterName=<CLUSTER_NAME>
Replace {region} with the data region you selected when setting up your account.
Also, replace <SIGNOZ_INGESTION_KEY>with the key sent to your mail after the cloud account setup.
Then the <CLUSTER_NAME>should be the name of your cluster. If you are unsure of your cluster’s name, run the below command:
kubectl config current-context
The output you get after installing the release should resemble the below:
NAME: my-release
LAST DEPLOYED: Mon Oct  2 02:55:52 2023
NAMESPACE: default
STATUS: deployed
REVISION: 1
NOTES:
After this installation, the collector will automatically collect logs from your cluster and send them to SigNoz. If you want to select what and what not to be sent, you can set it using this.
View logs in SigNoz
In your browser, paste the URL sent to your mail to log in to your Signoz account. Once you are logged in, navigate to the Logs Explorer tab. There you can see the logs collected from your Kubernetes cluster displayed in a bar chart format.
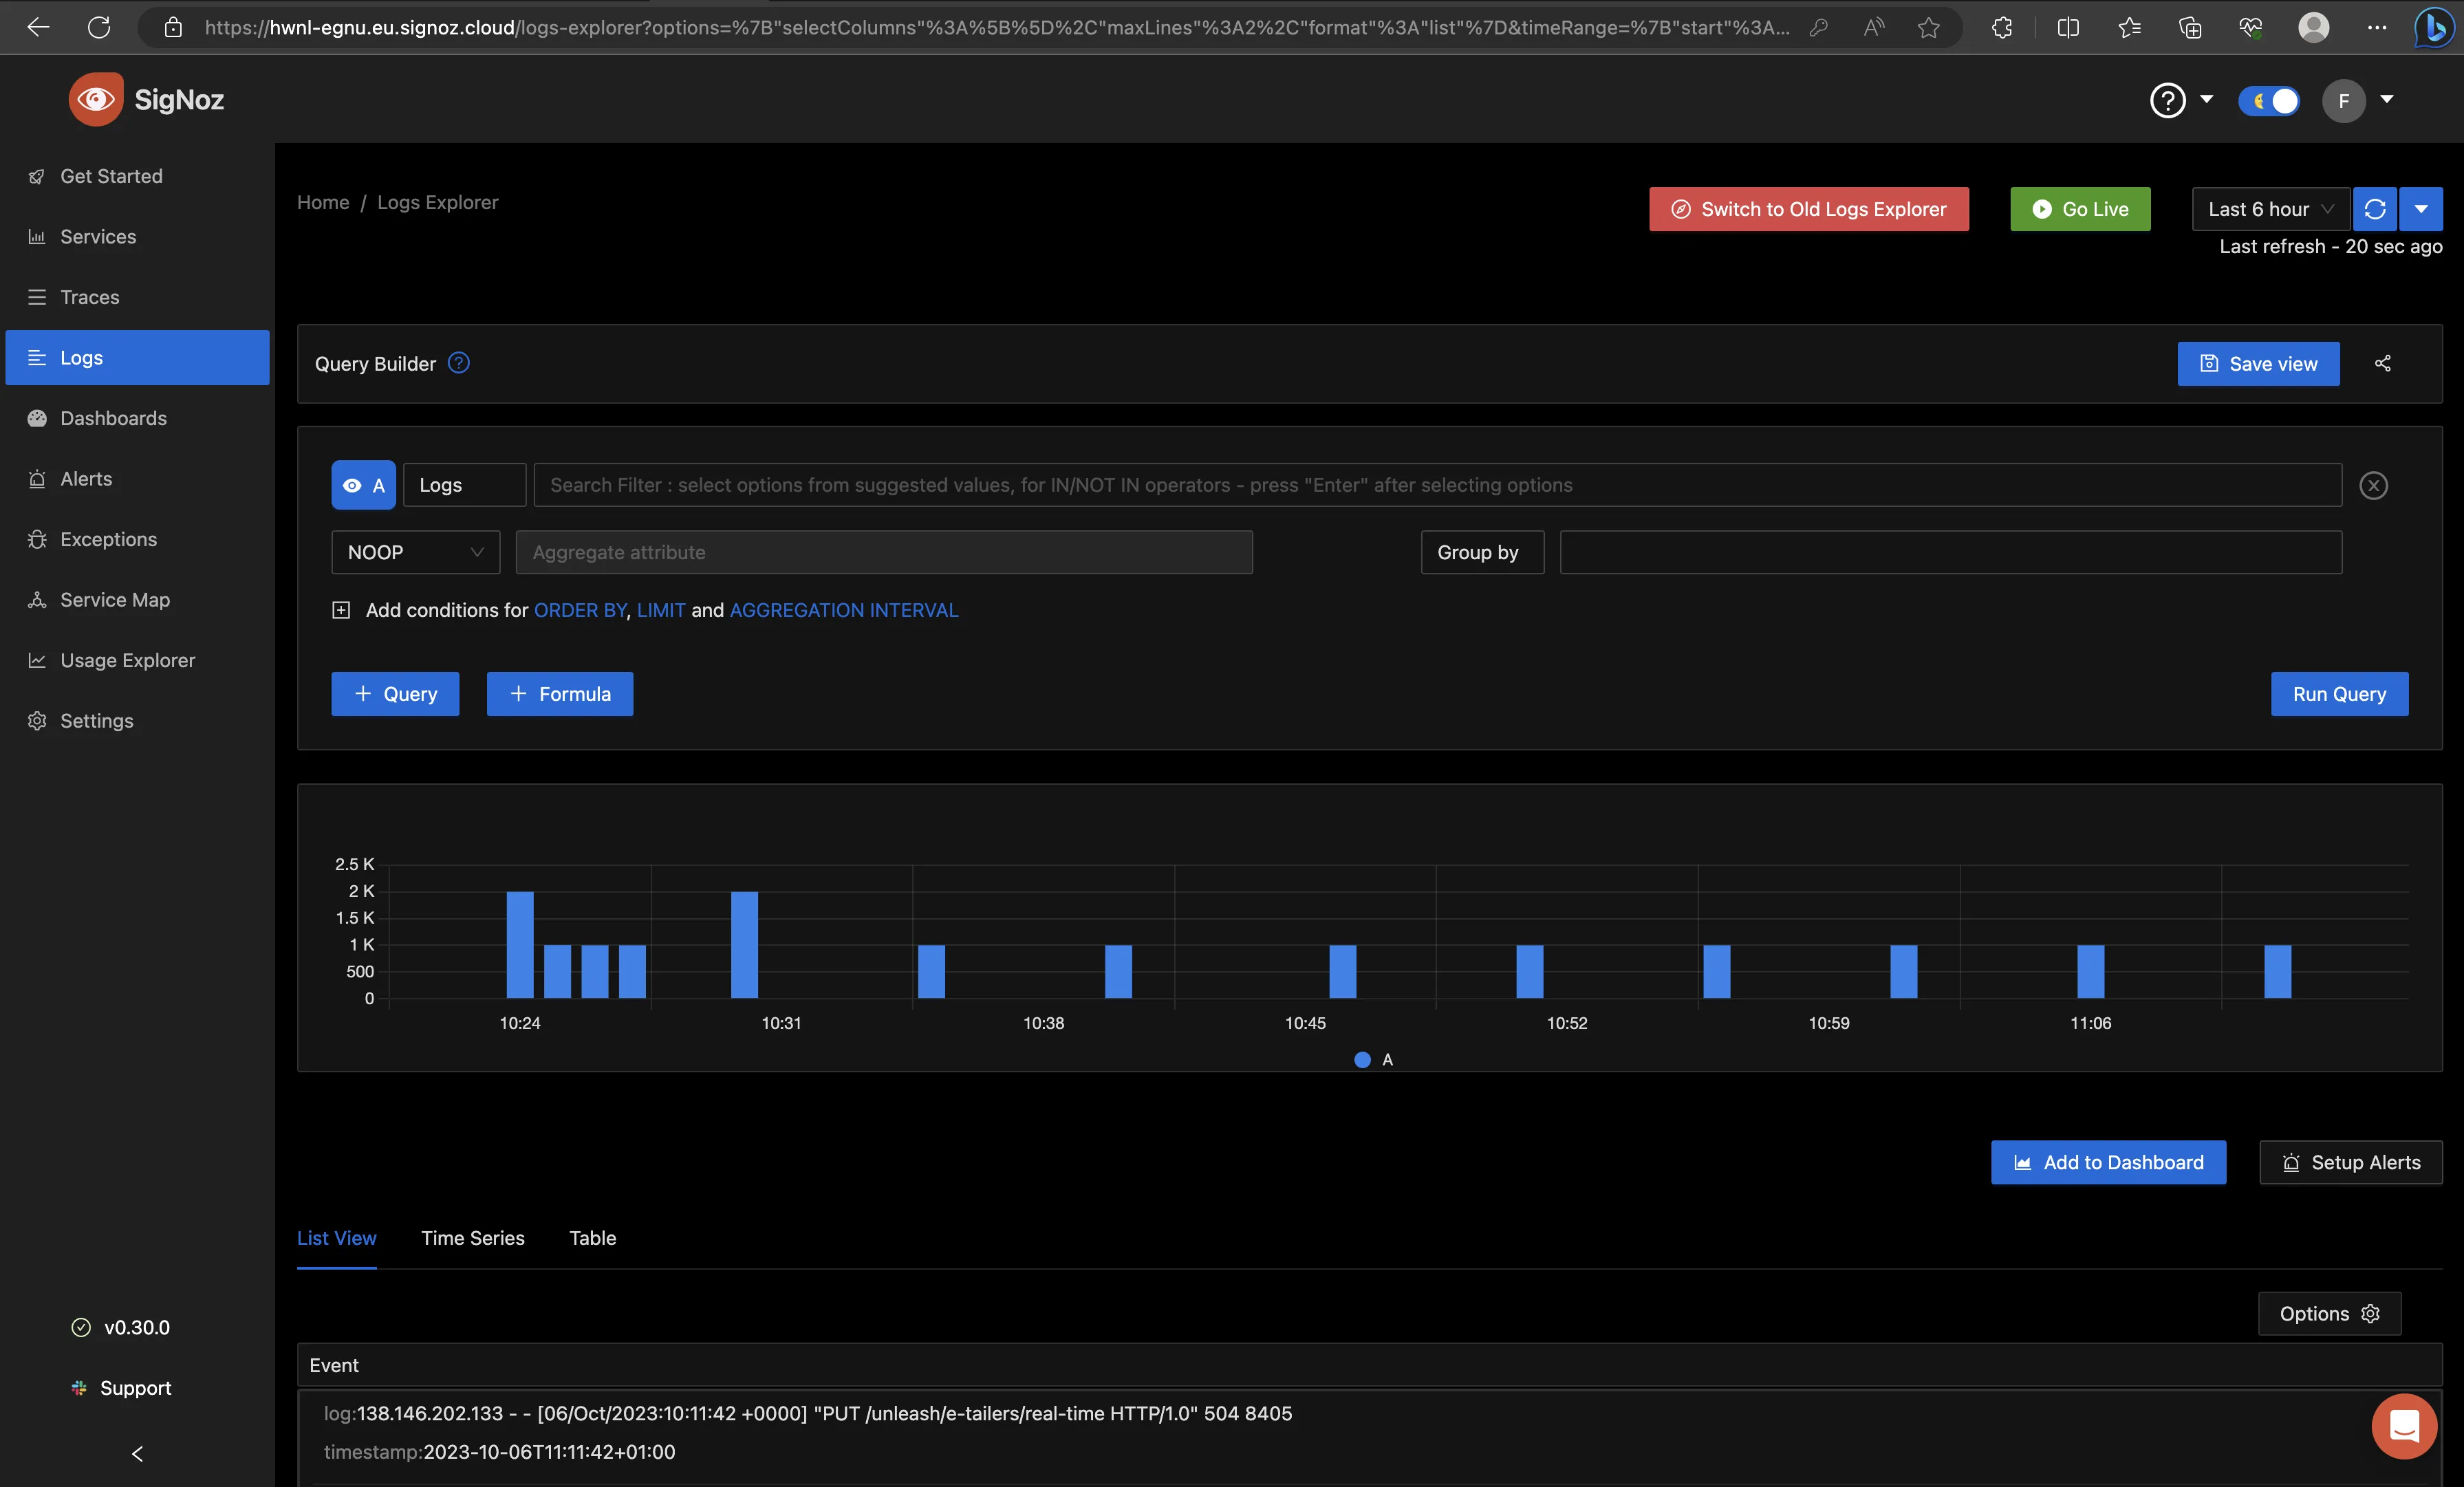
By default, the time duration set for the logs to be displayed is 6 hours. If you haven’t had logs generated for that long, you can set this yourself to any time of your choice from the drop-down, as shown below.

Setting the time to “Last 15 min”, you can see the logs generated over that time in the same bar chart format.
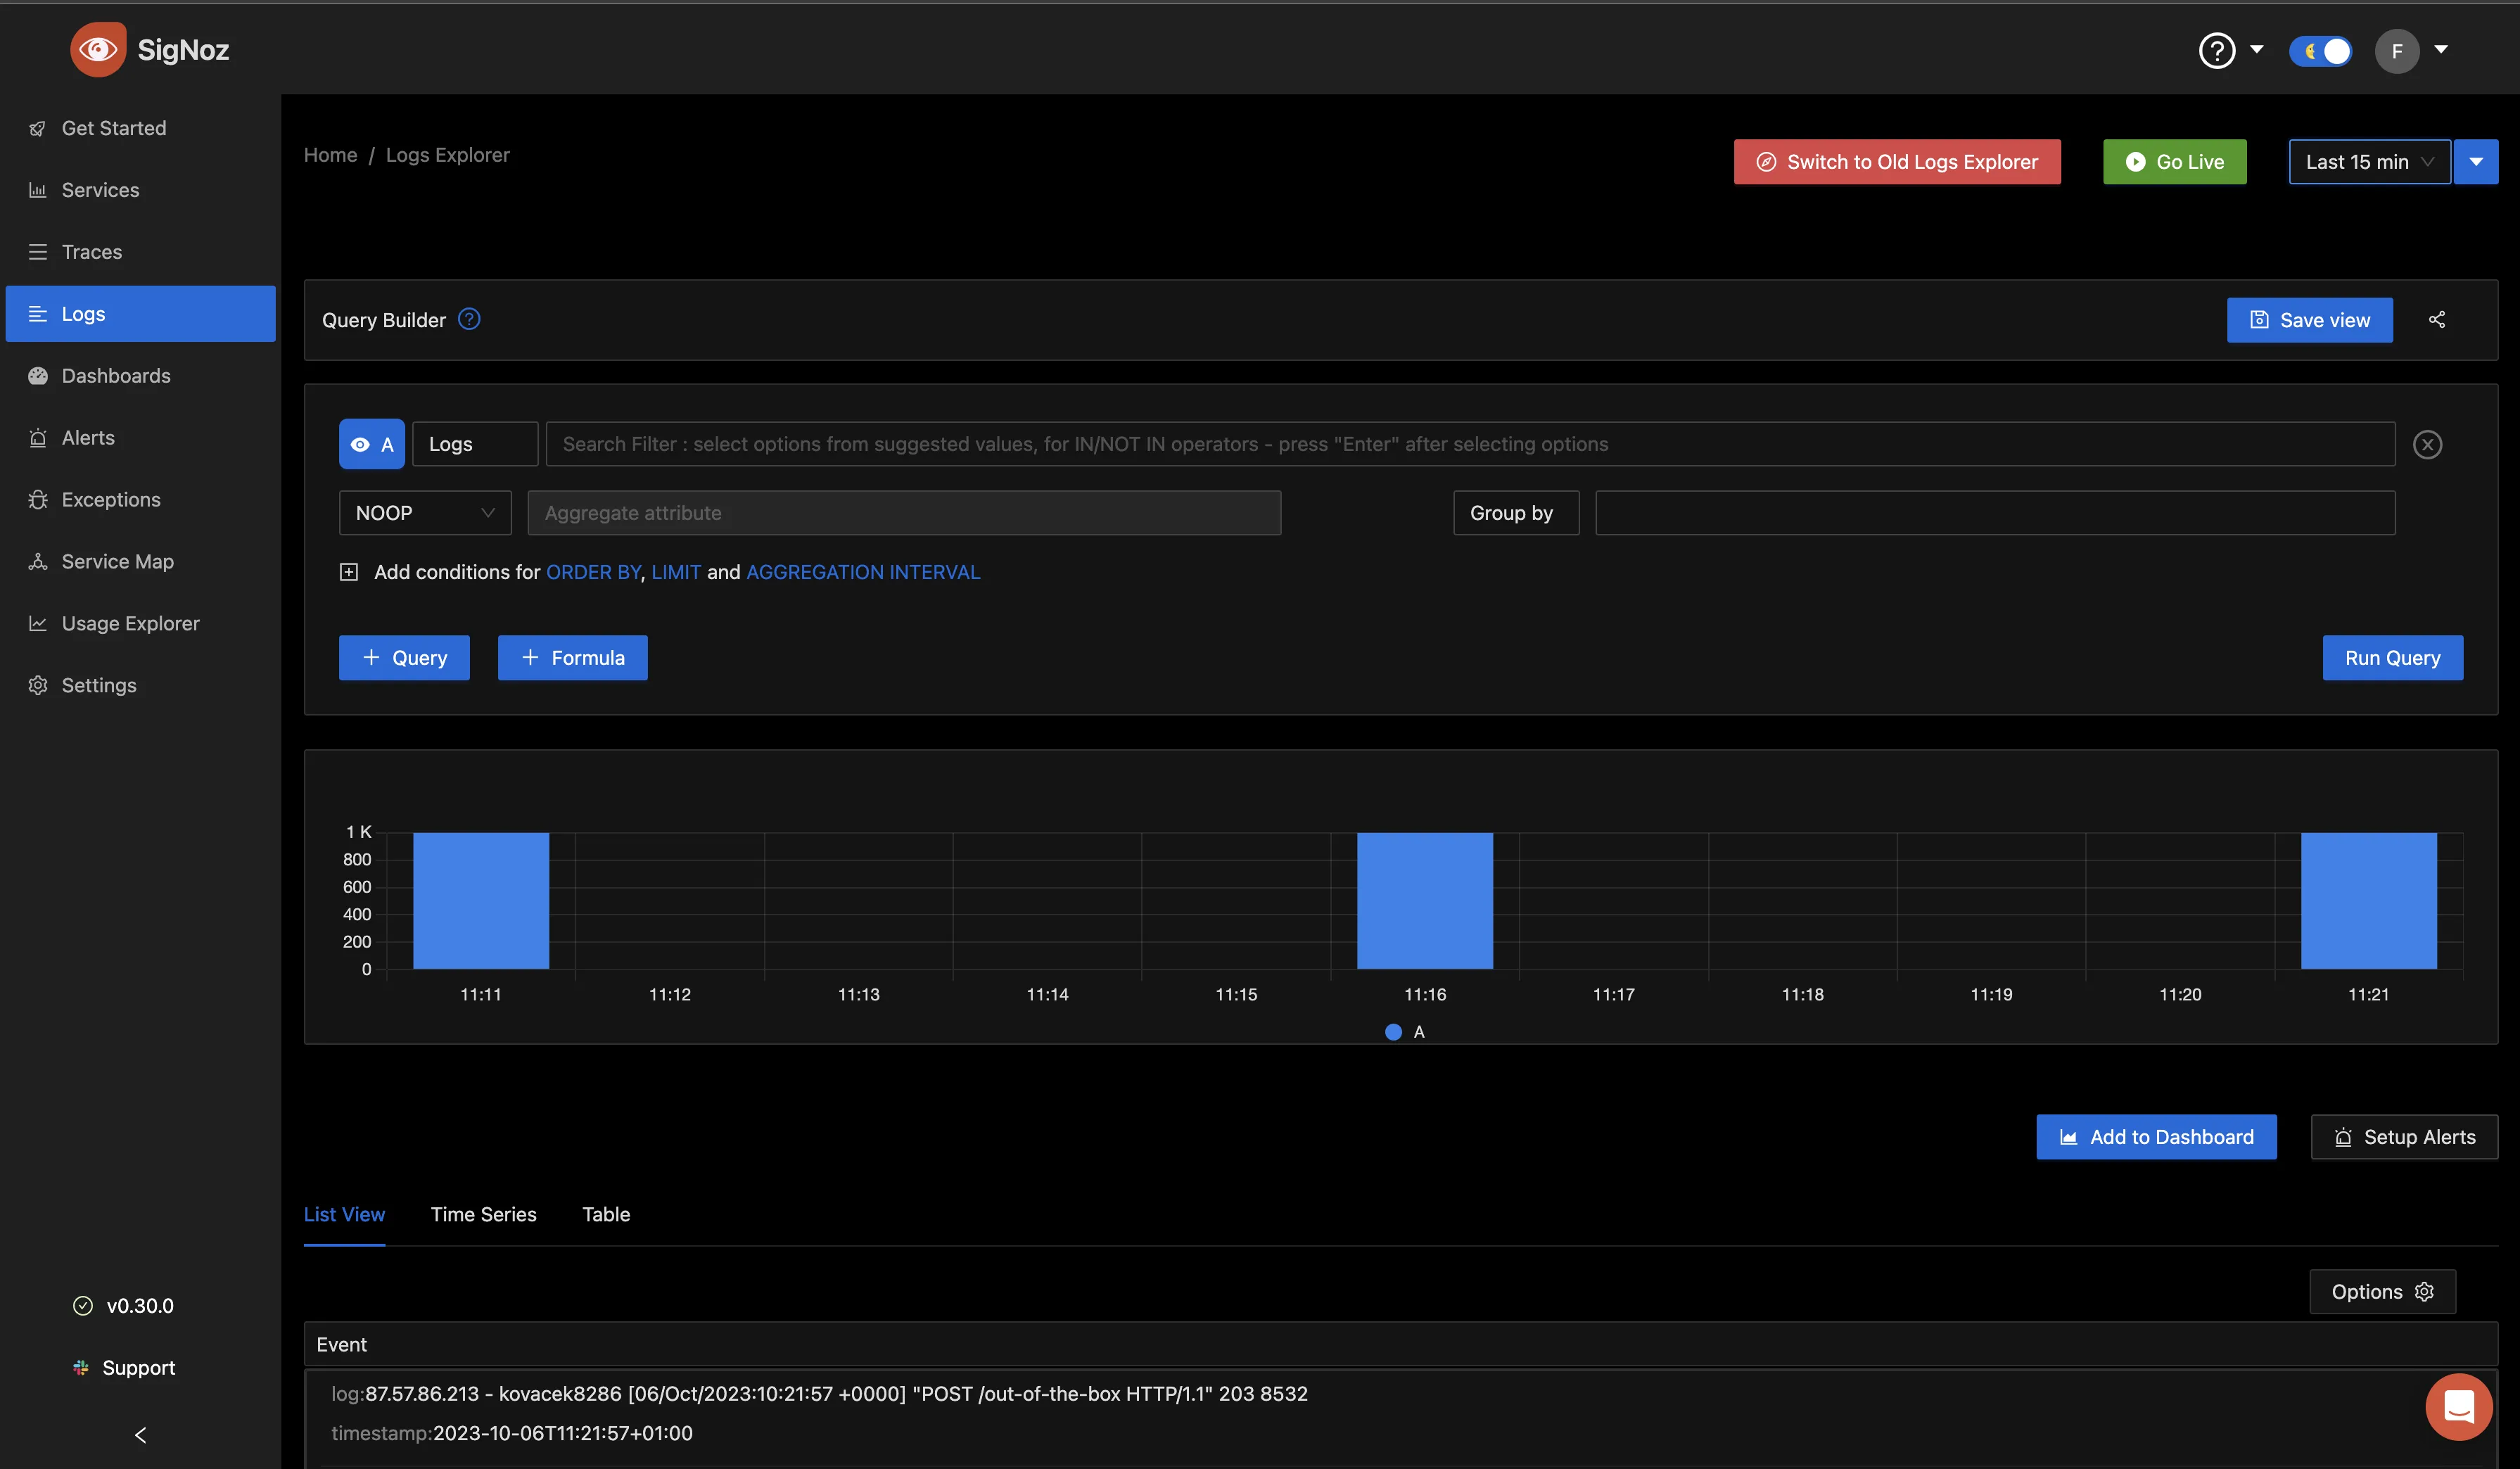
Scrolling down, we can see a “List View,” “Time Series” and “Table” tab.
The “List View” shows the pod events that happened in a list format.
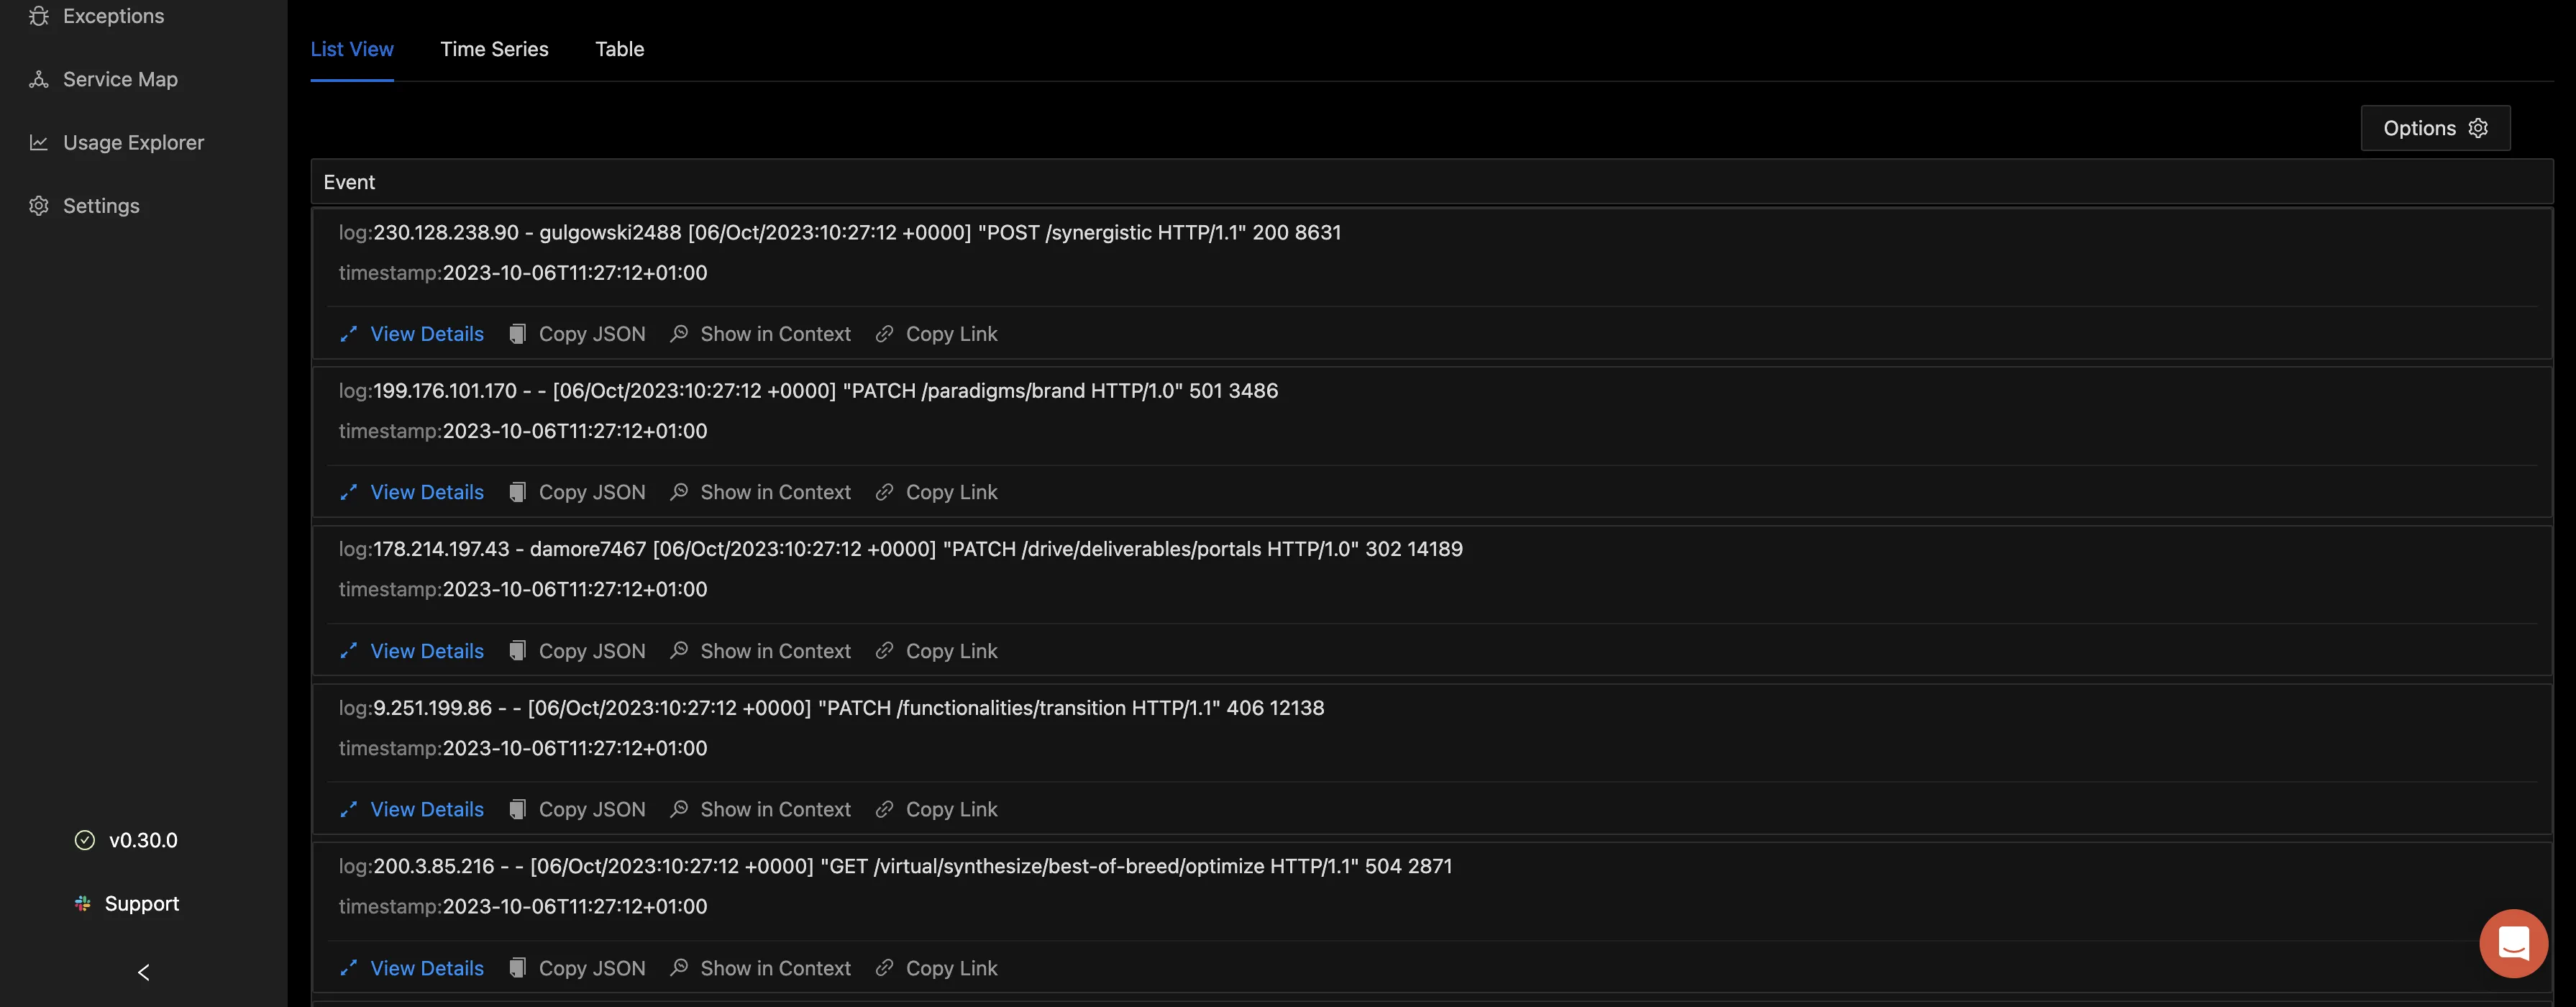
Selecting “View Details” gives you more information on that particular log entry in a table format. This can include the name of the cluster where it was generated from, the container name, the namespace, the log file path, the time, the pod name, the pod start time, and so much more.
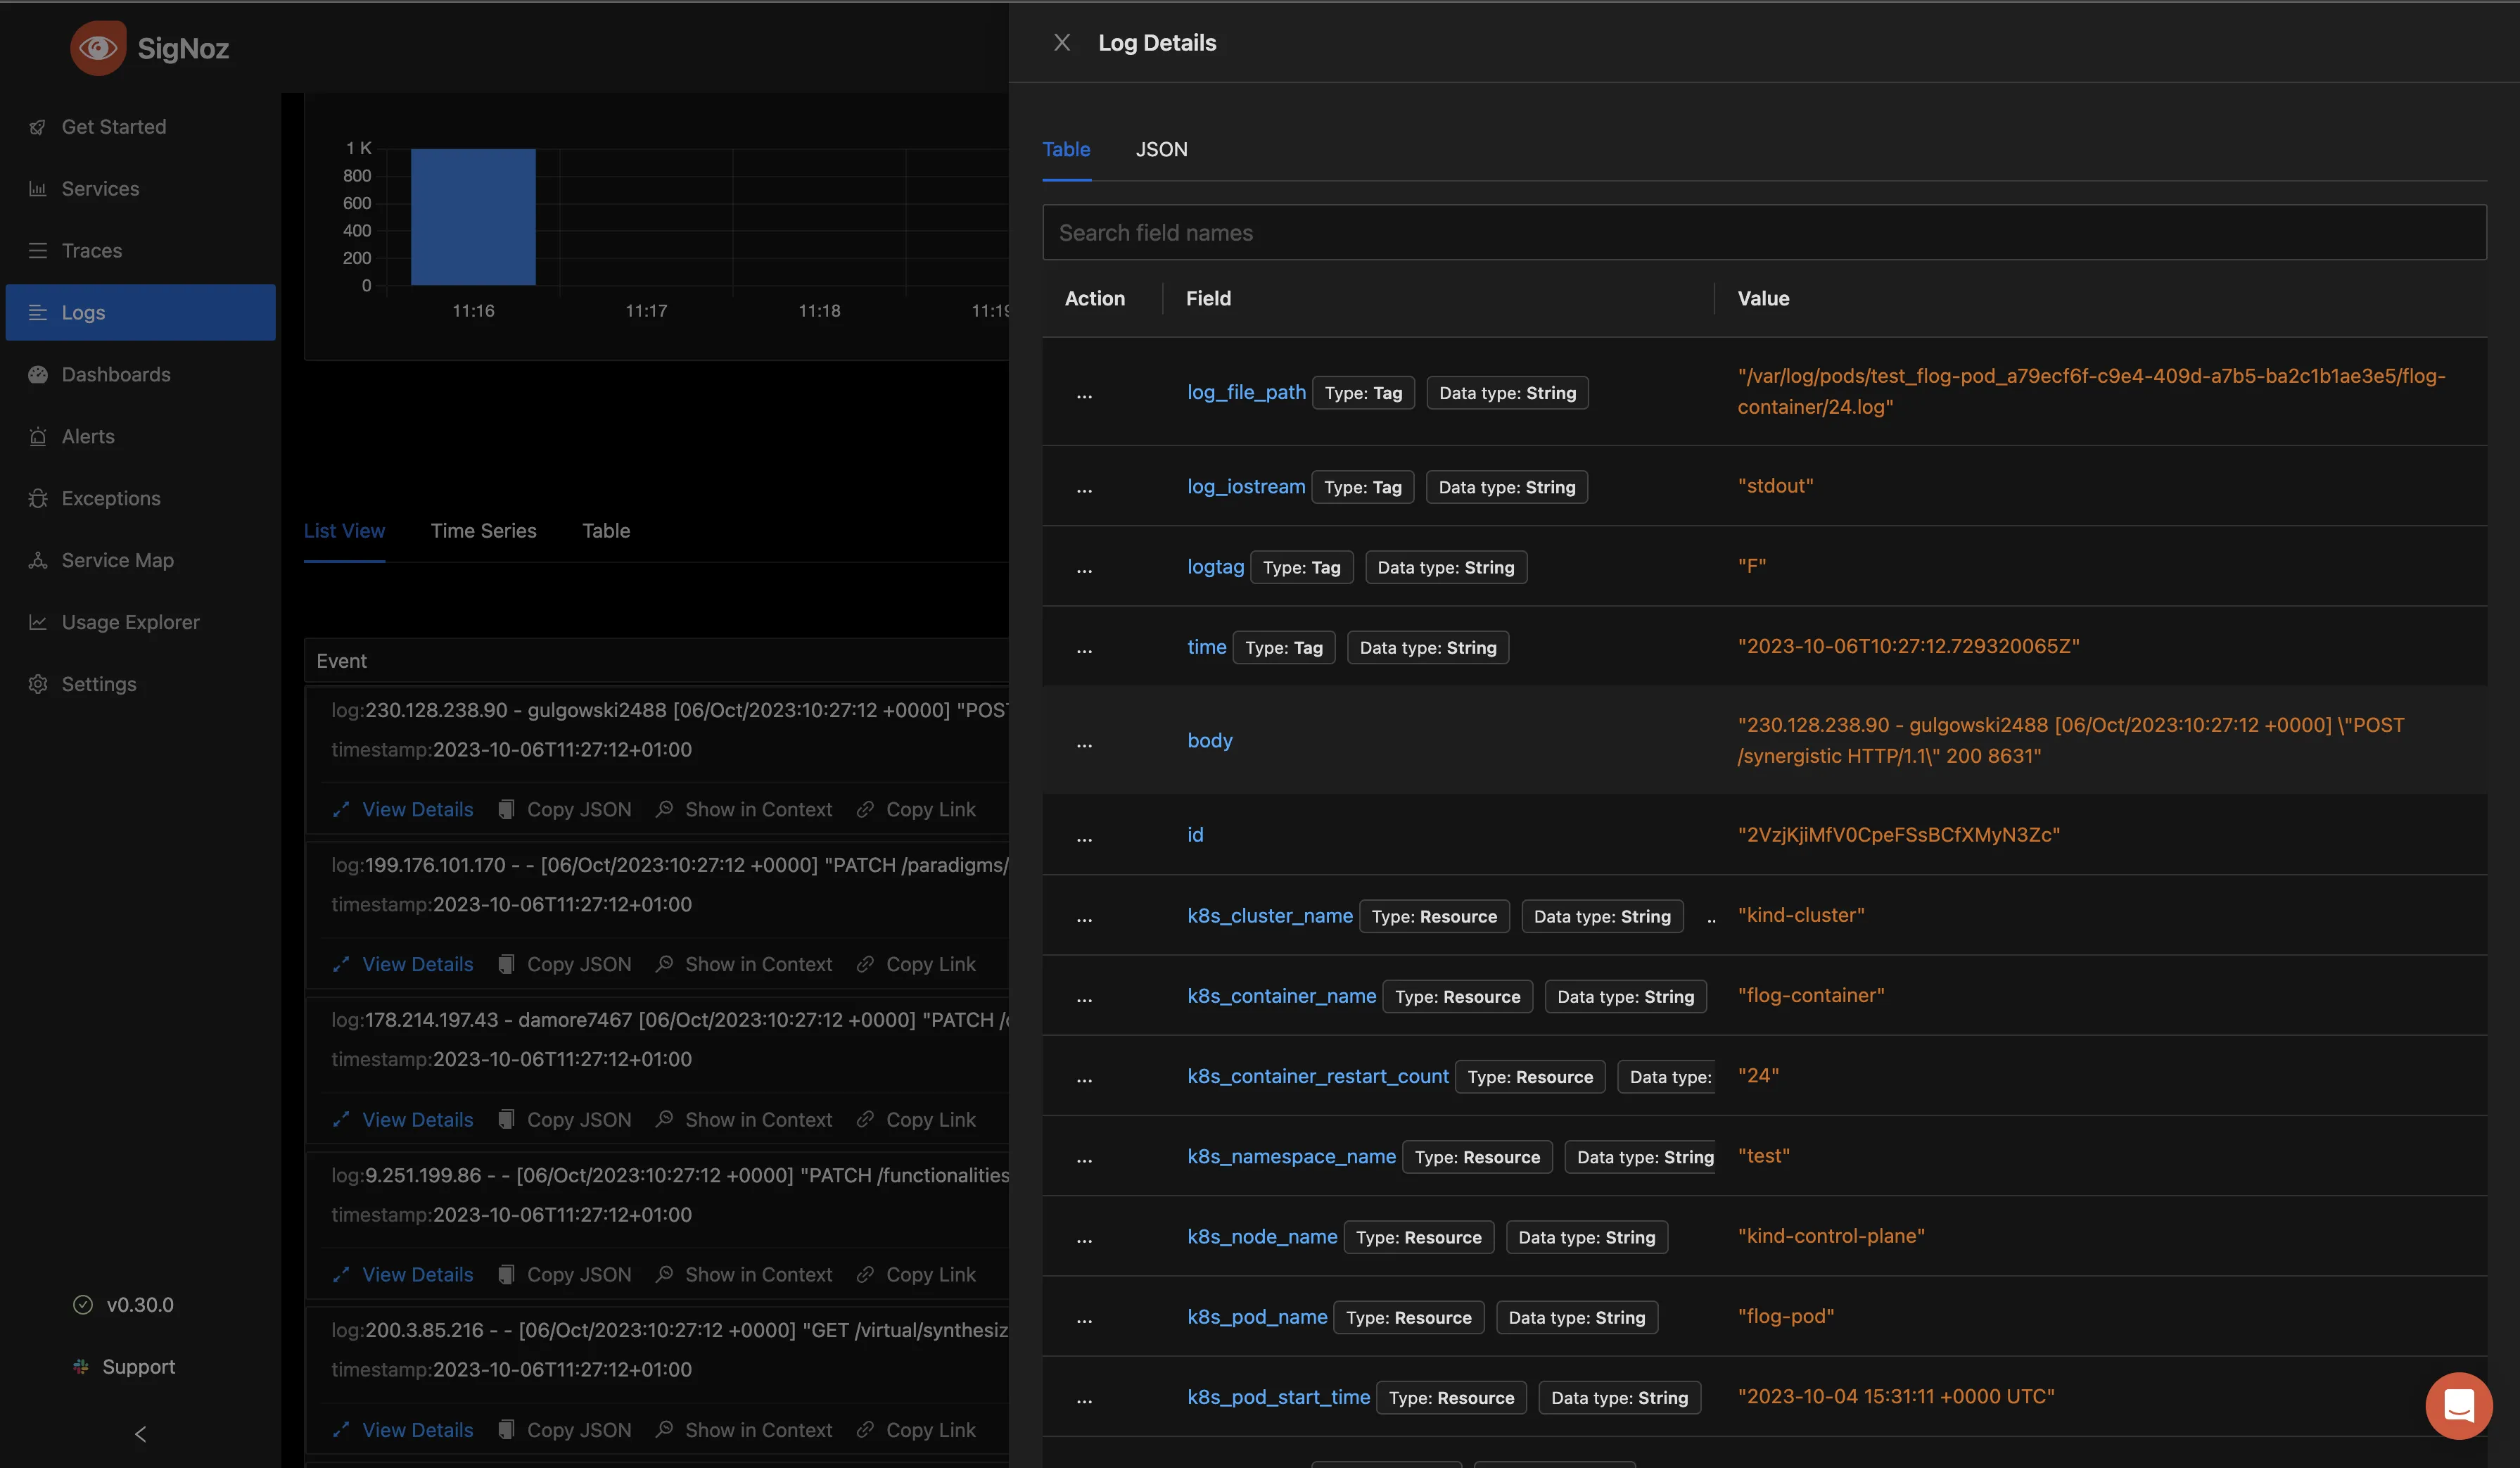
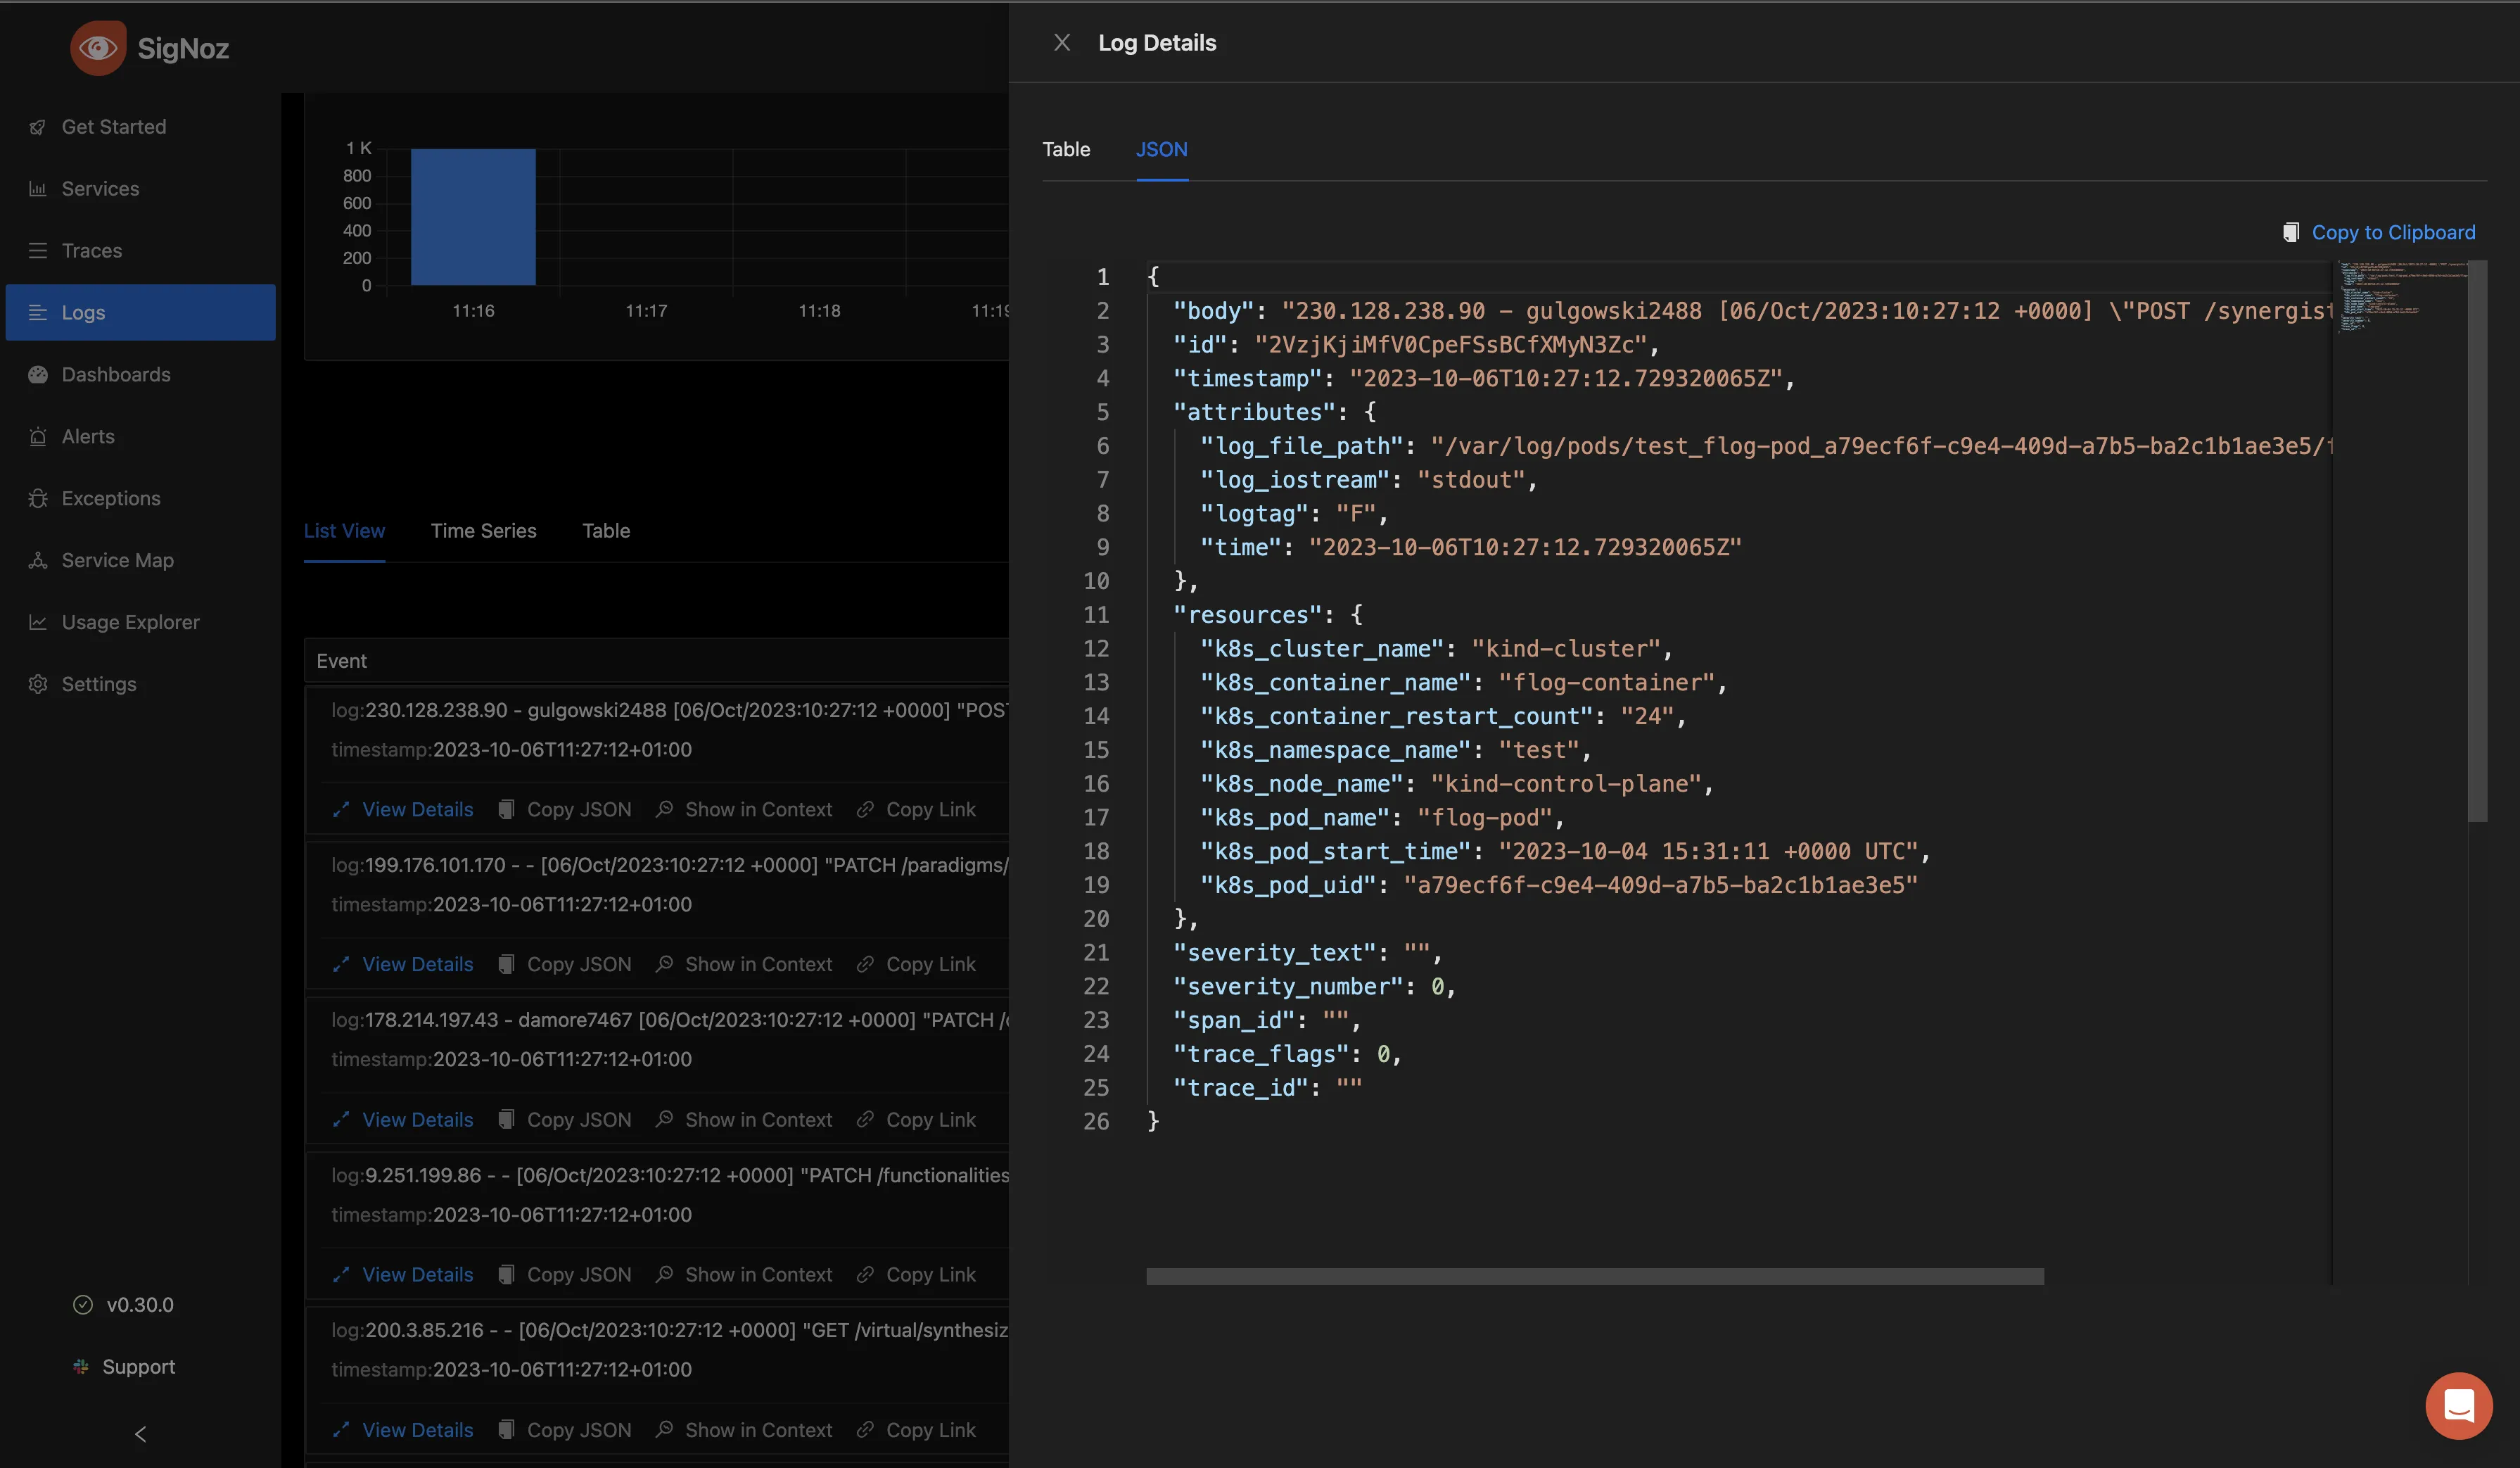
You can also choose to view the information in a JSON format by clicking on the JSON tab.
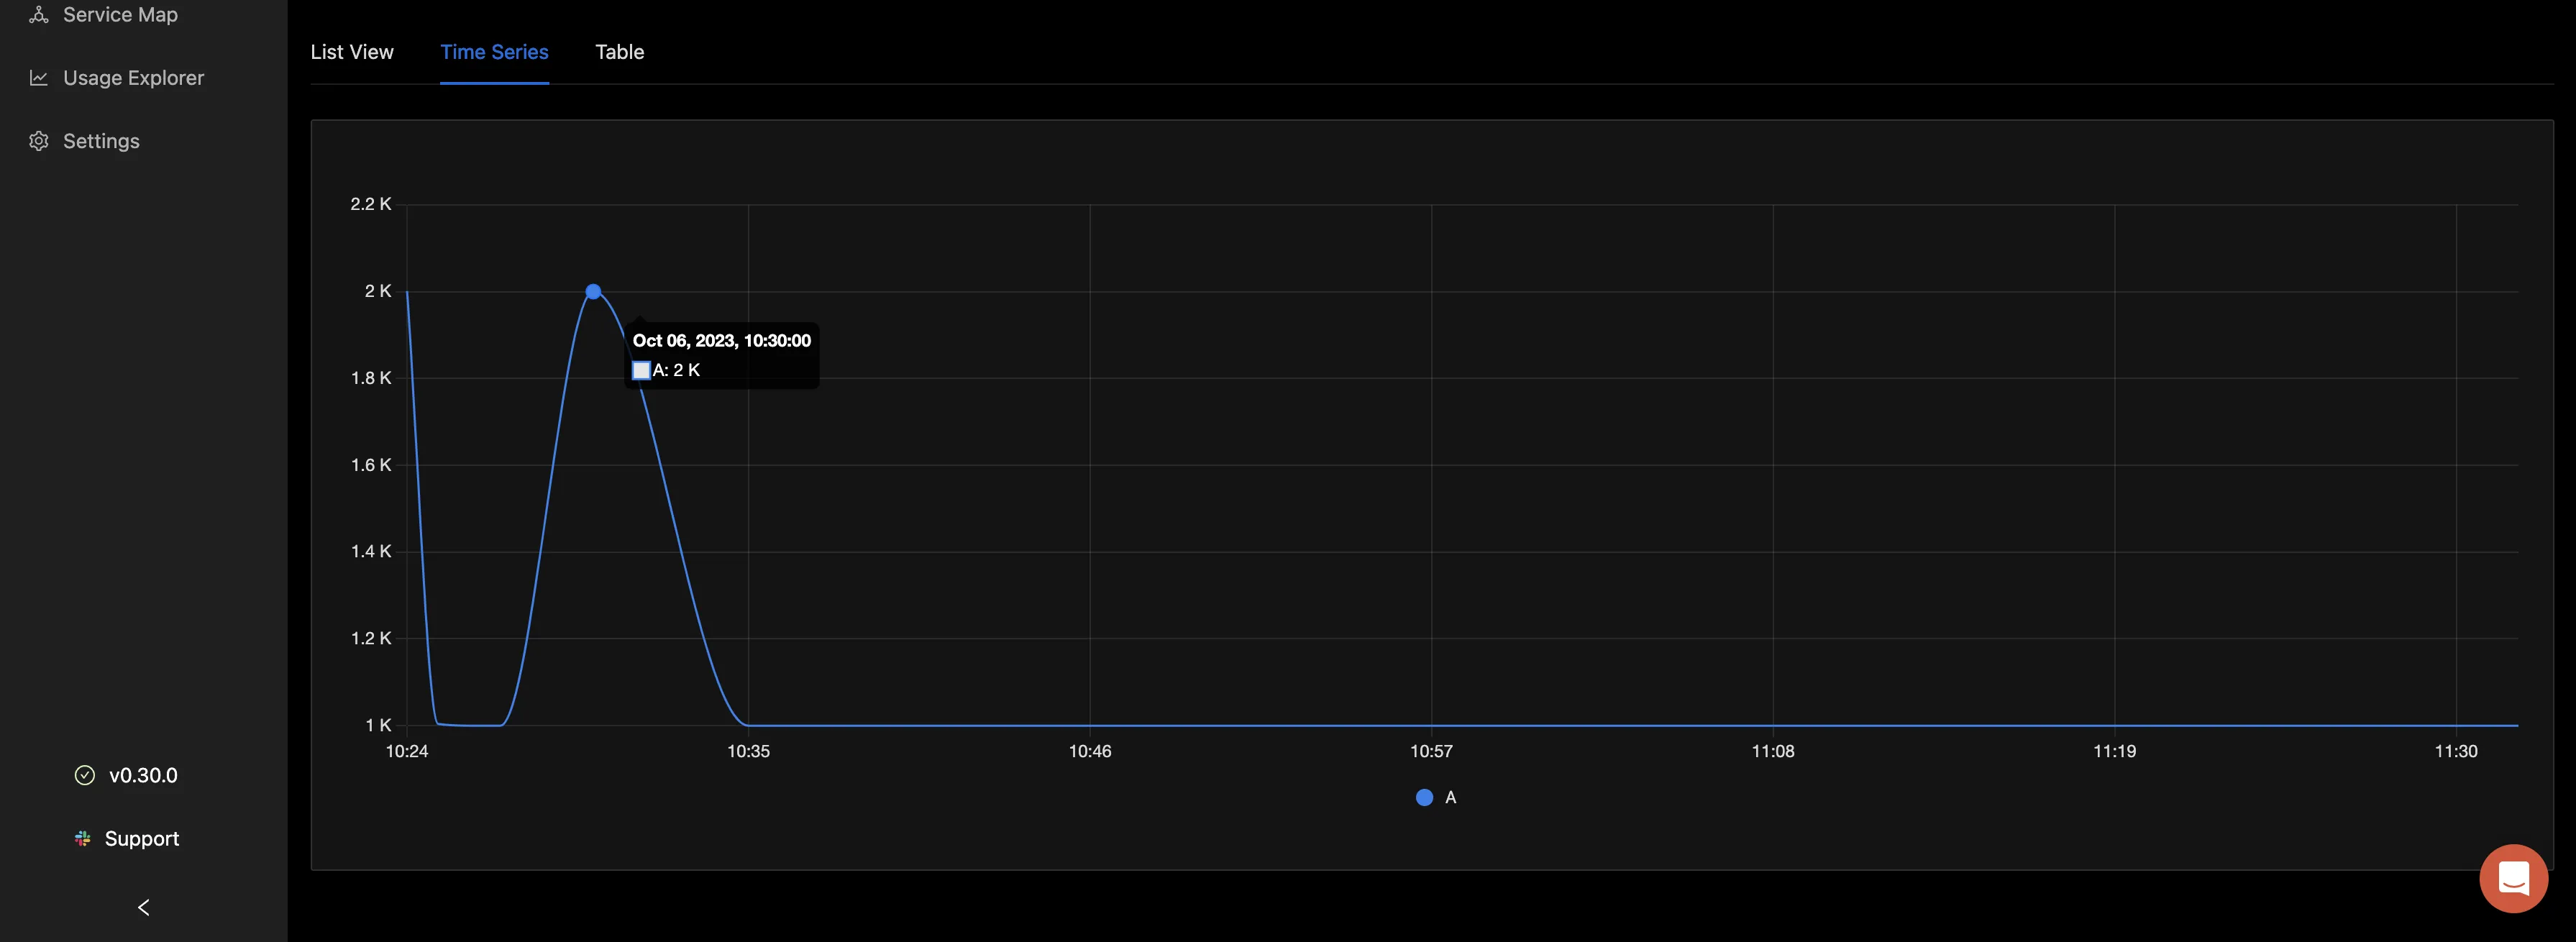
Navigating back to the Logs Explorer tab, select the “Time Series tab”, you can visualize your log data count in the form of charts.
The “Table” tab shows the count for the logs based on the filter you have applied in a tabular format.

Querying the Logs with the Query Builder
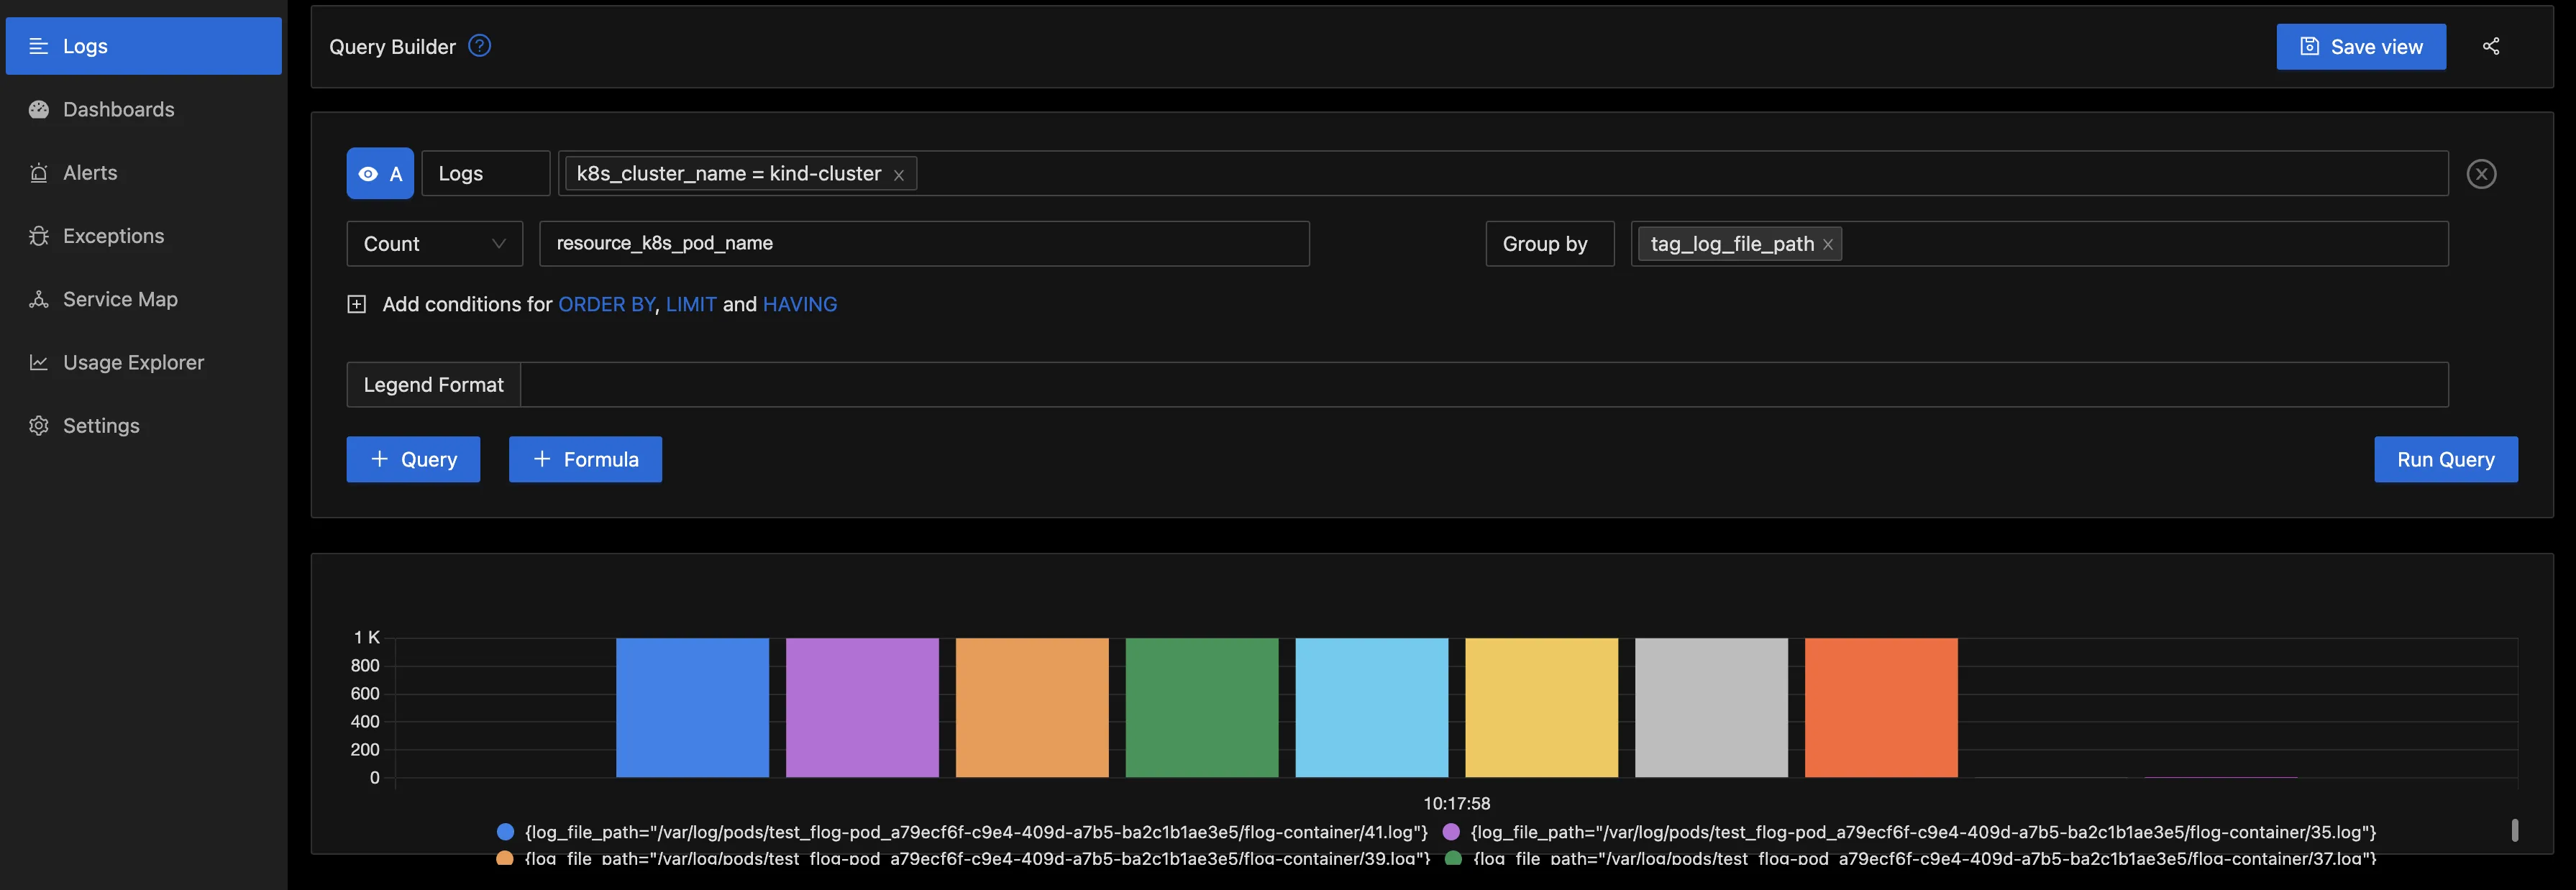
To gain deeper insights from the logs, you have the option to utilize the Query Builder. From the below image, a filter was applied for k8s_cluster_name = kind-cluster. This filter specifically refines the log data to display entries exclusively related to a designated Kubernetes cluster named "kind-cluster.” This is particularly valuable in extensive environments where multiple clusters are in operation, as it allows for a focused examination of a particular cluster's logs.
Next, the aggregate function was configured to "Count,” with the aggregate attribute set as resource_k8s_pod_name. This selection signifies an intent to aggregate the log data by tallying the occurrences of each unique value within the resource_k8s_pod_name field. As a result, you'll obtain a count reflecting how frequently each individual pod (within the selected Kubernetes cluster) has generated log entries.
There are other aggregate functions that can be used when you click on the drop down.
Following this, the logs were grouped by tag_log_file_path. This helps to group the logs based on the file paths they originated from.
With all these parameters in place, the query was executed to retrieve the desired insights from the logs.
Below is the “Table” column, which shows the log file path and the count for the pod.
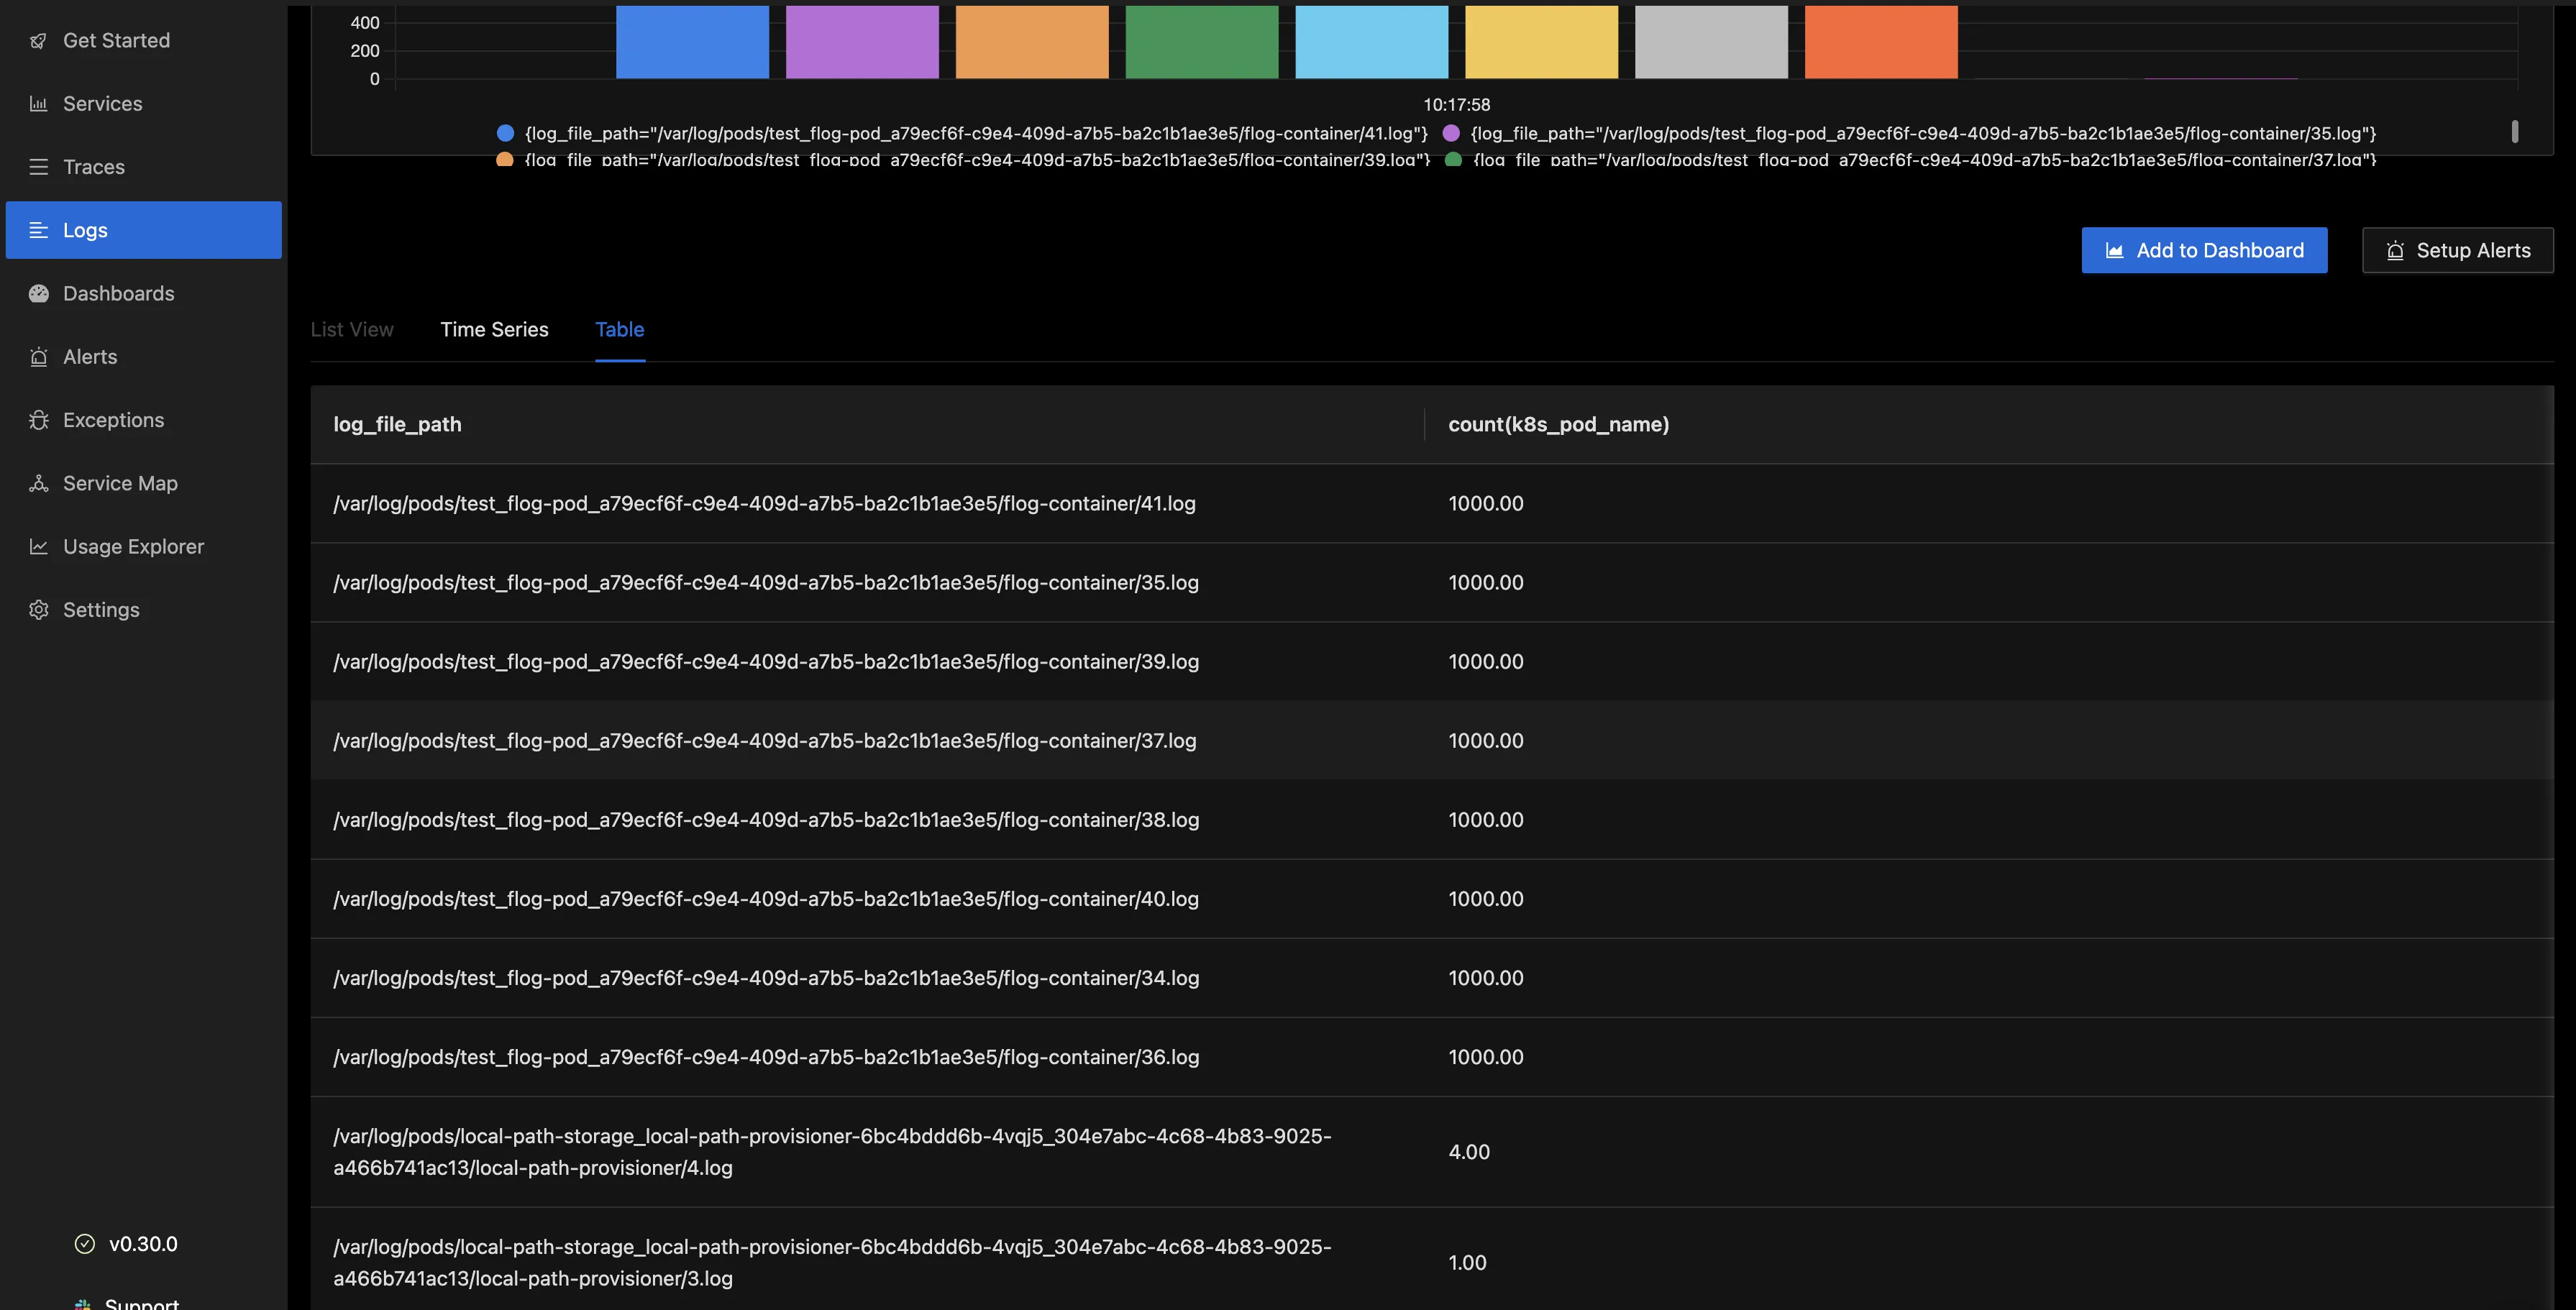
This type of analysis can be very helpful for troubleshooting and monitoring the behavior of applications within a Kubernetes environment. It allows you to identify which pods are generating the most logs and which log files are being accessed frequently.
The above is just an example of one of the queries that can be run with the query builder.
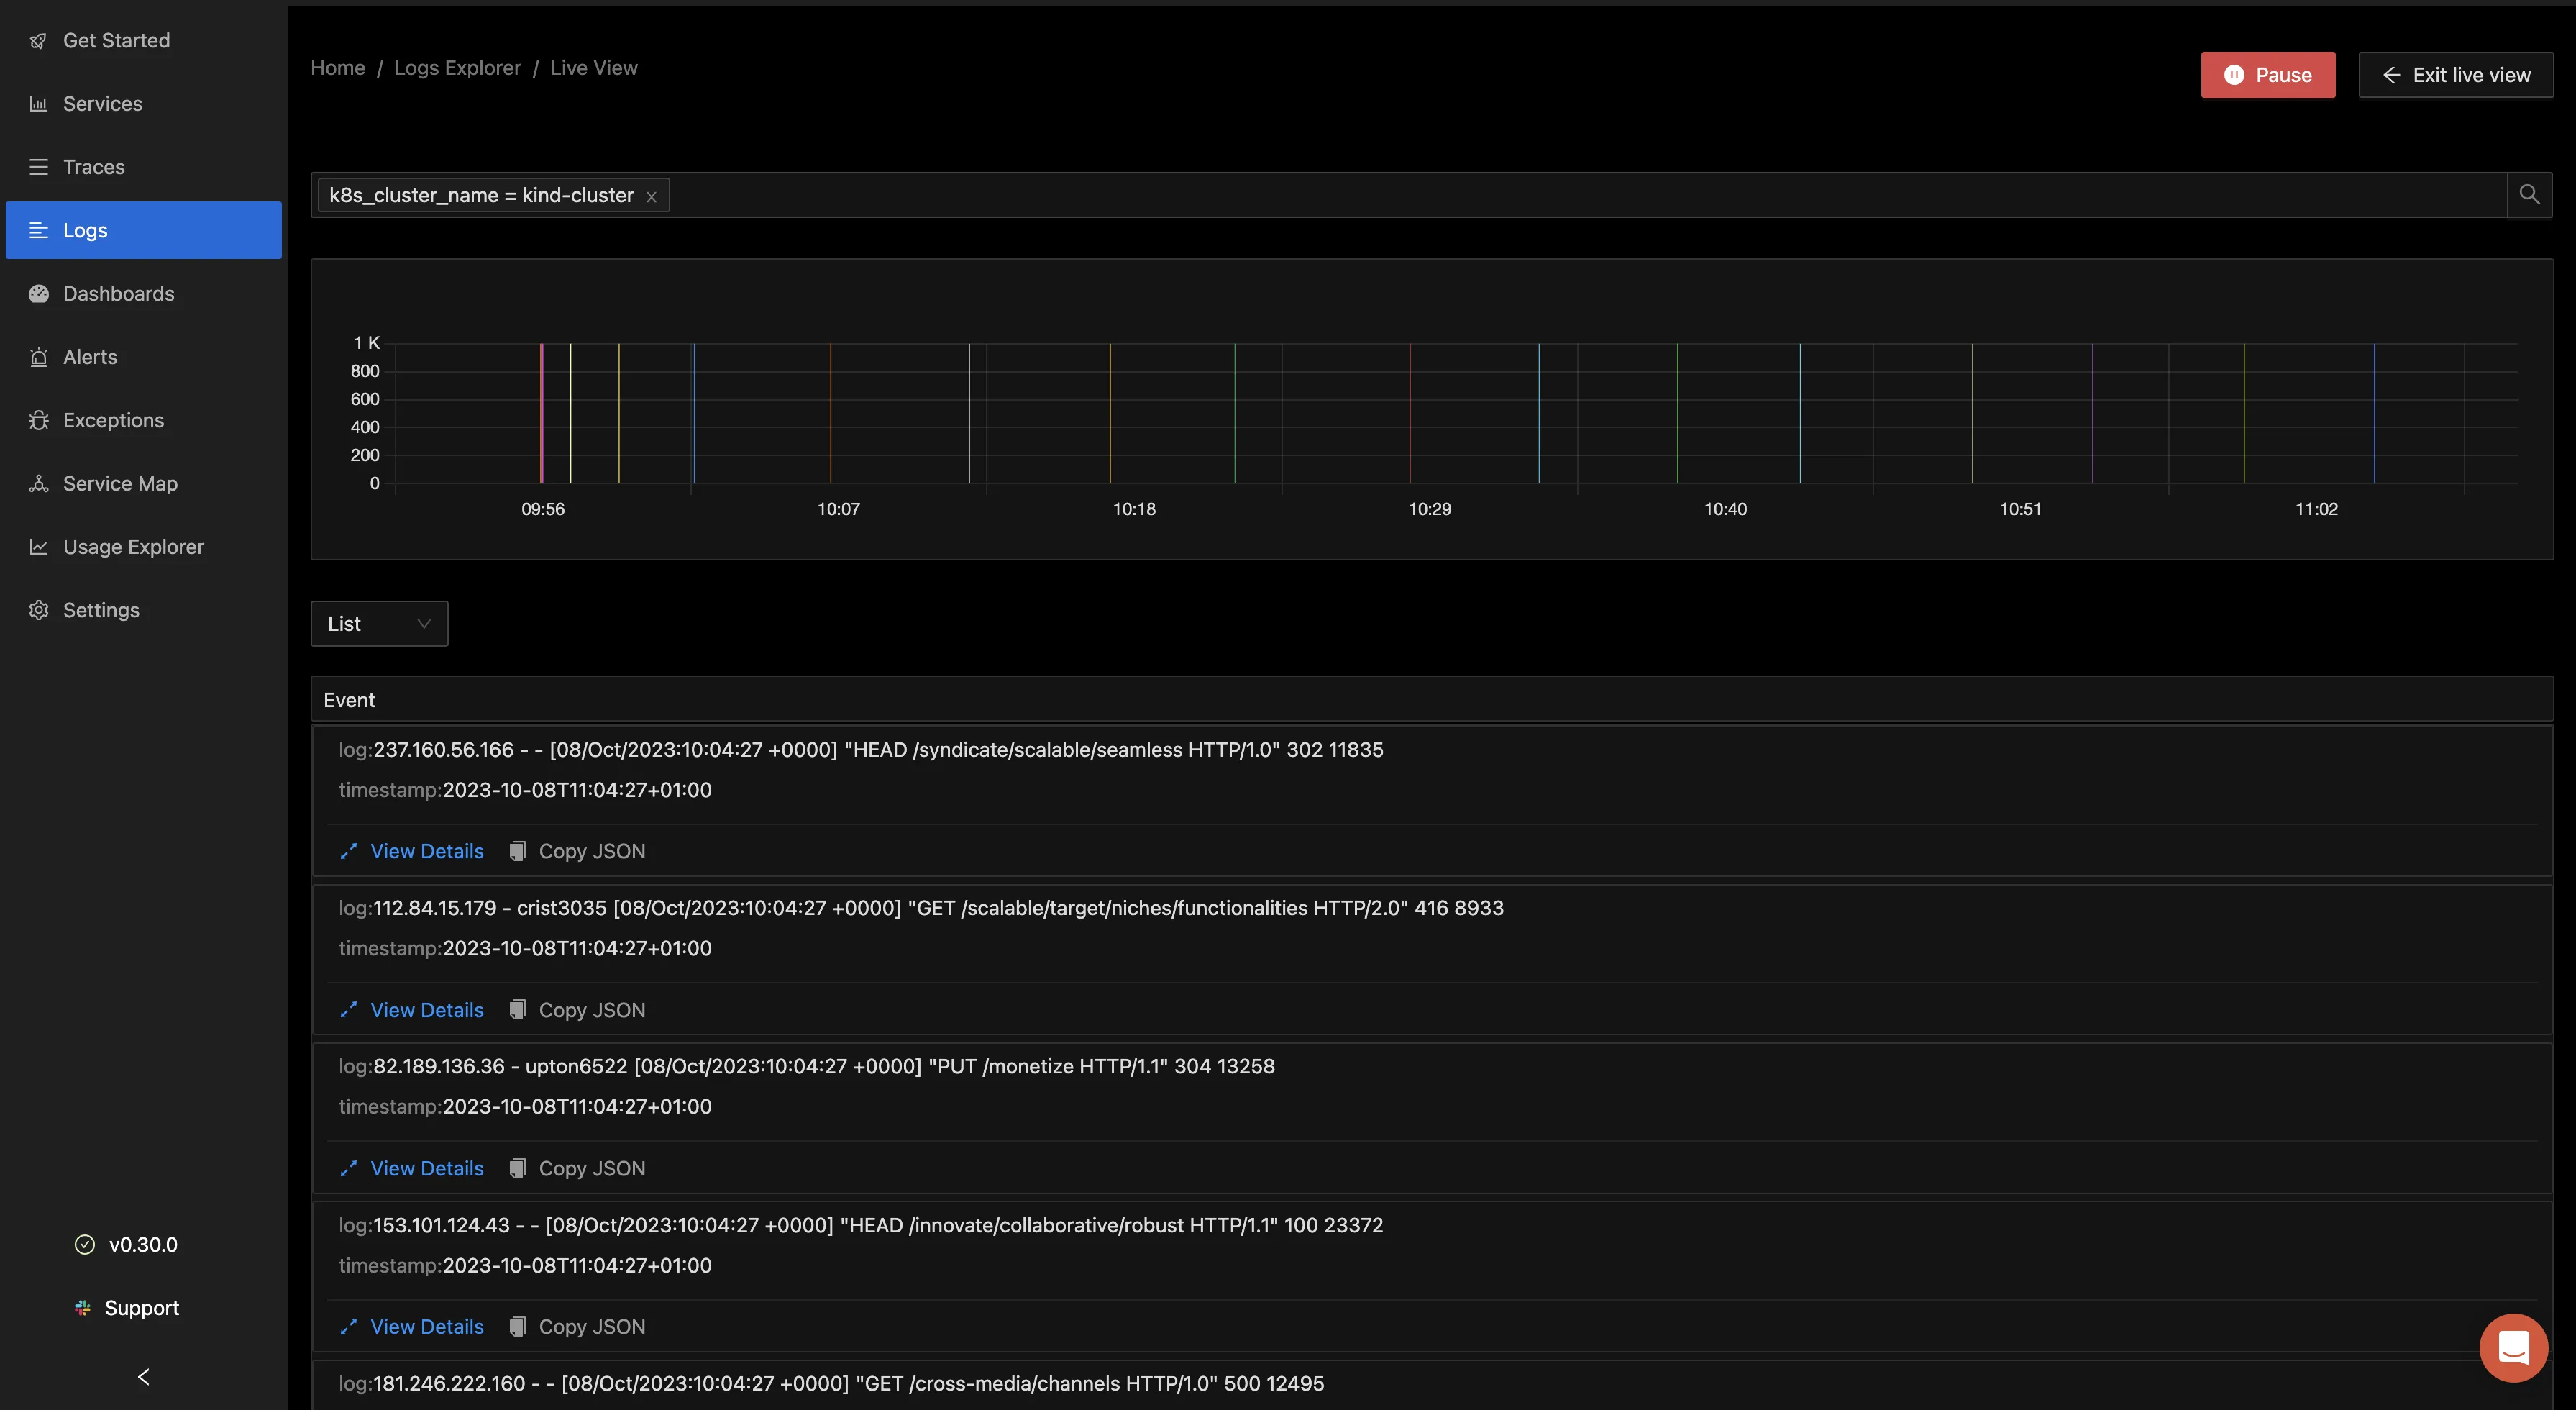
You can also select the “Go Live” button to livetail the logs as they are being generated from your pods.

This in turn shows you the live logs from your pod.
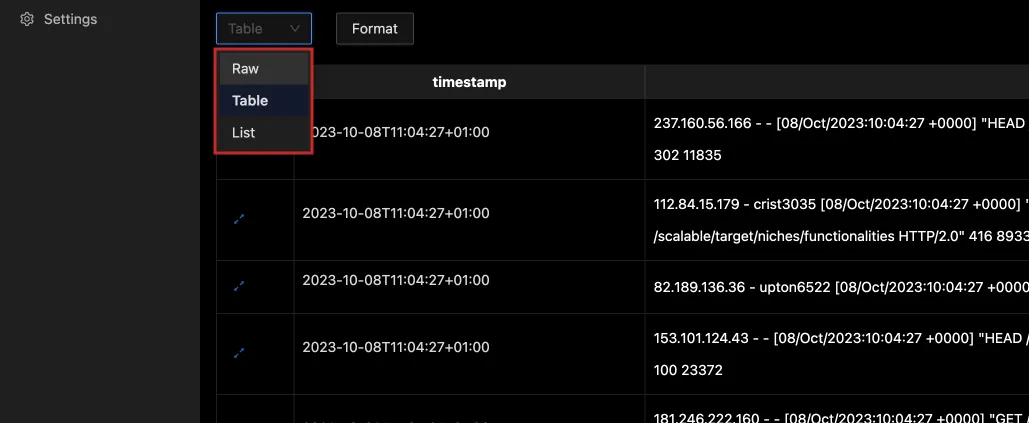
From the drop-down, you can select how you want the logs to be displayed, whether in a Raw, Table, or List format.
Dashboards
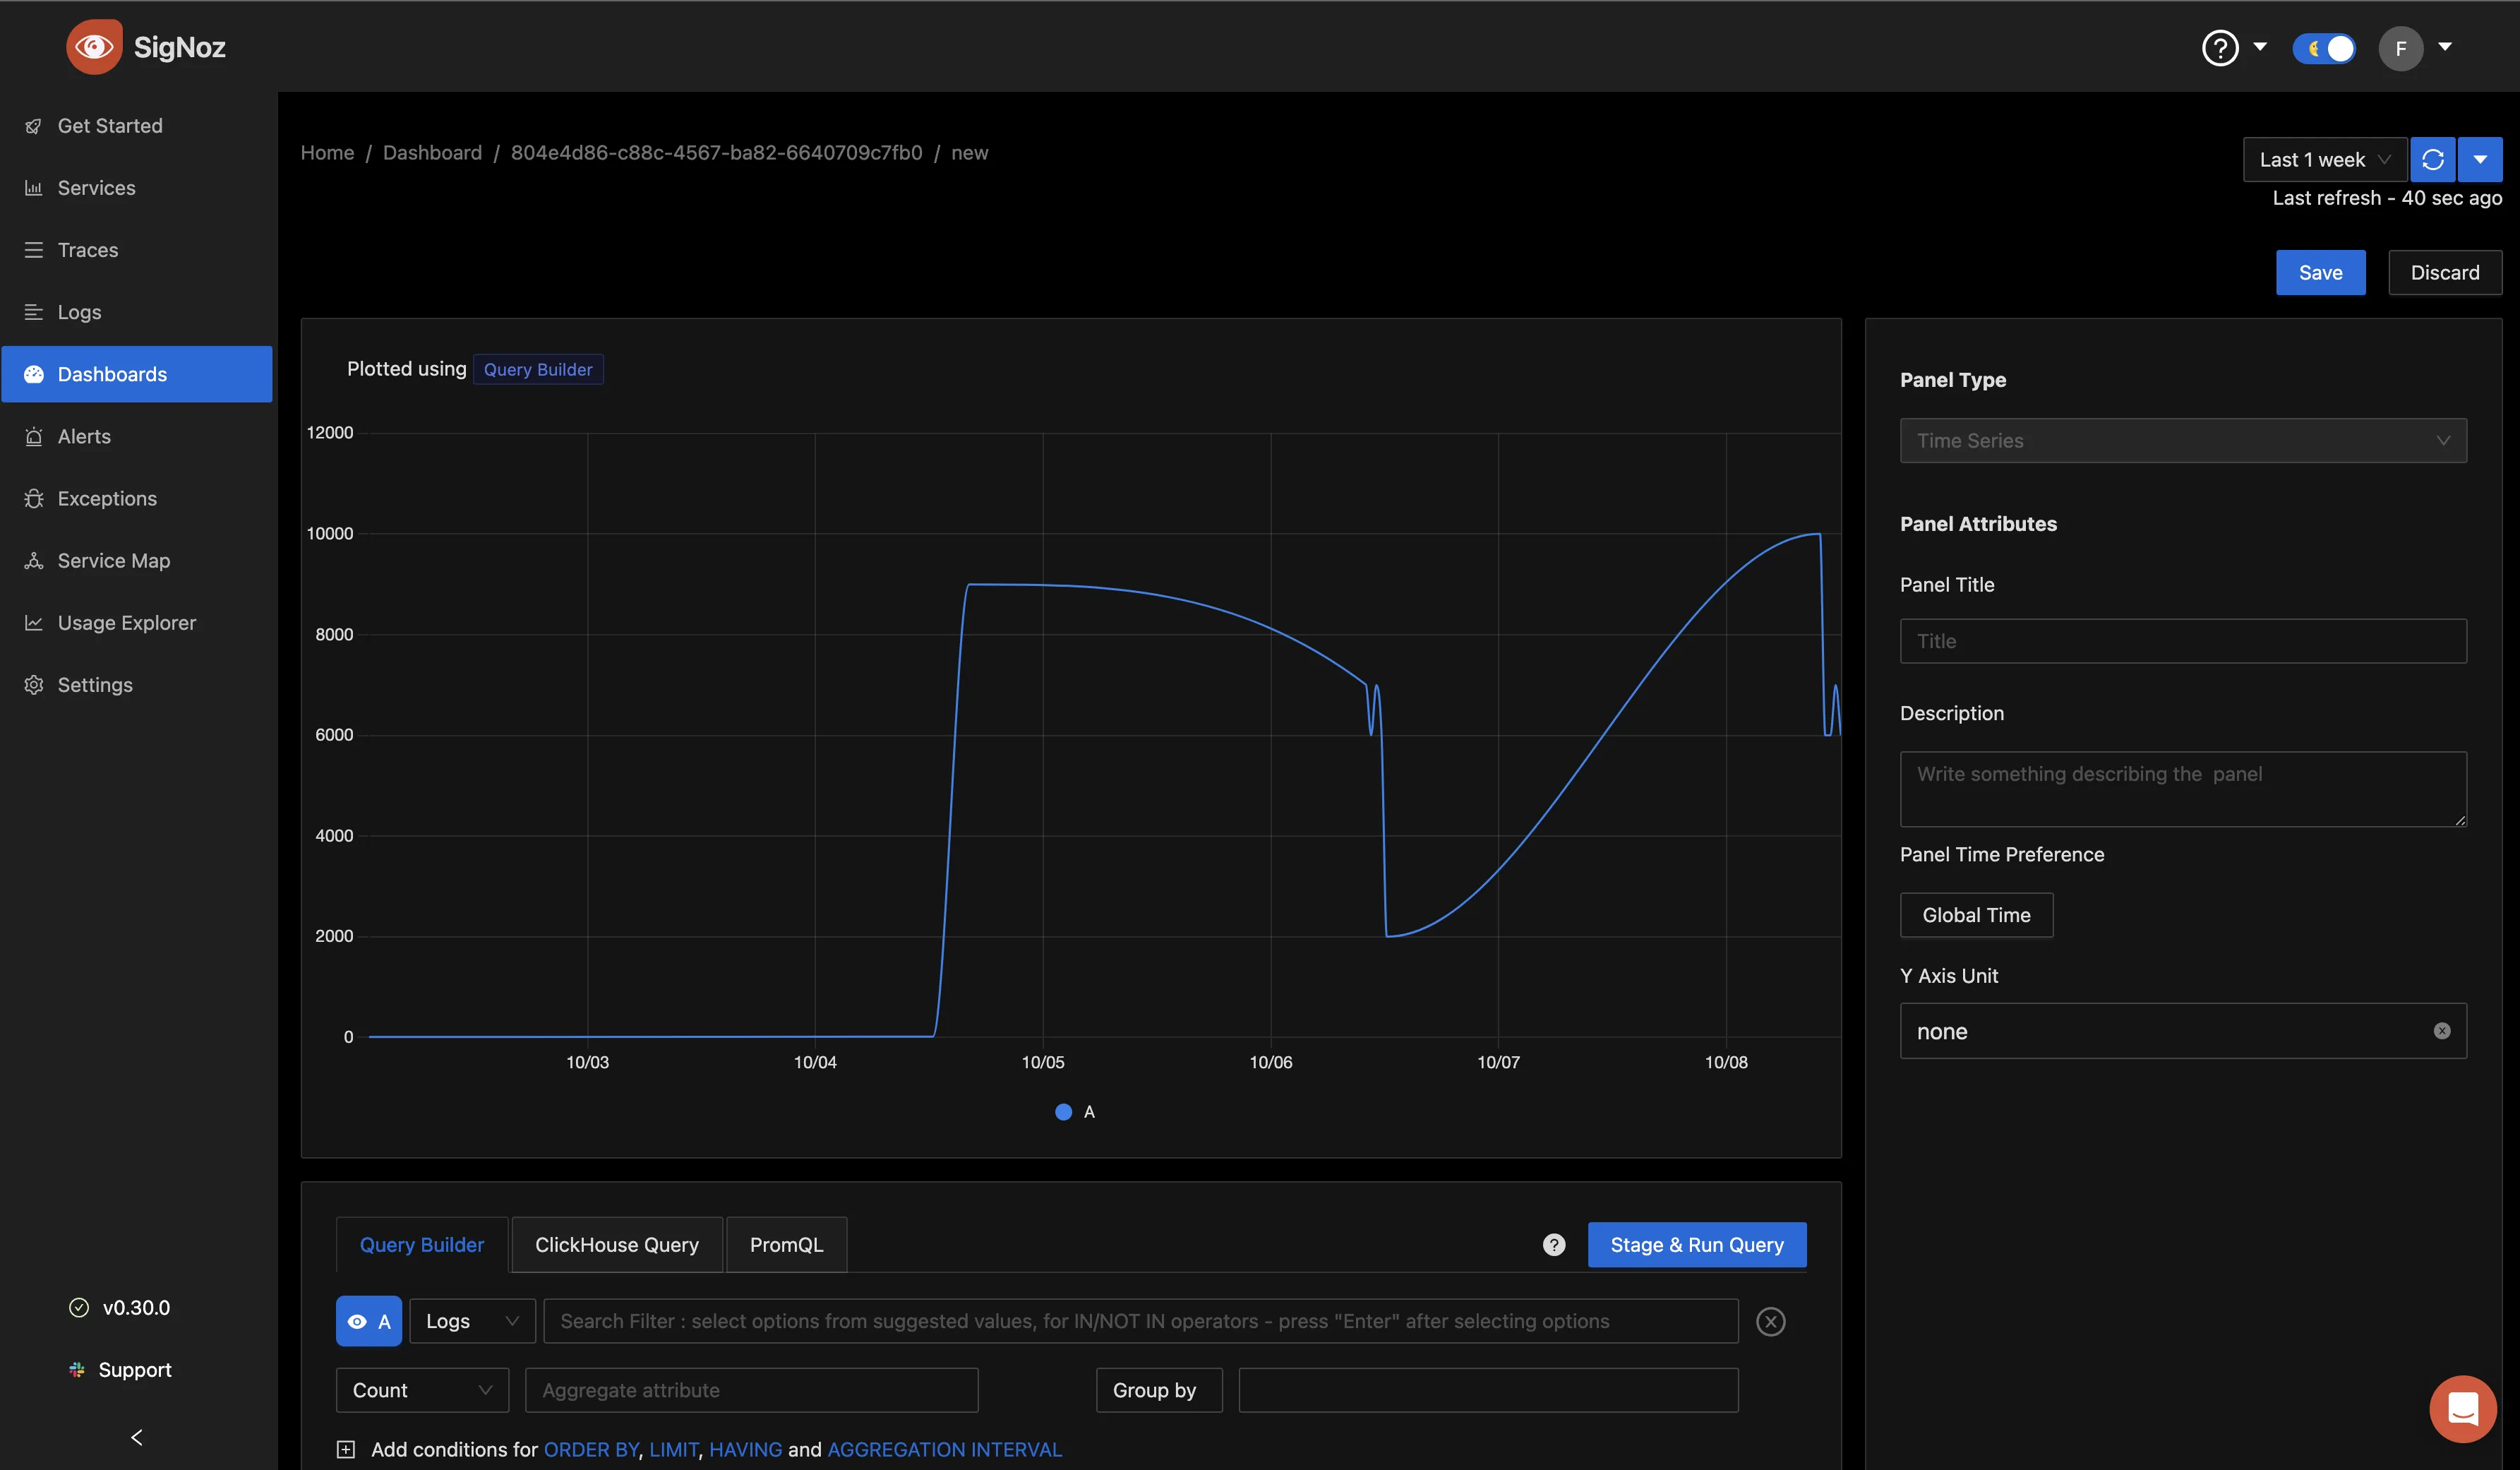
You can choose to add your logs to a dashboard for better monitoring. After the logs have been queried with the Query Builder, click the “Add to Dashboard” button.
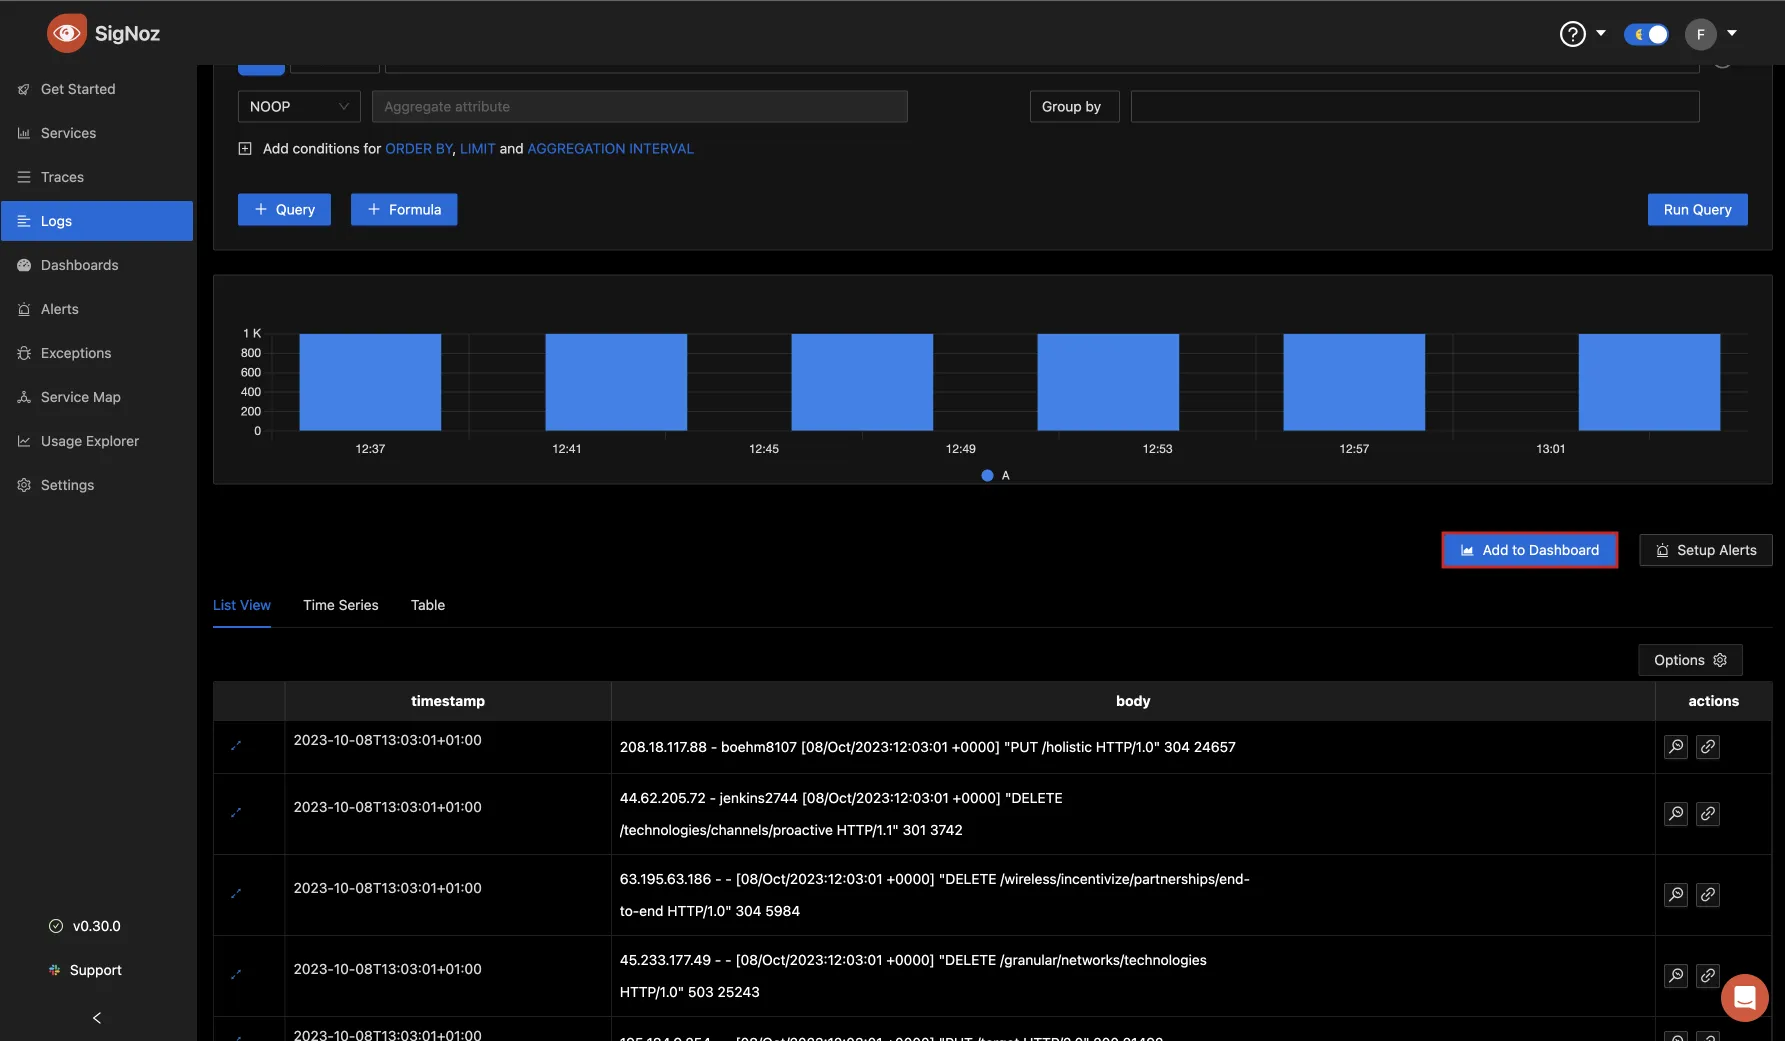
A popup then appears for you to export the panel to a dashboard. If you have an existing dashboard you can select it or choose the option of creating a new one.

You will then be presented with options for the panel, like the panel name, description, etc. After all has been set, click on the “Save” button, and it will be automatically added to that dashboard.
Getting started with SigNoz
SigNoz Cloud is the easiest way to run SigNoz. Sign up for a free account and get 30 days of unlimited access to all features.
You can also install and self-host SigNoz yourself since it is open-source. With 24,000+ GitHub stars, open-source SigNoz is loved by developers. Find the instructions to self-host SigNoz.
Further Reading
Kubectl Logs Tail | How to Tail Kubernetes Logs | SigNoz
Using Kubectl Logs | How to view Kubernetes Pod Logs? | SigNoz
