Introduction to Kubernetes Observability
Cloud has become the de-facto standard for new application development. Kubernetes solves many problems of modern-day cloud infrastructure. It has made microservices-based distributed software systems possible, enabling organizations to provide on-demand scaling. But at the same time, Kubernetes has also increased operational complexity.

In simple terms, Kubernetes is a container orchestration tool. Container environments are dynamic and ephemeral. Monitoring a container-based environment is very different from monitoring a VM-based or physical machine-based environment. Setting up a robust observability framework for a Kubernetes cluster is critical for running it effectively.
But before we dive deep into Kubernetes observability, let’s have a brief overview of Kubernetes.
What is Kubernetes?
Most modern-day applications have adopted microservices-based architecture. It offers advantages such as ease of development, modular services, easy deployment, etc. Containerization has become an important technology for developing microservices-based applications, and Kubernetes has become a standard for orchestrating containers at scale.
Kubernetes is responsible for creating, scheduling, and managing containers at scale. Imagine you have thousands of microservices running as containers. With Kubernetes, you can manage these containers optimally by provisioning nodes to run the containers and handling things like networking, authentication, scaling, automatic recovery, and so on.
Kubernetes has several components that help to manage the containers, such as the k8s control plane, kube-apiserver, kube-scheduler, etc. In a Kubernetes cluster, the containers and the internal components are spread across multiple systems, and a centralized node is responsible for coordinating and managing the containers across nodes.
Since Kubernetes run containers on a massive scale across multiple systems and has some in-house critical systems, it is essential to understand how these systems perform. And that’s where we need observability.
What is Observability?
The aim of observability is to solve customer issues quickly. Creating monitoring dashboards is useless if it can’t help engineering teams quickly identify the root causes of performance issues.
A modern distributed software system has a lot of moving components. So while setting up monitoring, you might not know what answers you would need to solve an issue.
Observability enables application owners to get answers to any question that might arise while debugging application issues.
What is Kubernetes observability, and why is it important?
Observability in Kubernetes means the ability to troubleshoot issues quickly with the help of collected telemetry signals, namely, logs, metrics, and traces. Kubernetes observability is about having the complete visibility of your k8s clusters.
A robust observability framework can make k8s clusters more resilient to failure and improve developer productivity. Here are some of the key benefits of Kubernetes observability:
Improved visibility & troubleshooting
Kubernetes provides a dynamic abstraction layer for the on-demand scaling of containers. Although it has many benefits, it makes it difficult to identify the root cause of issues and troubleshoot them. With good observability data, you can quickly identify the root cause of issues.Improved Performance
With telemetry data like traces, you can keep track of how requests are performing across services. If there are some requests which are taking more time, you can dig deeper and optimize them.Reduced downtime
A good observability tool can help you reduce the downtime of your Kubernetes cluster. With contextual observability data, developers can troubleshoot issues faster or avoid them altogether.Enhanced Security
Observability tools can also help monitor Kubernetes clusters for suspicious activities and help identify security threats.Reduced costs
A resilient Kubernetes cluster with low downtime and performance can save money. System administrators can also monitor resource usage and identify and optimize over-allocated resources.
Observability starts with collecting important telemetry signals from your systems. Now that you understand the importance of observability, let’s have a brief look at the three pillars of observability.
Three pillars of Observability in Kubernetes
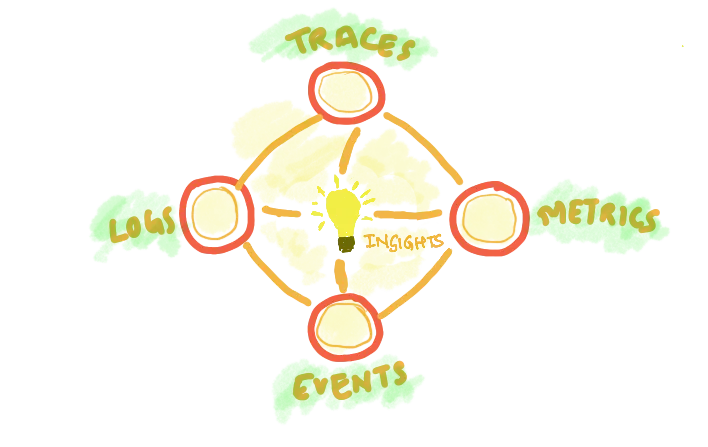
Observability in Kubernetes has three main components:
- Metrics
- Logs
- Traces
Metrics:
Metrics are simply numbers. Numbers that define CPU usage, memory usage, and the number of requests per second, etc.
How are metrics helpful?
Let’s take an example of CPU and memory usage. The more the usage, the higher the probability of the application going down if the allocation is not increased. So, this metric helps to identify the amount of memory and CPU left in the system and whether it will be sufficient to serve further requests.
Logs:
Logs are simple messages that define the current state of the system.
Let’s take a common error log we see in Kubernetes “imagepullbackoff” error.
This log message helps us understand the issue of pulling images from the container repository. Digging deeper, we will get more information, like an authentication or tag-related issue, or the image name might be wrong. With this information, we will be able to identify the potential issue and resolve it.
Traces:
As described earlier, Kubernetes is a system that runs containers at scale. In the majority of cases, containers are nothing but microservices. In the microservices world, there is always a need to have communication between microservices. For example, the product service might call user service to get some relevant user details.
Tracing helps track user requests across microservices and also gives us contextual information about these requests. A trace in distributed tracing represents an end-to-end user request and is composed of single or multiple spans.
In the microservices world, traces give us information on the flow of requests between services, where it started, how long it took each service to process the requests, and if any error occurred in the service.
It will also help identify exactly in which service we have bottlenecks, which parts of the system are causing latency issues, etc.
But to have robust observability set up, it’s not enough just to collect these three telemetry signals. A good observability setup also has correlated telemetry signals. For example, if we know through our logs that there are some issues, we can correlate the logs with traces to dig deeper.
There are multiple tools and open-source libraries for getting started with Kubernetes observability. But if you want a one-stop solution, the best way is to use OpenTelemetry.
OpenTelemetry is an open-source collection of tools, APIs, and SDKs that aims to standardize the way we generate and collect telemetry data. OpenTelemetry was formed after the merger of two open-source projects - OpenCensus and OpenTracing in 2019. Since then, it has been the go-to open-source standard for instrumenting cloud-native applications.
It is also backed by Cloud Native Computing Foundation (CNCF), the same foundation from which Kubernetes graduated. OpenTelemetry is also the second most active CNCF project after Kubernetes.
Kubernetes observability with OpenTelemetry
Opentelementry’s goal is to provide a set of standardized vendor-agnostic SDKs, APIs, and tools for ingesting, transforming, and sending data to an observability back-end like SigNoz.
OpenTelemetry is not an observability back-end like Jaeger or Prometheus. Instead, it supports exporting data to a variety of open-source and commercial back-ends. It provides a pluggable architecture so additional technology protocols and formats can be easily added.
If you’re using OpenTelemetry, you can avoid vendor lock-in. For applications deployed on Kubernetes, OpenTelemetry provides an operator which makes it very easy to instrument workloads deployed on Kubernetes.
A Kubernetes operator is a method of packaging, deploying, and managing a Kubernetes application. OpenTelemetry Operator helps a lot in managing OpenTelemetry collectors and enables auto-instrumentation of applications deployed on Kubernetes.
OpenTelemetry can send the collected data to multiple backends. You can use different backends for each signal in OpenTelemetry. But managing different tools is not recommended. Engineering teams also need to correlate all signals for effective analysis. And that’s where an APM tool is needed.
SigNoz is a full stack open source APM which provides logs, metrics and traces under a single pane of glass. It supports OpenTelemetry natively. With SigNoz and OpenTelemetry, you can have a completely open-source stack for your observability setup.
Related Posts
