Loki vs Elasticsearch - Which tool to choose for Log Analytics?
Elasticsearch, or the ELK stack, is a popular log analytics solution. The Loki project was started at Grafana Labs in 2018. Grafana leads the development of Loki, while Elastic is the company behind Elasticsearch. In this article, we will do a detailed comparison between these two tools for log analytics.
Log data helps application owners debug their applications while also playing a critical role in cyber security. Most modern applications are now based on distributed components based on container technologies. Collecting log data from these systems and deriving timely insights from them can be complex. That’s where Log analytics tools like Loki and Elasticsearch come into the picture.
One of the biggest complaints of using Elasticsearch is that it hogs a lot of resources. Loki does not index all log lines, and only indexes labels associated with log lines. This makes Loki faster than Elasticsearch but only where your use-case is fulfilled by indexing of labels.
Before we look at the differences between these two tools, let us have a brief overview of both tools.
What is Loki?
Loki is one of the popular open source logging tools developed by Grafana labs. It is inspired by Prometheus and is designed to be cost-effective and easy to operate. Loki is designed to keep indexing low. It does this by making use of labels. Labels are any key-value pairs that can be used to describe a log stream. For example:
scrape_configs:
 - job_name: system
   pipeline_stages:
   static_configs:
   - targets:
      - localhost
     labels:
      job: syslog
      __path__: /var/log/syslog
The above config will let you query the log stream with {job=syslog}. Labels act as an index to Loki's log data and keep the complexity low. But Loki does not support high cardinality efficiently. For example, if you create a label for the user's IP address, you will have thousands of log streams, as every user will have a unique IP. This can make Loki very slow as it requires building a huge index.
What is Elasticsearch?
Elasticsearch is a search engine built on Apache Lucene. For log analytics, Elasticsearch is combined with Logstash or FluentD and Kibana. The ELK stack comprises of following independent components:
- Elasticsearch
- Logstash
- Kibana
There are other log-collecting tools too that can be used for collecting logs. FluentD and Filebeat are two popular log collectors used in the pipeline. Once the log data is collected, it is stored as unstructured JSON objects. Both the key of the JSON object and the contents of the key are indexed. Elasticsearch indexes all data in every field. Kibana lets you visualize the logs data to generate insights.
Now that we have an overview of both tools let’s discuss the key differences between them.

Loki vs Elasticsearch - at a glance
| Loki | Elasticsearch | |
|---|---|---|
| Storage | Requires less space | Is resource intensive |
| Indexing | Designed to keep indexing low | Indexes all log lines |
| Query Language | LogQL | Kibana Query Language or Lucene Query Syntax |
| Log Collectors | Uses Promtail | Uses Logstash |
| User Interface | Grafana | Kibana |
| Cost | More cost-efficient but lesser search capabilities | Costly but provides full-text search |
Key differences between Loki and Elasticsearch
Licensing has changed on both sides since this was first written: Elasticsearch added an AGPLv3 option in 2024, while Loki has been AGPLv3 since 2021 — so both now sit under copyleft open-source terms. Architecturally the contrast still holds: Loki indexes only labels and stores compressed log chunks cheaply, while Elasticsearch builds a full inverted index for rich, fast search at higher storage cost. Loki's collection also now runs through Grafana Alloy.
Storage
Log data is often huge, with every application, host machine, and infrastructure component generating its own set of log streams. And storage can quickly become costly. So it’s important to understand how Loki and Elasticsearch store log data.
Loki only indexes the metadata(labels) of logs. Once the indexing is done, the log data is compressed and stored in object stores like S3 and GCS. The compressed log data is called a chunk. Since only a set of labels is indexed for each log stream, the index created is small. Both index and chunks can be stored on the object store from Loki 2.0.
Elasticsearch indexes the full contents of stored documents. The data is stored on-disk as unstructured JSON objects. Elasticsearch makes documents fully searchable but at the cost of requiring more storage space.
Indexing
The biggest difference between Loki and Elasticsearch is how they index data. While Loki is designed to keep indexing low, Elasticsearch indexes all data in every field, and each indexed field has a dedicated, optimized data structure. Since indexes are low in Loki, it is more cost-effective and performant. But it loses the rich text search capabilities that Elasticsearch provides.
Query Language
Loki uses its own language for querying logs, called LogQL. Each query consists of two parts: a log stream selector and a filter expression. The performance of query execution depends on how many labels are selected to filter down log streams.
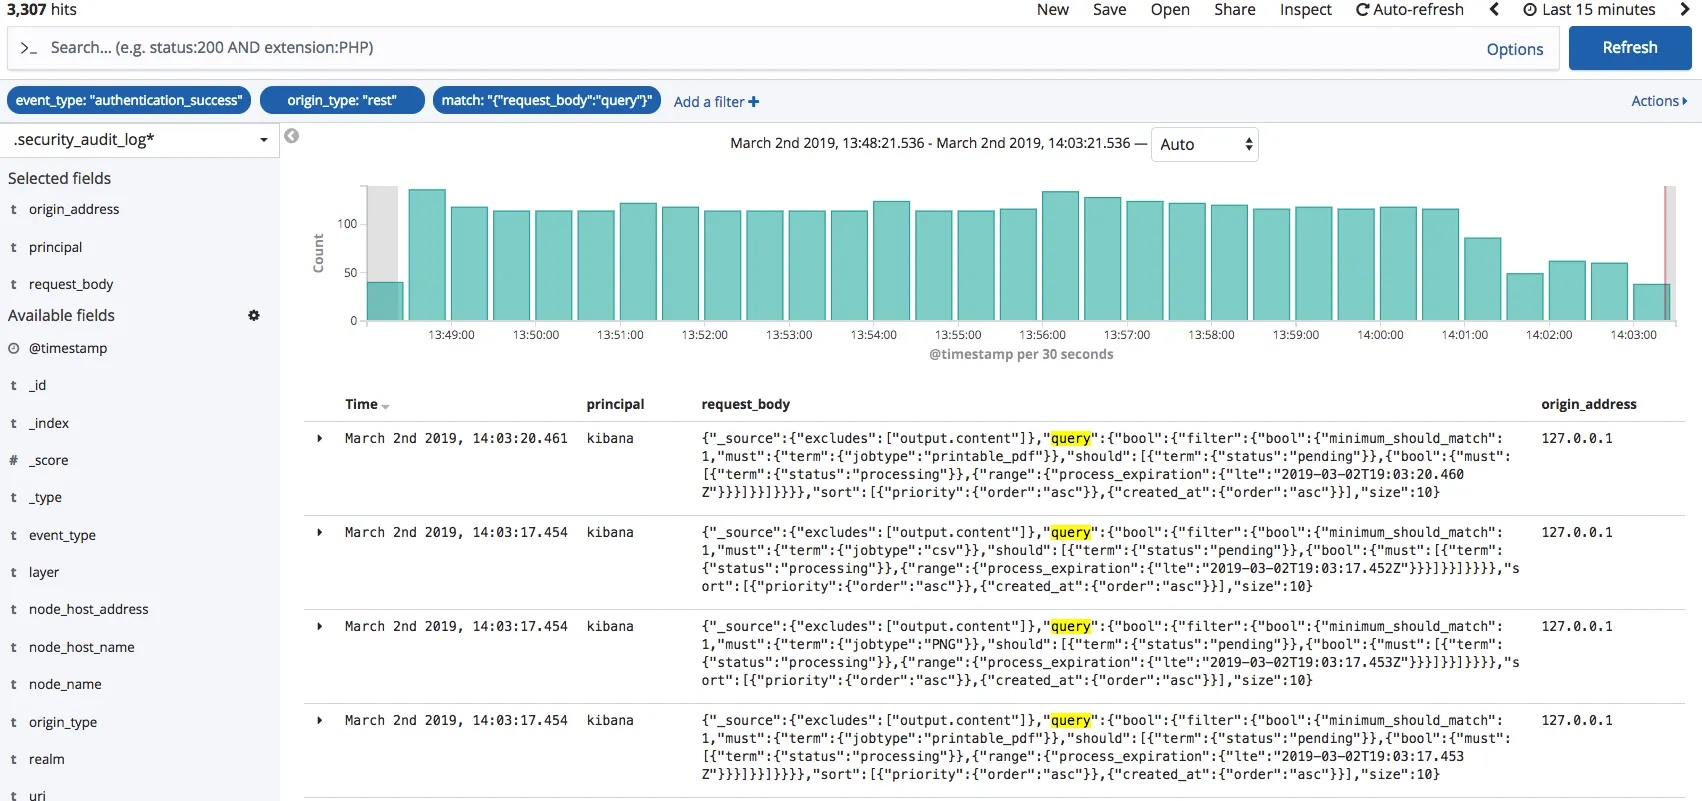
If you are using Kibana to visualize log data from Elasticsearch, you can use the Kibana Query Language (KQL). You can also choose to turn off Kibana Query Language and use Lucene Query syntax instead.
Both LogQL and KQL have a learning curve, and it depends on users how quickly they can become accustomed to it. As KQL is much older, you can find more examples online to learn and implement for your use case.
Promtail vs Logstash
Loki uses Promtail to discover log files. Promtail is specifically designed for Loki. It discovers log files stored on disk and forwards them to Loki. It primarily does three things: discovers targets, attaches labels to the log stream, and pushes them to the Loki instance.
Logstash is used to collect and forward logs to Elasticsearch. Logstash is a data processing engine. Logstash can send data to a number of destinations, not just Elasticsearch. It can collect data from different sources, process it, and ship it to a destination.
Logstash uses input plugins to ingest data from different sources. Configuring Logstash is a bit more complex than Promtail. Promtail is an agent that needs to be deployed to every machine that has applications to be monitored.
User Interface - Grafana vs Kibana
Loki is developed by Grafana Labs, the company behind the popular Grafana dashboards. You can use Grafana to query and visualize the log data stored in Loki. If you are familiar with Prometheus and Grafana setup, it will be easier for you to visualize log data in Grafana. Grafana was originally built to visualize time-series data.
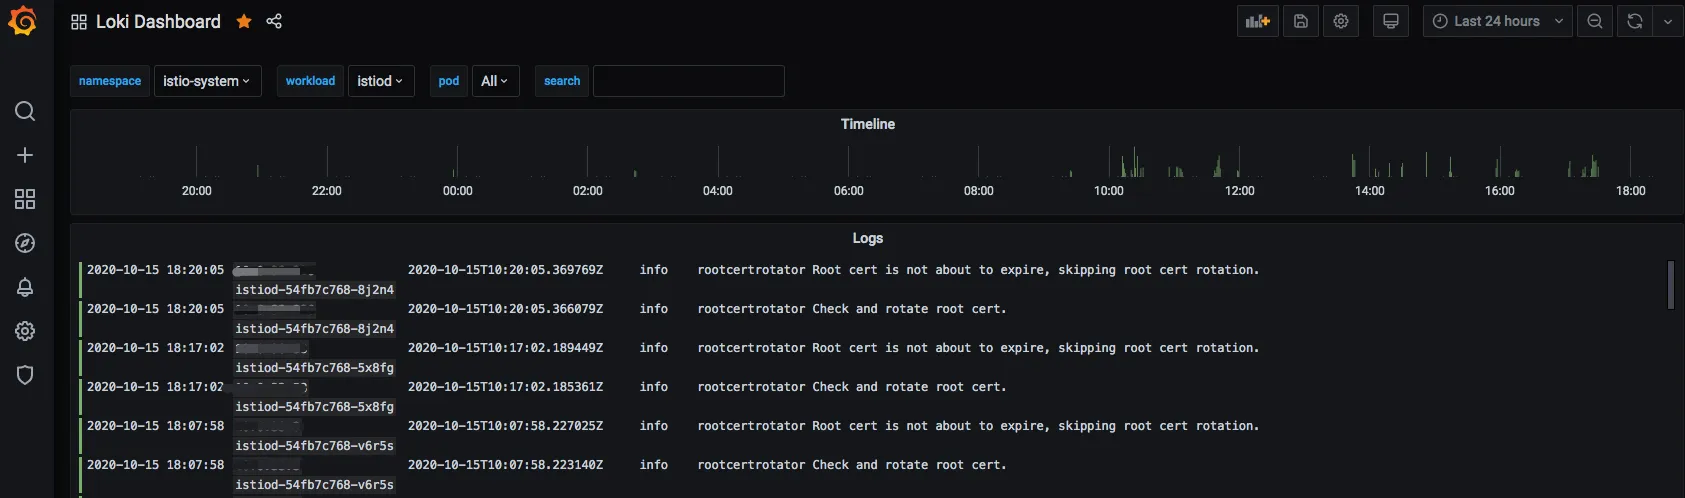
The ELK stack uses Kibana as its data visualization layer. Kibana is more suited to visualizing data with context as Elasticsearch enables full-text search.
Both Grafana and Kibana are popular dashboarding tools. The difference between them mainly lies in their genesis. Kibana was built to visualize data of any kind. Grafana started out as a fork of Kibana to focus mainly on time-series data.
Choosing between Loki and Elasticsearch
Choosing between Loki and Elasticsearch depends on your use cases and the resources available. While Loki is resource efficient, it does not give the rich search capabilities given by Elasticsearch. You also have to factor in the cost and resource requirements. Elasticsearch needs more resources as compared to Loki.
If you are starting out your log analytics journey and want something to start quickly, Loki can be a good option. At the same time, Elasticsearch makes more sense for larger-scale and enterprise teams.
You can also try out SigNoz. SigNoz can be a good choice for users who don’t have the resources to support the Elasticsearch stack and want better querying capabilities than Loki.
If you're weighing the wider field, Loki vs Prometheus, Elasticsearch vs OpenSearch, and Elasticsearch vs Splunk are useful, along with the ELK alternatives roundup. For more log-analytics comparisons, see OpenSearch vs Splunk and Kibana vs Splunk.
SigNoz - an open source alternative to Loki and Elasticsearch
SigNoz is a full-stack open source APM that you can use as an alternative to Loki and Elasticsearch. SigNoz uses a columnar database ClickHouse to store logs, which is very efficient at ingesting and storing logs data. Columnar databases like ClickHouse are very effective in storing log data and making it available for analysis.
Big companies like Uber have shifted from the Elastic stack to ClickHouse for their log analytics platform. Cloudflare too was using Elasticsearch for many years but shifted to ClickHouse because of limitations in handling large log volumes with Elasticsearch.
While Loki is also resource efficient, it does not give you advanced querying capabilities on high cardinality data. SigNoz utilizes the underlying columnar database to let users run advanced queries faster.
SigNoz uses OpenTelemetry for instrumenting applications. OpenTelemetry, backed by CNCF, is quickly becoming the world standard for instrumenting cloud-native applications.
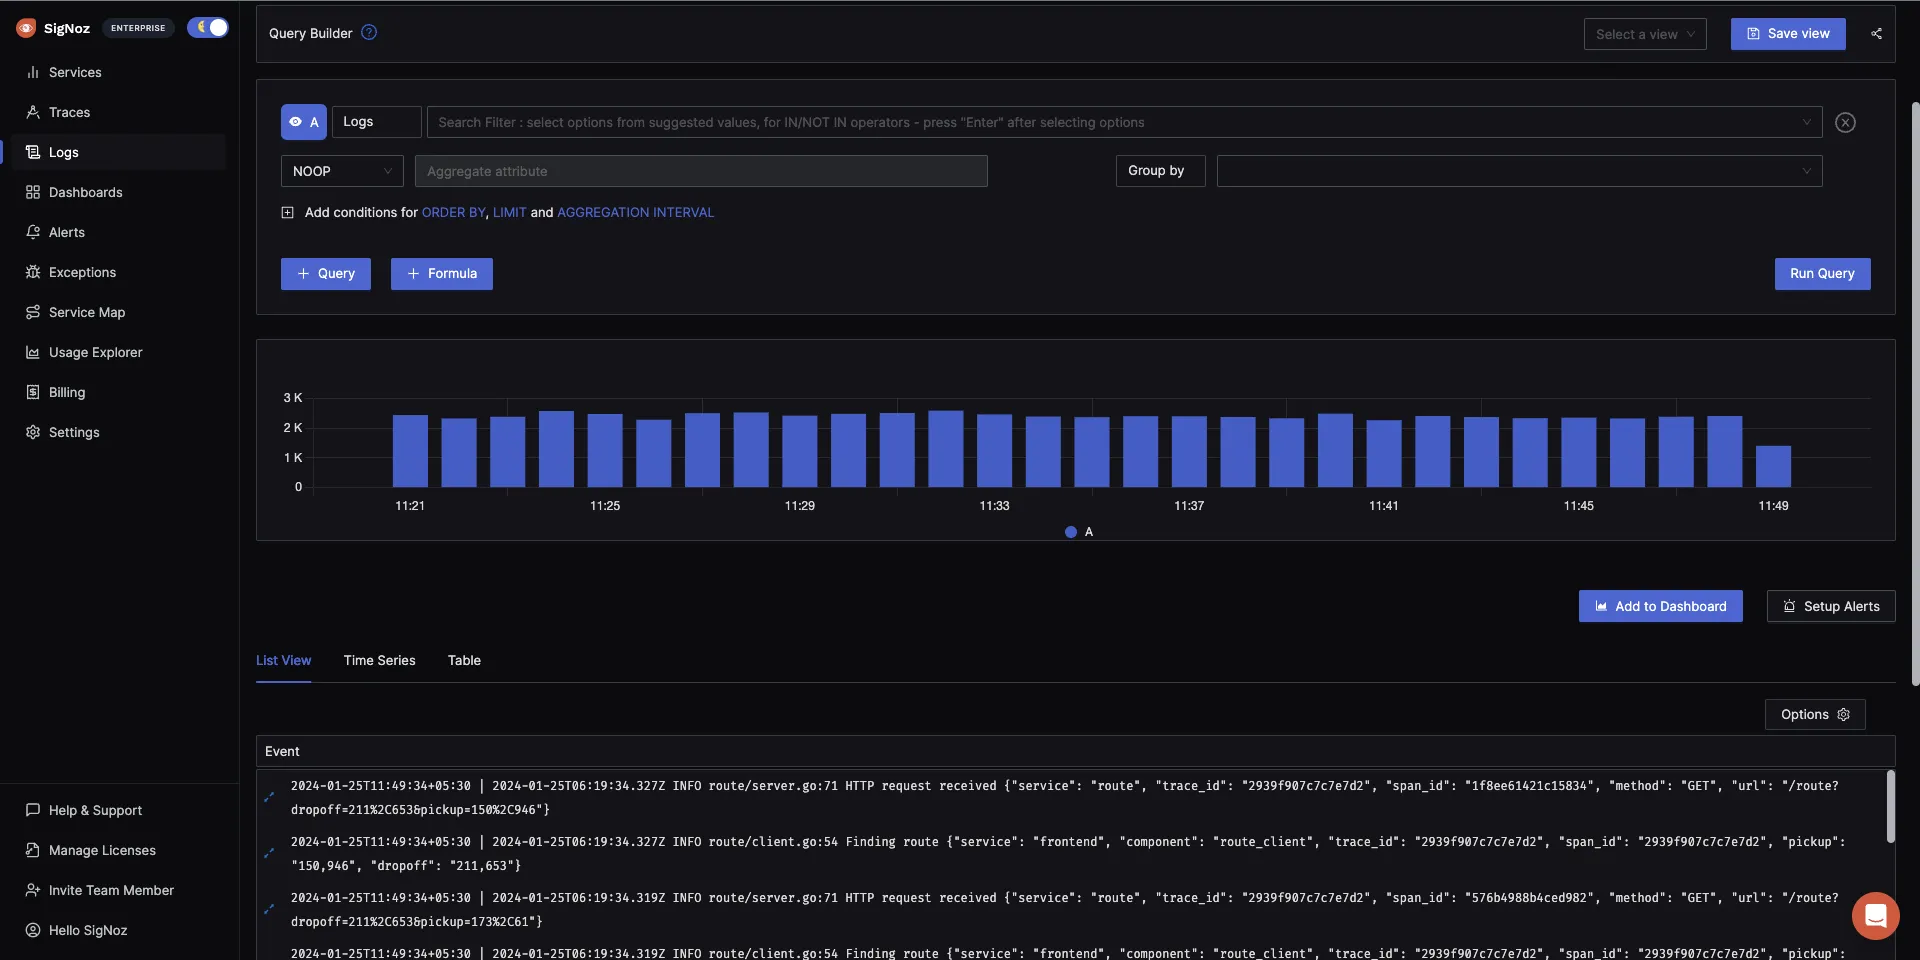
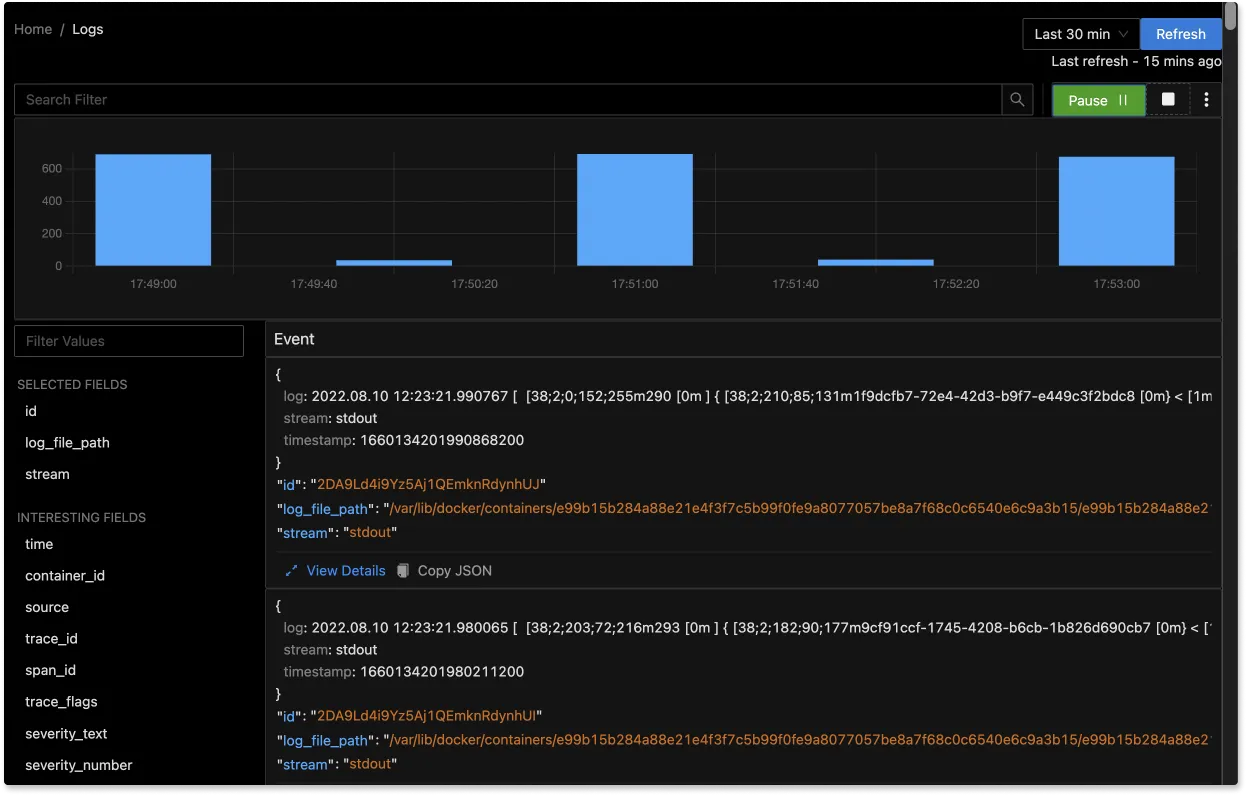
The logs tab in SigNoz has advanced features like a log query builder, search across multiple fields, structured table view, JSON view, etc.
You can also view logs in real time with live tail logging.
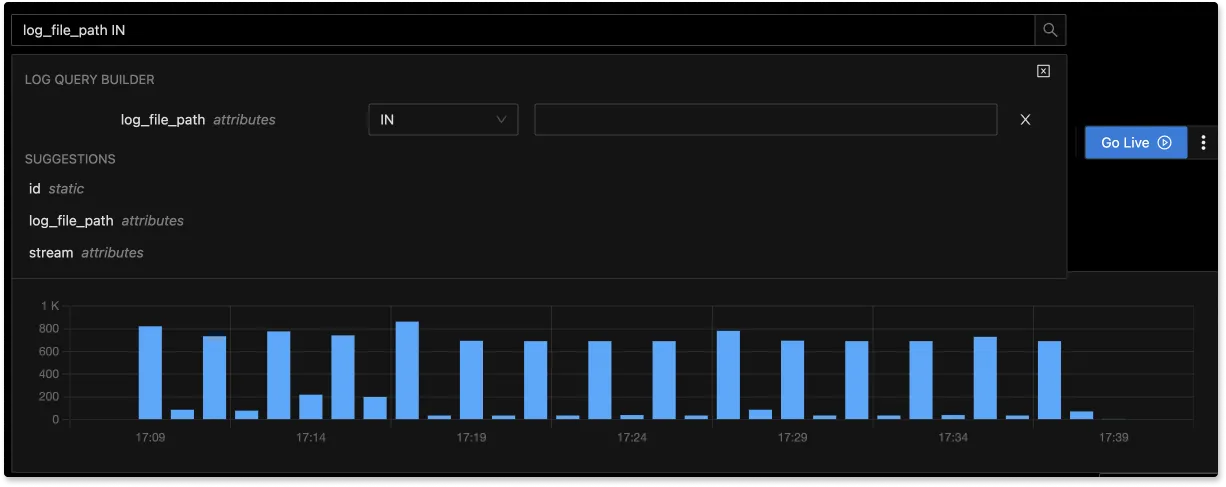
With advanced Log Query Builder, you can filter out logs quickly with a mix and match of fields.
Getting started with SigNoz
SigNoz Cloud is the easiest way to run SigNoz. Sign up for a free account and get 30 days of unlimited access to all features.

You can also install and self-host SigNoz yourself since it is open-source. With 24,000+ GitHub stars, open-source SigNoz is loved by developers. Find the instructions to self-host SigNoz.
Related Posts
