Loki vs Prometheus - Differences, Use Cases, and Alternatives
Loki and Prometheus are both open source tools. While Loki is a log aggregation tool, Prometheus is a metrics monitoring tool. Loki’s design is inspired by Prometheus but for logs. This blog post compares the two common monitoring tools Loki vs Prometheus, to help you understand their key differences.
Log management and metrics monitoring are critical aspects of monitoring a software system effectively. With the growing complexity of cloud-based software systems, it is even more important to choose the right monitoring tools which can help you attain a global view of all the different components of a software system.
Loki is designed to be a cost-effective tool for log management. On the other hand, Prometheus is a very popular open source metrics monitoring tool.
Let's dive in and discuss Loki and Prometheus in detail.
What is Loki?
Loki is an open-source log aggregation tool inspired by Prometheus architecture. It is designed as horizontally-scalable, highly-available, and multi-tenant to allow you to collect, store, and search log data.
Loki was created by Grafana Labs, with its first version released in 2019. Loki is designed to keep indexing low. It does this by making use of labels. Labels are any key-value pairs that can be used to describe a log stream. For example:
scrape_configs:
 - job_name: system
   pipeline_stages:
   static_configs:
   - targets:
      - localhost
     labels:
      job: syslog
      __path__: /var/log/syslog
The above config will let you query the log stream with {job=syslog}. Labels act as an index to Loki's log data and keep the complexity low. But Loki does not support high cardinality efficiently. For example, if you create a label for the user's IP address, you will have thousands of log streams, as every user will have a unique IP. This can make Loki very slow as it requires building a huge index.
Key Features of Loki
Some of the key features of Loki are:
- It provides you with LogQL as its own query language, allowing you to powerfully query and filter your logs.
- Has support Grafana integration for real-time log visualizations and querying.
- It uses labels to identify log streams.
- Natively integrates with Prometheus, Grafana and K8s.
- PromQL-compatible to allow you access to Prometheus-like labels. This makes Loki easier to use to categorize and label log data while using PromQL to search and analyze logs.
- Prometheus Alertmanager for sending alerts.
- Cost-effective and durable storage as Loki doesn't index logs text contents. It only needs labels for each log stream.
- Multi-tenancy support through to allows each tenant's data to be stored independently.
What is Prometheus?
Prometheus is an open-source metrics monitoring and alerting tool. It was initially developed at SoundCloud in 2012 before being released as an open-source project. It got accepted into the CloudNative Computing Foundation in 2016 and was the second project to graduate from the foundation, following Kubernetes.
Prometheus uses a pull-based monitoring model to collect metrics and store them as time series. It uses time series data to record metrics operations that change over time, such as requests per second.
Prometheus doesn't have built-in visualization or dashboard capabilities. It aims to provide you with a powerful query language called PromQL that queries and analyzes metrics in real-time. It is usually combined with Grafana to build dashboards.
Key Features of Prometheus
Some of the key features of Prometheus are:
- Multi-dimensional Data Model using time-series data with metric names and key-value pairs as identifiers.
- Uses PromQL as a querying language to leverage a multi-dimensional data model.
- Collects data using Pull Model as data is collected through active “pulling” via HTTP.
- No reliance on distributed storage as all single server nodes are self-contained.
- Pushing time-series data available through the usage of an intermediary gateway.
- Monitoring Target Discovery options for both static configuration and service discovery
- Visualization for graphs and dashboards types.
Key Differences between Loki and Prometheus
One update worth noting: Prometheus 3.0 shipped at the end of 2024 with native histograms and native OTLP ingestion. The two are complementary rather than competing: Prometheus handles metrics, Loki handles logs, and they are routinely run together, with Loki designed to mirror Prometheus's label model and pair with it in the Grafana stack.
Architecture
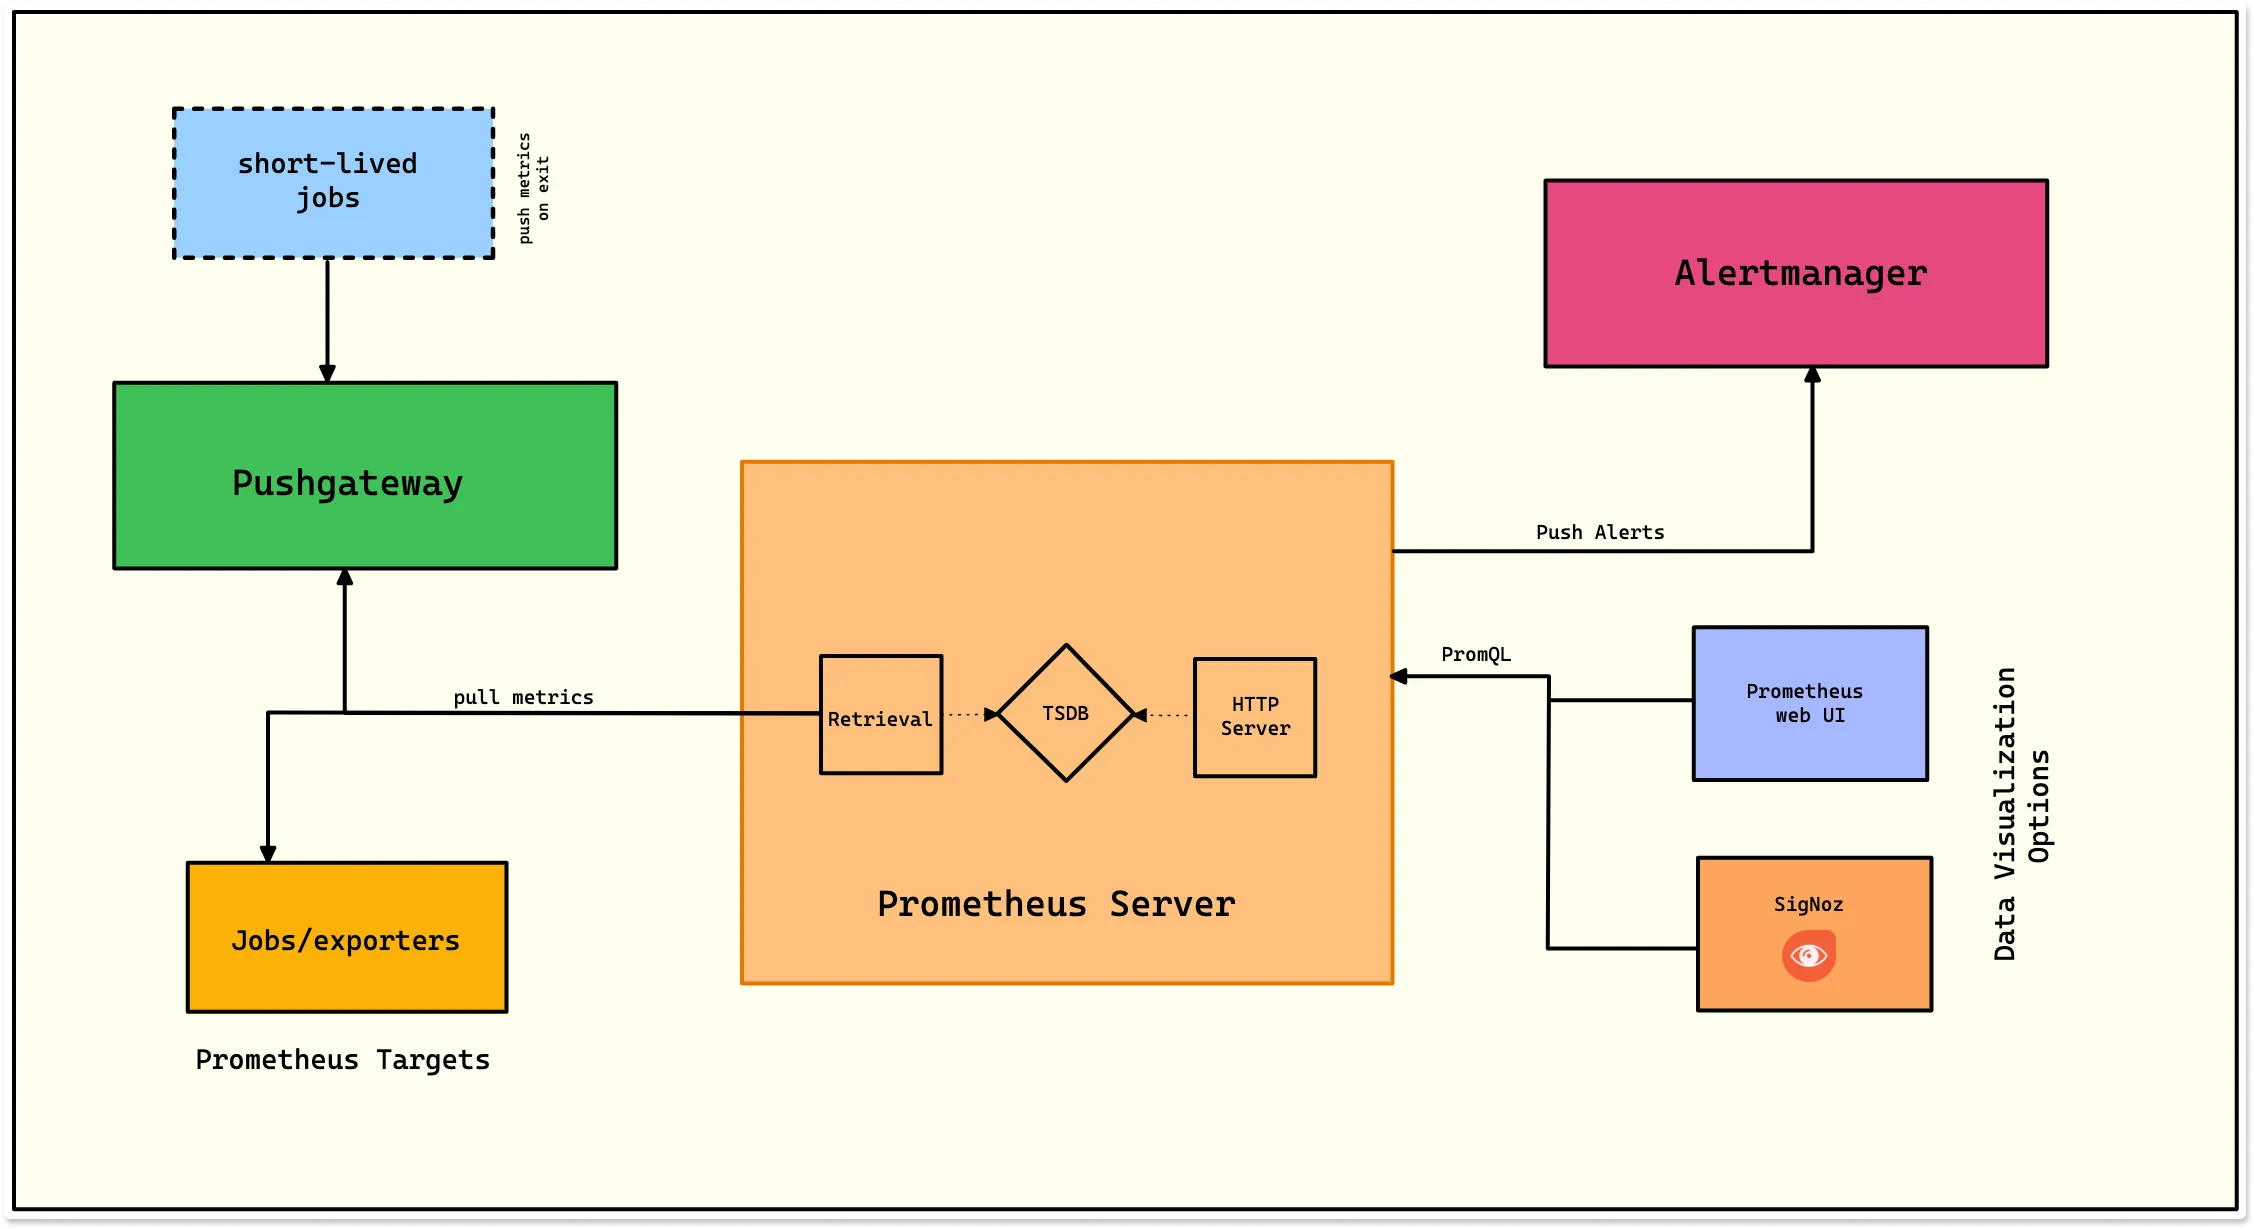
The Prometheus server is at the core of Prometheus architecture. Other important components are pushgateway, alertmanager, and Prometheus data storage. Prometheus only provides a basic web UI, and it is commonly used with tools like SigNoz and Grafana to visualize metrics.
A brief overview of components in Prometheus architecture:
- Prometheus Server - It scrapes and stores time series data.
- Pushgateway - It collects metrics from short-lived jobs.
- Prometheus Targets - Instrumented jobs from which Prometheus scrapes metrics.
- Alertmanager - It handles alerts.
- Prometheus web UI/SigNoz - SigNoz or other API consumers can be used to visualize the collected data.
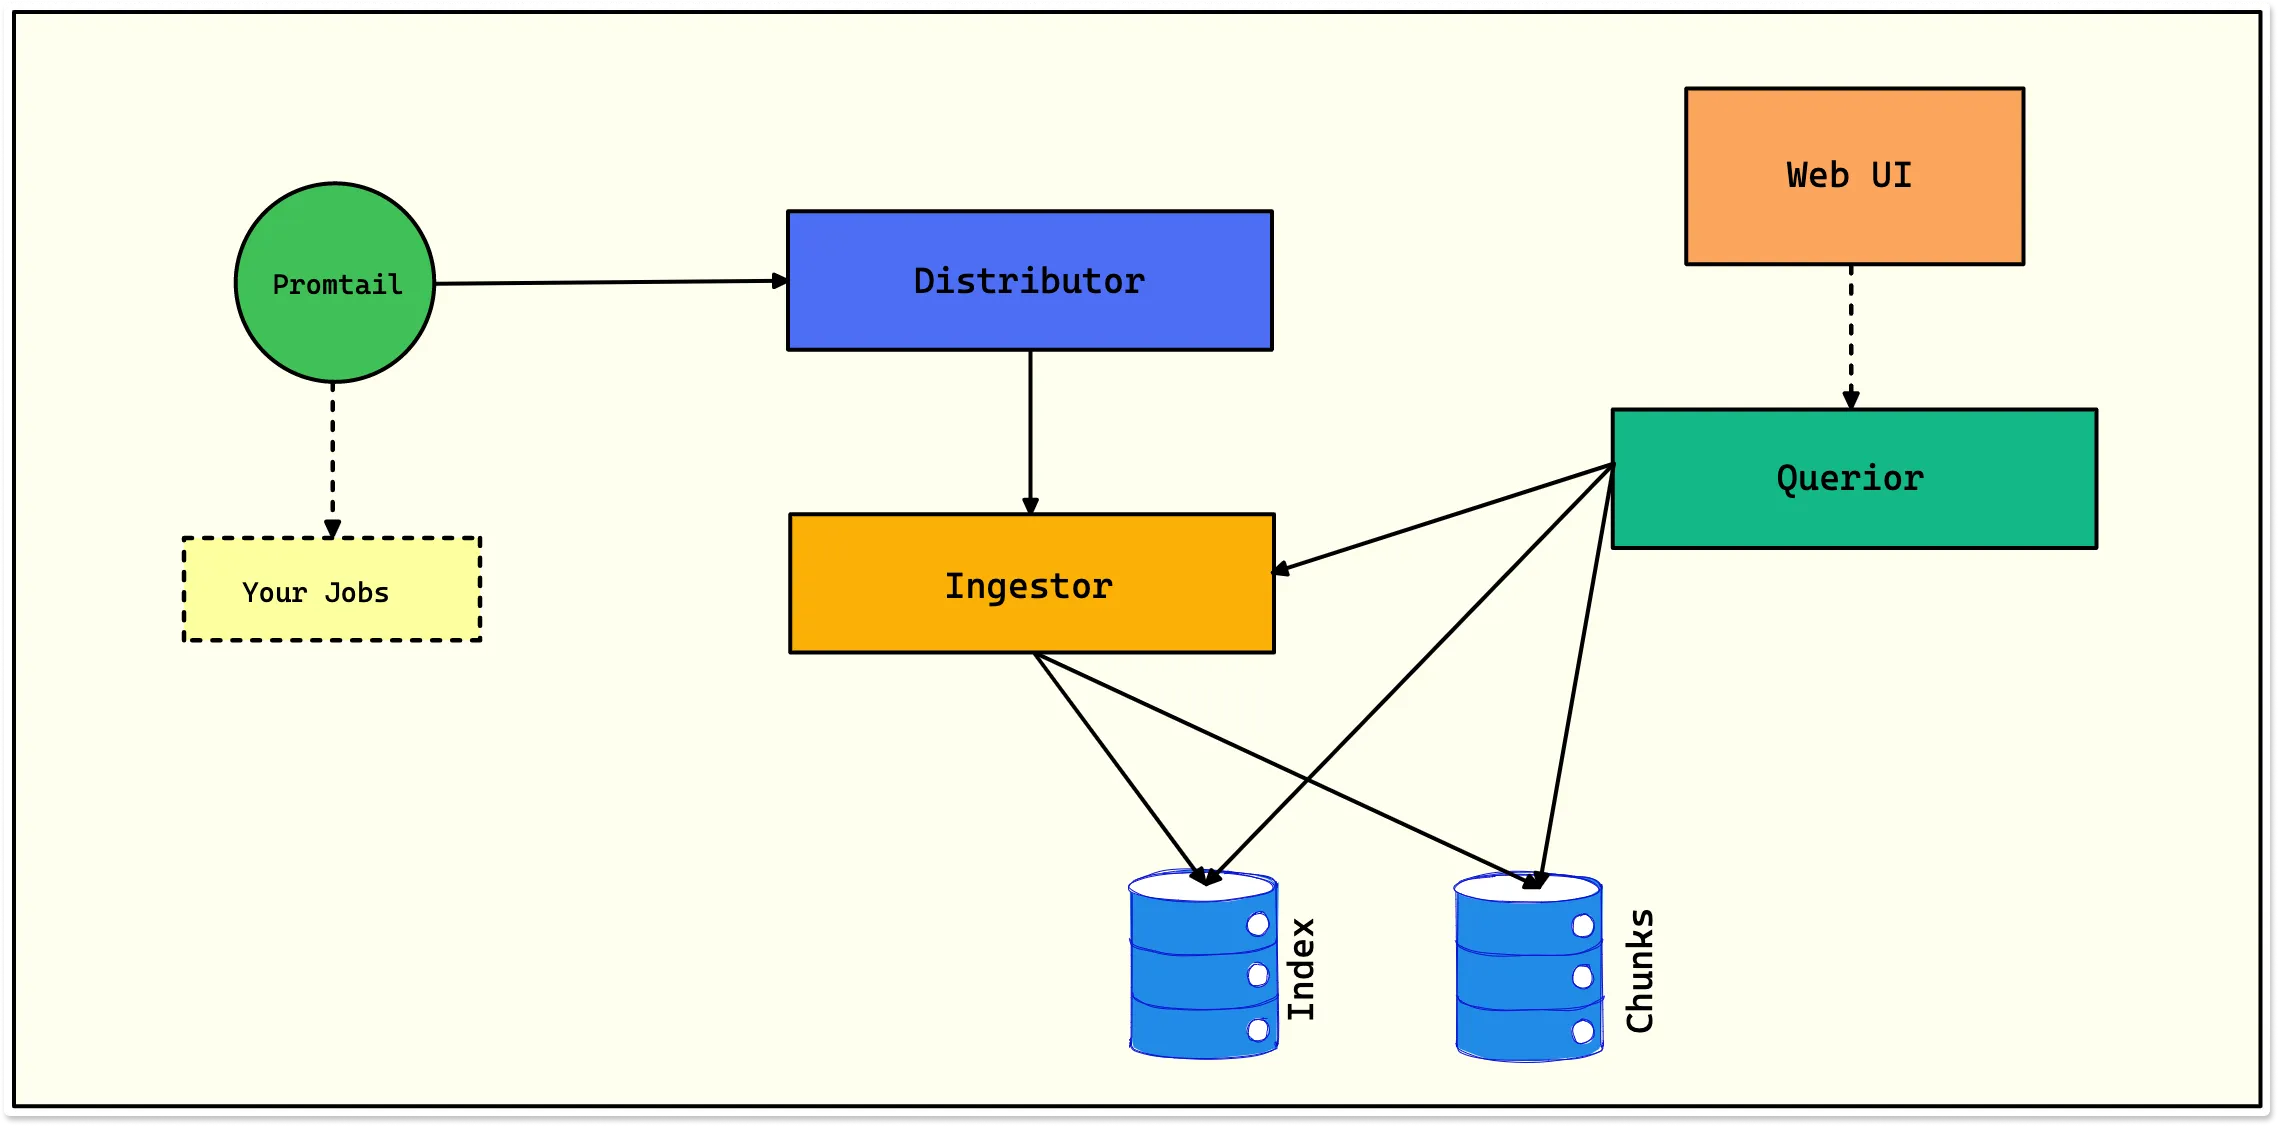
Loki’s architecture is inspired by Prometheus. The main components in the Loki architecture are Distributor, Ingester, Querier, and Promtail.
A brief overview of components in Loki architecture:
- Promtail - It is the log collection agent that runs on each node of a Kubernetes cluster.
- Distributor - The first component to receive logs from promtail.
- Ingestor - It builds compressed chunks of log data and flushes them out as chunks.
- Querior - It handles the read path, scanning the index to figure out which chunks match.
Storage
Prometheus stores data in a time-series database. However, metrics stored in its time series are short-lived. For storing metrics in long term, you need to use remote storage integrations.
Loki stores log data in two parts: index and chunks. The chunks are put into object storage, and the indexes are put into Cassandra/Bigtable/DynamoDB database.
Indexing
Prometheus stores data into basic units of storage known as blocks. Each block contains data corresponding to a particular time range and has two important elements:
- Sample data - The actual metrics data, including timestamps.
- Indexes - Data used to access stored metrics.
The index file has two types of indexes, the postings index and the series index. Prometheus uses these two indexes to retrieve the required data when a query is run.
Loki only indexes the metadata(labels) of logs. Once the indexing is done, the log data is compressed and stored in object stores like S3 and GCS. The compressed log data is called a chunk. Since only a set of labels is indexed for each log stream, the index created is small. Both index and chunks can be stored on the object store from Loki 2.0.
Querying/Query Language
Prometheus provides a query language known as PromQL that lets users select and aggregate time-series data in real-time. Here’s an example of a simple PromQL query:
http_requests_total{job="apiserver", handler="/api/comments"}[5m]
The expression above queries the time series engine for all http_requests_total
occurrences that come under the apiserver job and /api/comments handler. The intended output would be a range that spans five minutes [5m] from the moment the expression executes.
On the other hand, Loki provides a query language known as LogQL which is inspired by PromQL. LogQL uses labels and operators for filtering. There are two types of LogQL queries: log queries return the content of log lines, and metric queries enable you to calculate values based on query results.
Data Visualization
Prometheus has a web UI that allows you to run PromQL queries, view and analyze metrics, and manage alerts. The web UI provided by Prometheus is very basic. It is recommended to use a tool like SigNoz to visualize metrics data collected by Prometheus.
Loki has not built-in dashboard solution; you must use Grafana or other tools for visualization and dashboarding. Loki uses its Query frontend component that receives query requests. Based on query results, the Query frontend handles pagination and filtering of the query results to divide extensive searches into smaller ones. You can use the Grafana dashboard for data visualization.
Use Cases
Some of the key use cases for Prometheus are:
- Tracking metrics and managing alerts.
- Great for gathering time-series data from running services and applications endpoints.
- It provides monitoring and alerting features for infrastructure and applications.
- An ideal option for time-series-based data collection and analysis.
Some of the key use cases for Loki are:
- If you need a log aggregation and analysis tool, Loki is good at collecting log data from multiple sources for log querying and visualization.
- Good for use cases where high cardinality data is not involved.
- Its integrated alert manager provides alerting based on specific conditions of log data critical events in real-time.
For adjacent matchups, the Prometheus vs Grafana comparison covers the metrics-and-visualization pairing, and Loki vs Elasticsearch weighs Loki on the log-storage axis.
Open source alternative to Loki and Prometheus - SigNoz
Loki is efficient at keeping the cost of log management low. But it doesn’t perform well if you want to index and query high cardinality data. Prometheus can only be used for metrics monitoring. You will have to use other tools for monitoring other telemetry signals. Using multiple tools for setting up your monitoring stack results in operational complexity and dependencies.
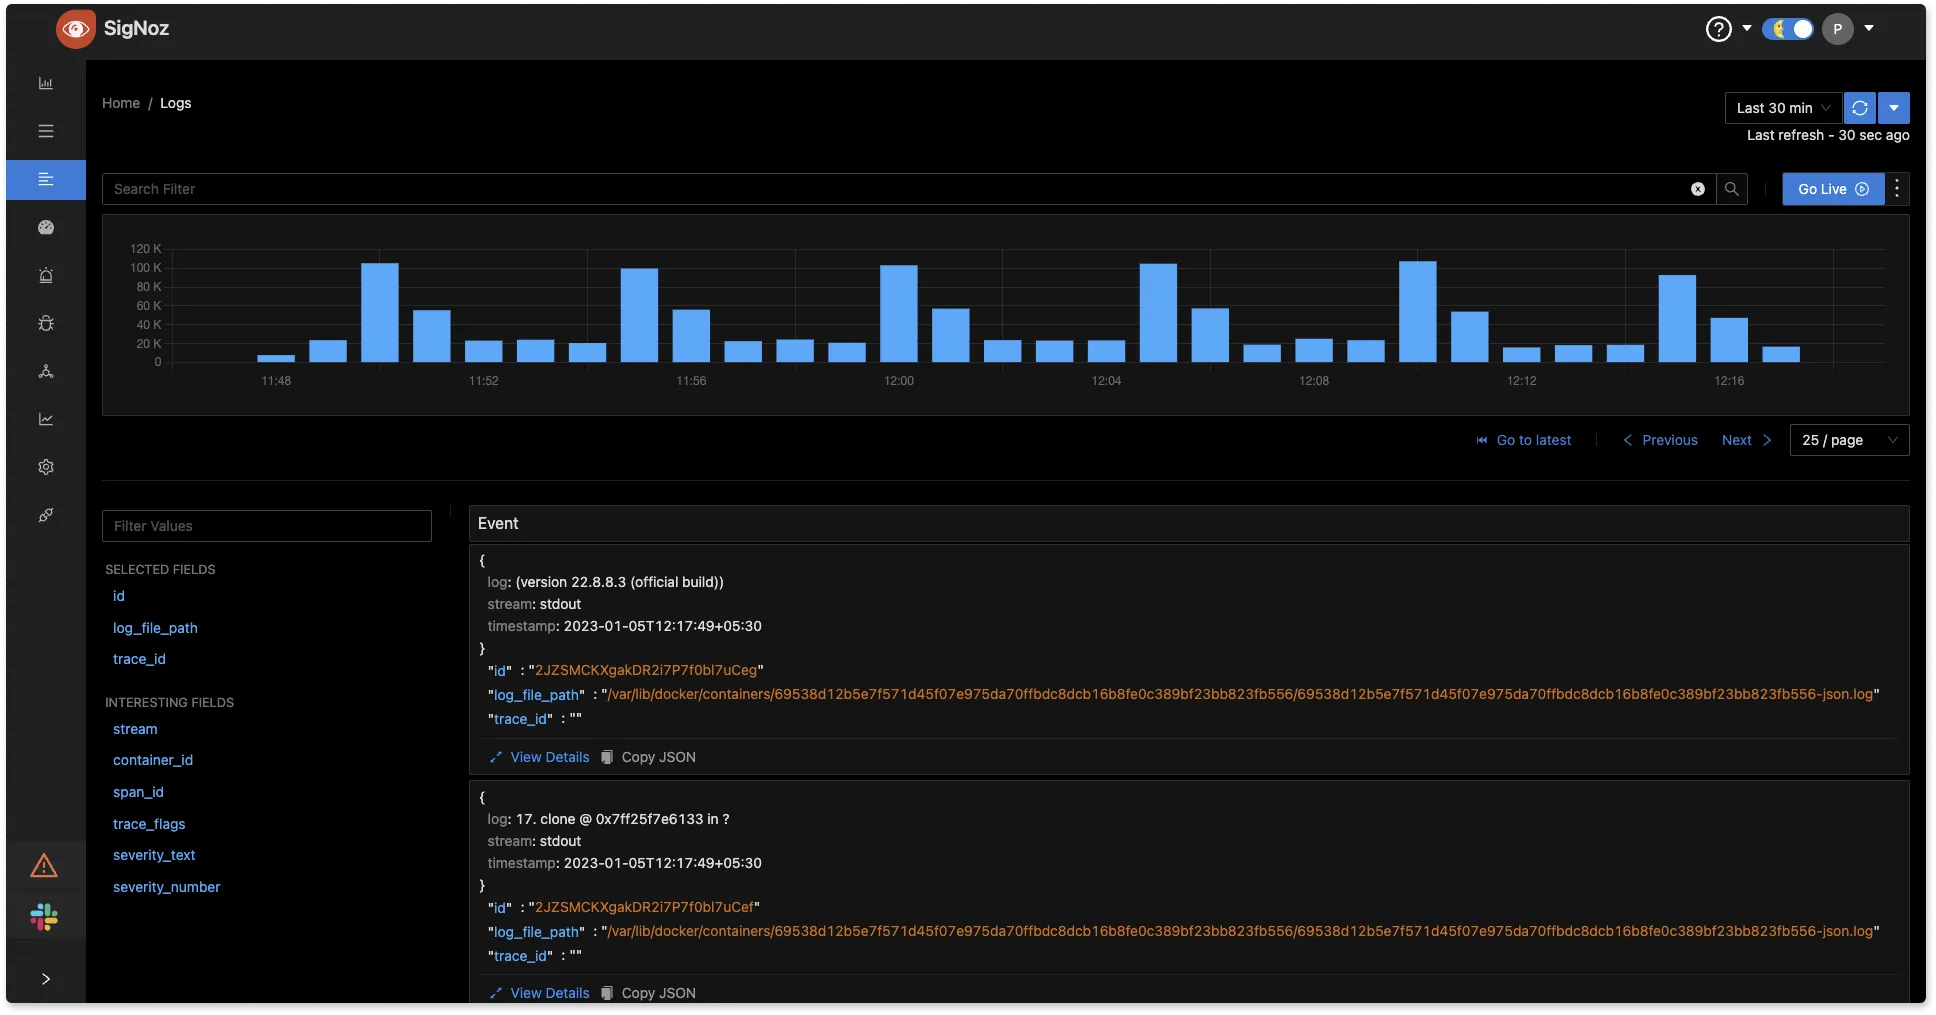
Instead of using Loki and Prometheus, you can use SigNoz - an open source full-stack observability platform. SigNoz provides log management, metrics monitoring, and distributed tracing under a single pane of glass and can be a one-stop solution for all your monitoring needs.
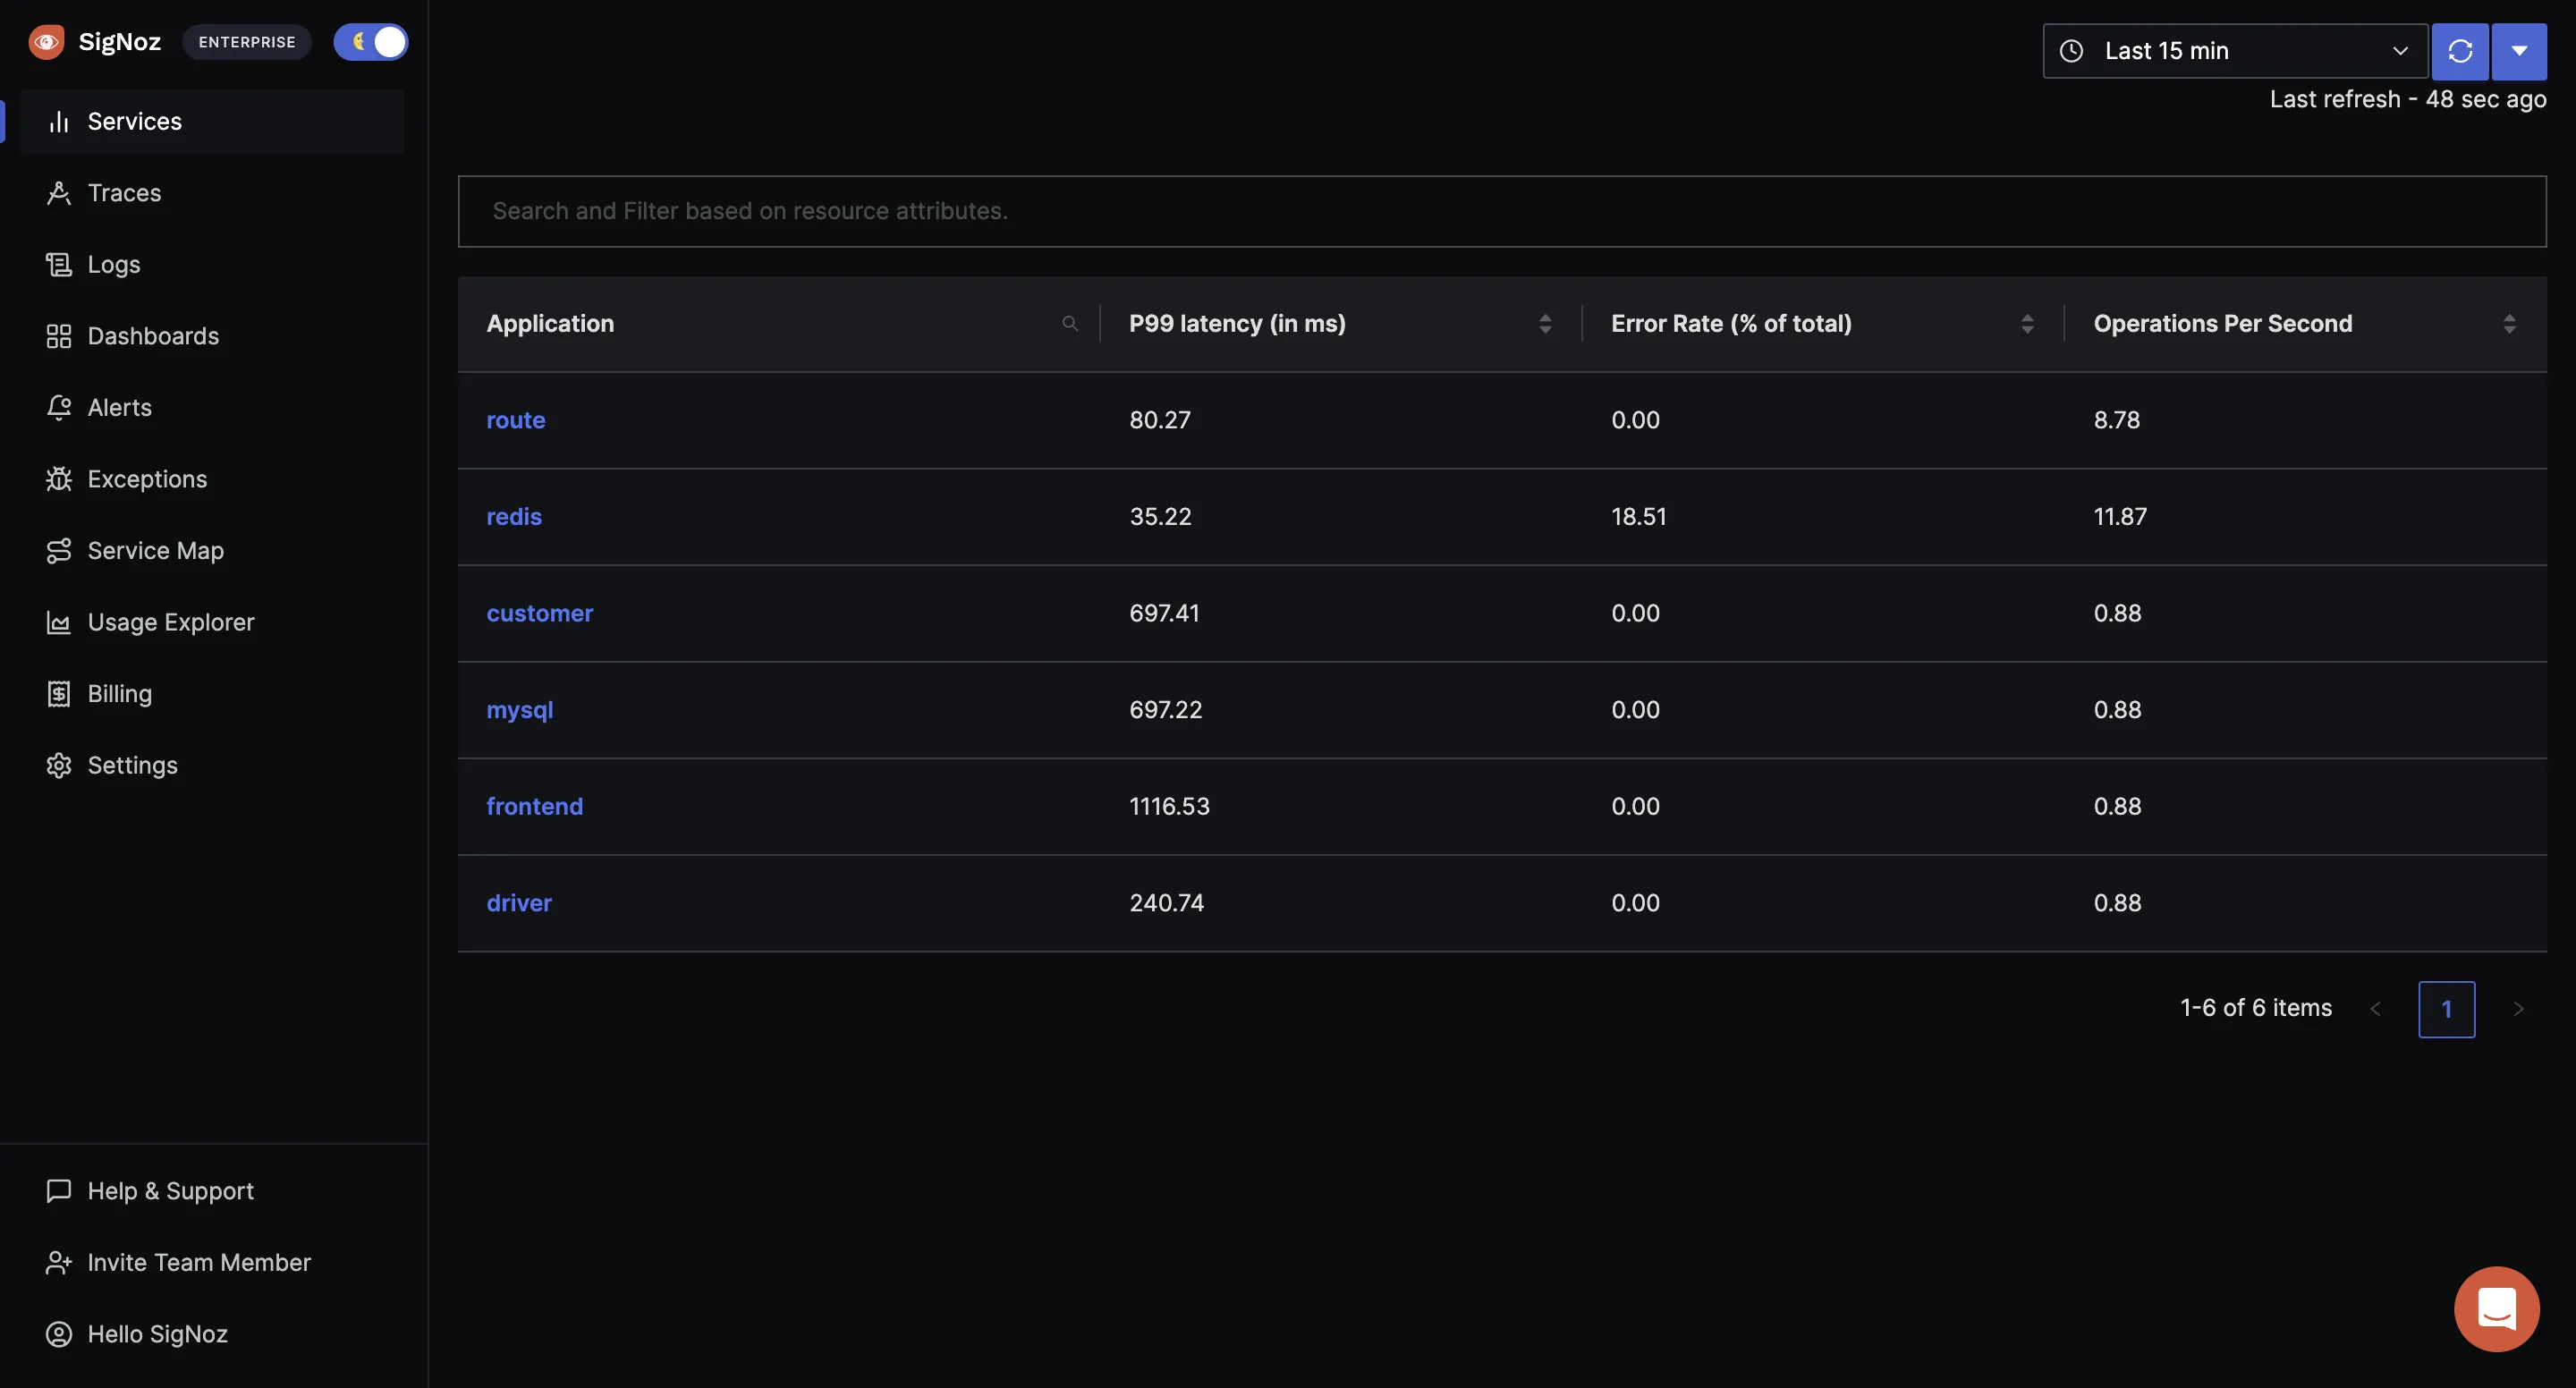
In a logs performance benchmark with other open source tools like ELK and Loki, we found SigNoz to be much more efficient at ingestion, storage, and querying.
SigNoz uses OpenTelemetry for generating and collecting telemetry signals. OpenTelemetry provides a handy OpenTelemetry collector which you can configure to collect logs and metrics. If you want to move out of your current logging setup, you just have to change some configuration files to start sending logs to SigNoz.
SigNoz also supports PromQL and Prometheus metrics. It is easy to get started with SigNoz.
Both tools also have broader roundups and related comparisons worth a look: the Prometheus alternatives and Loki alternatives guides, plus OpenTelemetry vs Prometheus and Datadog vs Prometheus.
Getting Started with SigNoz
SigNoz Cloud is the easiest way to run SigNoz. Sign up for a free account and get 30 days of unlimited access to all features.

You can also install and self-host SigNoz yourself since it is open-source. With 24,000+ GitHub stars, open-source SigNoz is loved by developers. Find the instructions to self-host SigNoz.
Related Posts
