Memcached Metrics Monitoring with OpenTelemetry
Let's dive deep into the realm of Memcached, where we'll uncover the power of monitoring with OpenTelemetry and SigNoz. This isn't just about caching data; it's about watching over Memcached like a vigilant guardian, ensuring it performs at its best, and optimizing your application's speed.

In this tutorial, you will install OpenTelemetry Collector to collect Memcached metrics that should be monitored for performance and then send the collected data to SigNoz for visualization and alerts.
We will cover:
- A Brief Overview of Memcached
- A Brief Overview of OpenTelemetry
- What is OpenTelemetry Collector?
- How does OpenTelemetry Collector collect data?
- Prerequisites
- Setting up SigNoz
- Setting Up OpenTelemetry Collector
- Monitoring with SigNoz Dashboard
- Reference - Metrics & Attributes for Memcached supported by OpenTelemetry
- Conclusion
- Further Reading
If you want to jump straight into implementation, start with this prerequisites section.
A Brief Overview of Memcached
Memcached isn't just a fancy speed booster; it's your application's performance superhero. Imagine it as the trusty sidekick that remembers everything, so your app doesn't have to go on a data-fetching quest every time.
Why Memcached Matters
Memcached is like the secret sauce for web developers. It's a high-performance, memory-based caching system designed to give your dynamic web applications a serious speed injection. It does this by storing frequently used data in its memory, acting as a turbocharger for your app's responsiveness.
The Developer's Delight:
Developers adore Memcached for its simplicity and efficiency. No complex setup or mind-boggling configurations – it just works. Picture Memcached as the traffic manager of your app, reducing congestion in the database and ensuring a smooth flow of information. It's the kind of tool that doesn't just make your app fast; it makes it effortlessly fast.
Picture this: your app is like a bustling city, and Memcached is the traffic manager, ensuring that data moves smoothly and quickly. It's all about reducing the congestion in your database and giving your users a seamless experience.
Flexibility on Your Terms:
What's cool about Memcached is its flexibility. It supports various data structures, giving developers the freedom to organize and retrieve data as they see fit. It's like having a toolkit that adapts to your coding style, making it a favorite among those in the know.
In a nutshell, Memcached is your go-to ally for making sure your app feels snappy and responsive. But what if Memcache goes down or slows down your whole architecture because of some issues somewhere? That is why monitoring Memcached is very important. We will now discuss how you can monitor it with OpenTelemetry & Signoz.
A Brief Overview of OpenTelemetry
OpenTelemetry is a set of APIs, SDKs, libraries, and integrations aiming to standardize the generation, collection, and management of telemetry data(logs, metrics, and traces). It is backed by the Cloud Native Computing Foundation and is the leading open-source project in the observability domain.
The data you collect with OpenTelemetry is vendor-agnostic and can be exported in many formats. Telemetry data has become critical in observing the state of distributed systems. With microservices and polyglot architectures, there was a need to have a global standard. OpenTelemetry aims to fill that space and is doing a great job at it thus far.
In this tutorial, you will use OpenTelemetry Collector to collect Memcached metrics for performance monitoring.
What is OpenTelemetry Collector?
OpenTelemetry Collector is a stand-alone service provided by OpenTelemetry. It can be used as a telemetry-processing system with a lot of flexible configurations to collect and manage telemetry data.
It can understand different data formats and send it to different backends, making it a versatile tool for building observability solutions.
Read our complete guide on OpenTelemetry Collector
How does OpenTelemetry Collector collect data?
A receiver is how data gets into the OpenTelemetry Collector. Receivers are configured via YAML under the top-level receivers tag. There must be at least one enabled receiver for a configuration to be considered valid.
Here’s an example of an otlp receiver:
receivers:
  otlp:
    protocols:
      grpc:
      http:
An OTLP receiver can receive data via gRPC or HTTP using the OTLP format. There are advanced configurations that you can enable via the YAML file.
Here’s a sample configuration for an otlp receiver.
receivers:
  otlp:
    protocols:
      http:
        endpoint: "localhost:4318"
        cors:
          allowed_origins:
            - http://test.com
            # Origins can have wildcards with *, use * by itself to match any origin.
            - https://*.example.com
          allowed_headers:
            - Example-Header
          max_age: 7200
You can find more details on advanced configurations here.
After configuring a receiver, you must enable it. Receivers are enabled via pipelines within the service section. A pipeline consists of a set of receivers, processors, and exporters.
The following is an example pipeline configuration:
service:
  pipelines:
    metrics:
      receivers: [otlp, prometheus]
      exporters: [otlp, prometheus]
    traces:
      receivers: [otlp, jaeger]
      processors: [batch]
      exporters: [otlp, zipkin]
Now that you understand how OpenTelemetry collector collects data let’s see how you can collect Memcached metrics with OpenTelemetry.
Prerequisites
This tutorial assumes that the OpenTelemetry Collector is installed on the same host as the Memcached instance. If that’s your case as well, you can skip the following step.
Access for OpenTelemetry -
Memcached typically does not have built-in user management or authentication mechanisms. It is designed to be a simple key-value store and caching system without native support for user authentication. So if your Memcached machine is different, you need to allow the port of Memcached service for your specific OpenTelemetry Collector installed server only.
💡 It is strongly advised not to open this port to the public. You can open it for specific IPs or private cloud only.
Open TCP port 11211 - The OpenTelemetry Collector for Memcached communicates with the service over TCP port. Therefore, you need to open the port.
To open TCP port 11211 on a Linux server, you can use the following command:
sudo ufw allow 11211/tc
If you are using some firewall for your VMs to block inbound traffic, you would need to allow 11211 port.
Once you have completed these preparations, you can install and run the OpenTelemetry Collector for Memcached.
Setting up SigNoz
You need a backend to which you can send the collected data for monitoring and visualization. SigNoz is an OpenTelemetry-native APM that is well-suited for visualizing OpenTelemetry data.
SigNoz cloud is the easiest way to run SigNoz. You can sign up here for a free account and get 30 days of unlimited access to all features.
You can also install and self-host SigNoz yourself. Check out the docs for installing self-host SigNoz.
Setting Up OpenTelemetry Collector
The OpenTelemetry Collector offers various deployment options to suit different environments and preferences. It can be deployed using Docker, Kubernetes, Nomad, or directly on Linux systems. You can find all the installation options here.
We are going to discuss the manual installation here and resolve any hiccups that come in the way.
Step 1 - Downloading OpenTelemetry Collector
Download the appropriate binary package for your Linux or macOS distribution from the OpenTelemetry Collector releases page. We are using the latest version available at the time of writing this tutorial.
For MACOS (arm64):
curl --proto '=https' --tlsv1.2 -fOL https://github.com/open-telemetry/opentelemetry-collector-releases/releases/download/v0.116.0/otelcol-contrib_0.116.0_darwin_arm64.tar.gz
Step 2 - Extracting the package
Create a new directory named otelcol-contrib and then extract the contents of the otelcol-contrib_0.116.0_darwin_arm64.tar.gz archive into this newly created directory with the following command:
mkdir otelcol-contrib && tar xvzf otelcol-contrib_0.116.0_darwin_arm64.tar.gz -C otelcol-contrib
Step 3 - Setting up the Configuration file
Create a config.yaml file in the otelcol-contrib folder. This configuration file will enable the collector to connect with Memcached and have other settings like at what frequency you want to monitor the instance.
The config file has a receiver enabled for hostmetrics too which will enable you to
Go into the directory:
cd otelcol-contrib
Create config.yaml in folder otelcol-contrib with the below content in it.
receivers:
  hostmetrics:
    collection_interval: 30s
    scrapers:
      cpu: {}
      disk: {}
      load: {}
      filesystem: {}
      memory: {}
      network: {}
      paging: {}
      process:
        mute_process_name_error: true
        mute_process_exe_error: true
        mute_process_io_error: true
      processes: {}
  memcached:
    endpoint: "<MEMCACHED_URL>:<MEMCACHED_PORT>"
    collection_interval: 10s
processors:
  batch:
    send_batch_size: 1000
    timeout: 10s
  # Ref: https://github.com/open-telemetry/opentelemetry-collector-contrib/blob/main/processor/resourcedetectionprocessor/README.md
  resourcedetection:
    detectors: [env, system, ec2] # include ec2 for AWS, gcp for GCP and azure for Azure.
    # Using OTEL_RESOURCE_ATTRIBUTES envvar, env detector adds custom labels.
    timeout: 2s
		override: false
    system:
      hostname_sources: [os] # alternatively, use [dns,os] for setting FQDN as host.name and os as fallback
exporters:
  otlp:
    endpoint: "ingest.{region}.signoz.cloud:443" # replace {region} with your region
    tls:
      insecure: false
    headers:
      "signoz-ingestion-key": <SIGNOZ_INGESTION_KEY>
  debug:
    verbosity: detailed
service:
  telemetry:
    metrics:
      address: localhost:8888
  pipelines:
    metrics:
      receivers: [memcached]
      processors: [batch]
      exporters: [otlp]
    metrics/hostmetrics:
      receivers: [hostmetrics]
      processors: [resourcedetection, batch]
      exporters: [otlp]
You would need to replace the following details for the config to work properly:
- Endpoint for your Memcached instance. In place of MEMCACHED_URL and port in place of MEMCACHED_PORT
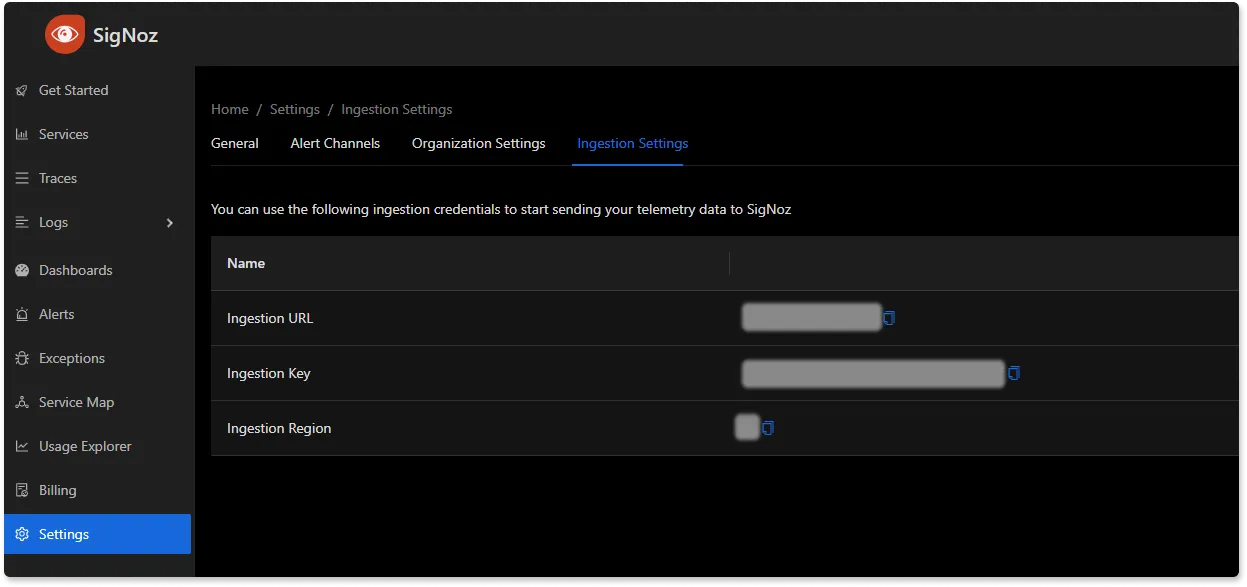
- Under exporters, configure the
endpointfor SigNoz cloud along with the ingestion key undersignoz-ingestion-key. You can find these settings in the SigNoz dashboard.
Also note how we have set up the pipeline in the service section of the config. We have added memcached in the receiver section of metrics and set the exporter to otlp.
Step 4 - Running the collector service
Every Collector release includes an otelcol executable that you can run. Since we’re done with configurations, we can now run the collector service with the following command.
From the otelcol-contrib, run the following command:
./otelcol-contrib --config ./config.yaml
If you want to run it in the background:
./otelcol-contrib --config ./config.yaml &> otelcol-output.log & echo "$\!" > otel-pid
Step 5 - Debugging the output
If you want to see the output of the logs, we’ve just set up for the background process. You may look it up with:
tail -f -n 50 otelcol-output.log
tail 50 will give the last 50 lines from the file otelcol-output.log
You can check if your service is running successfully by seeing the last log something like -
2023-11-17T19:33:20.161Z info service@v0.116.0/service.go:169 Everything is ready. Begin running and processing data.
You can stop the collector service with the following command:
kill "$(< otel-pid)"
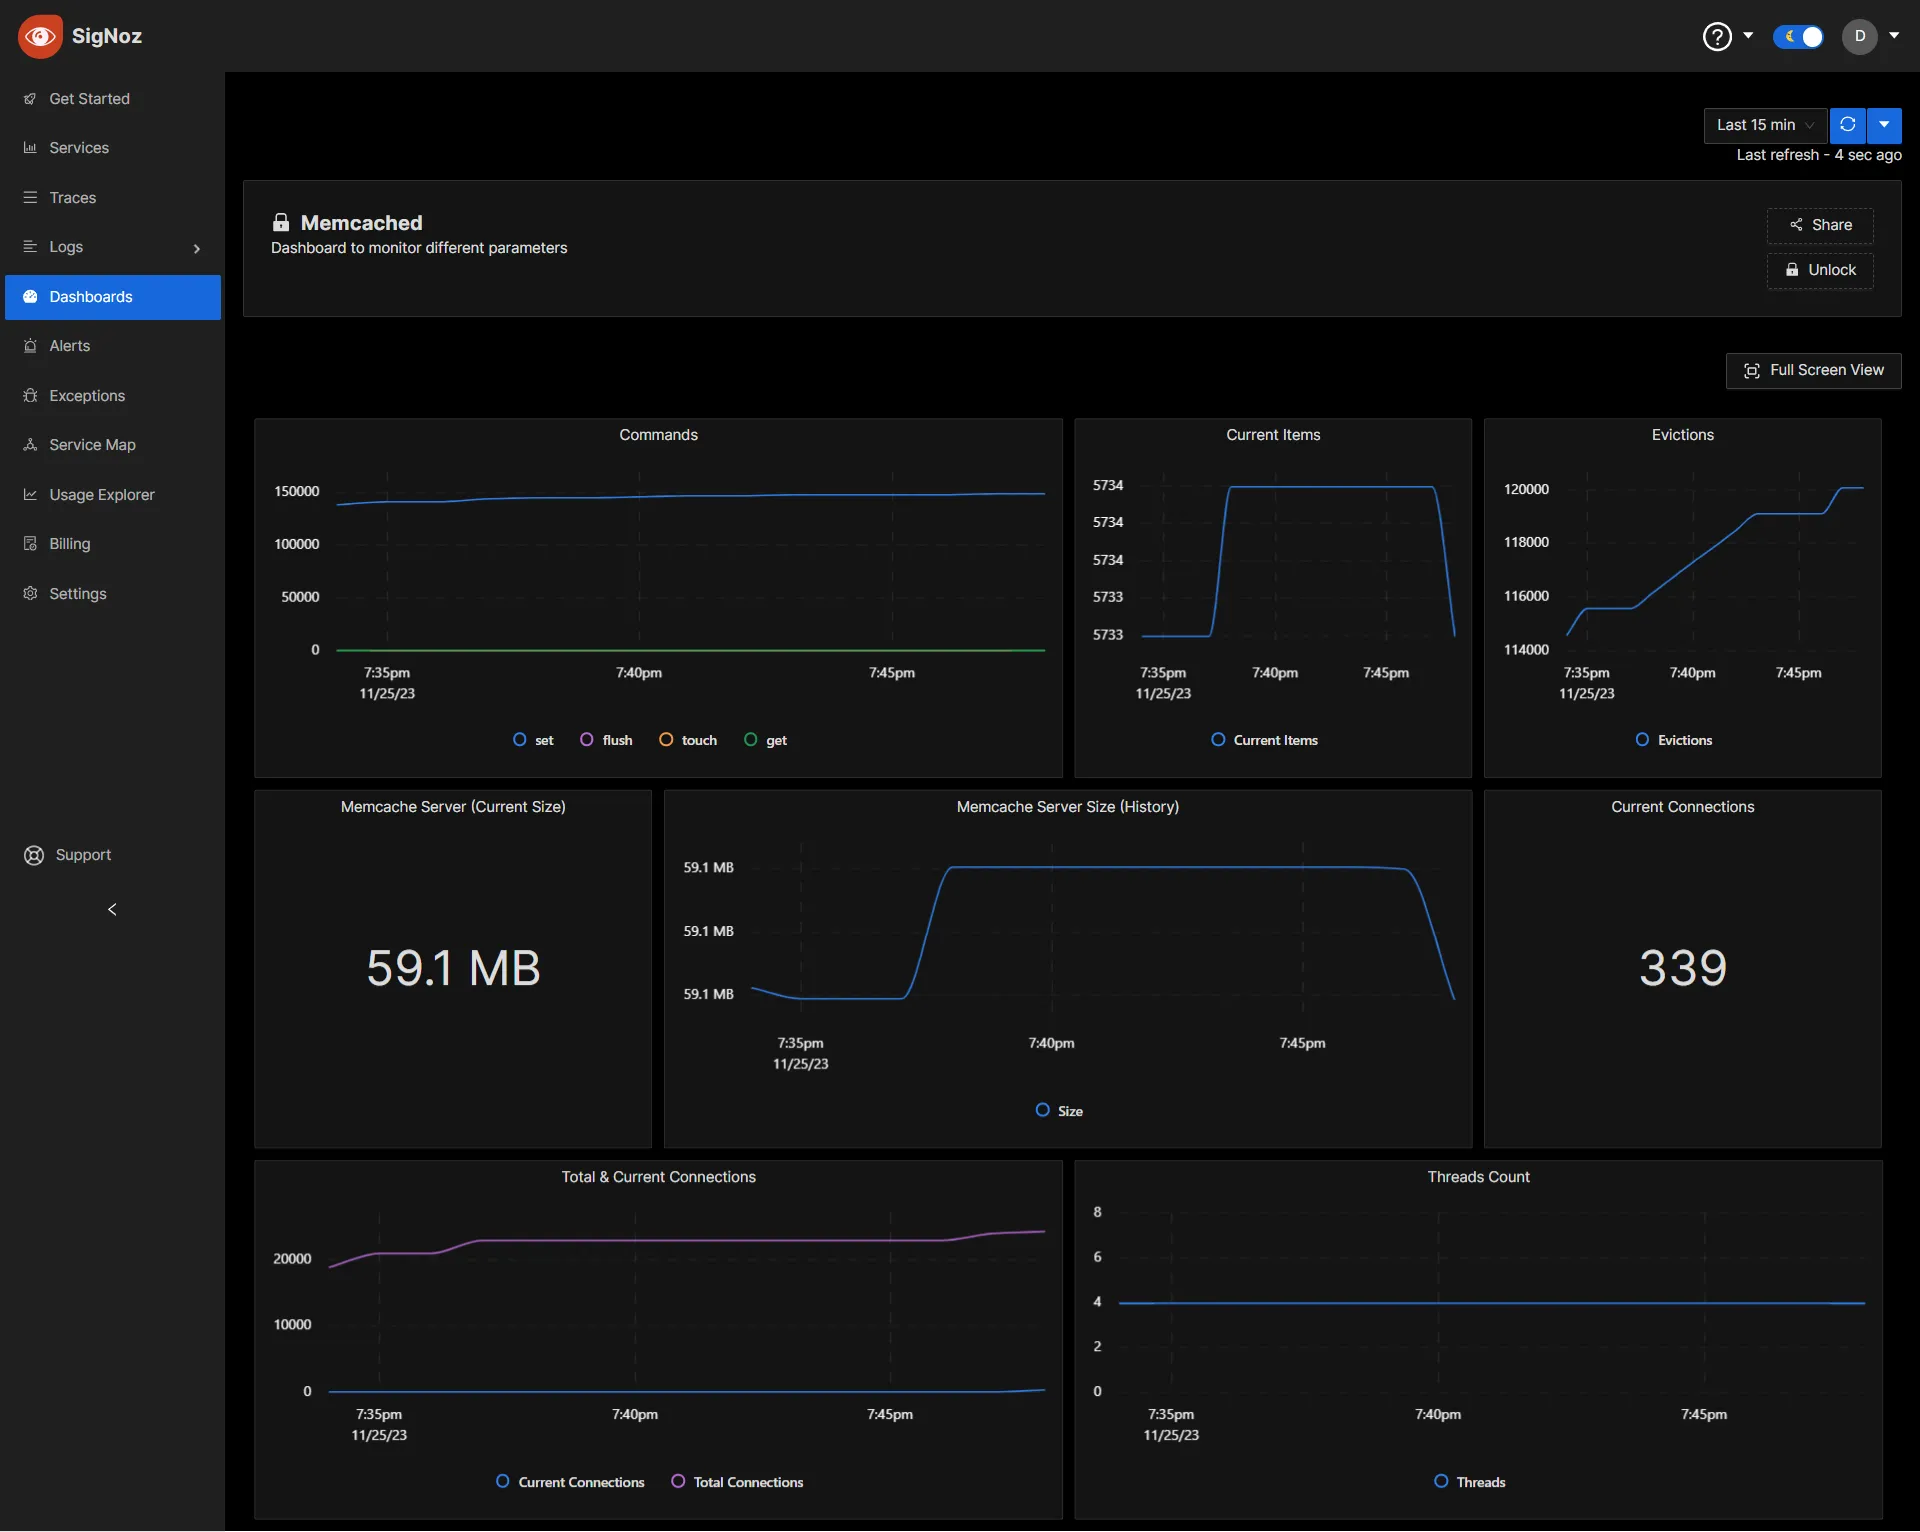
Monitoring with SigNoz Dashboard
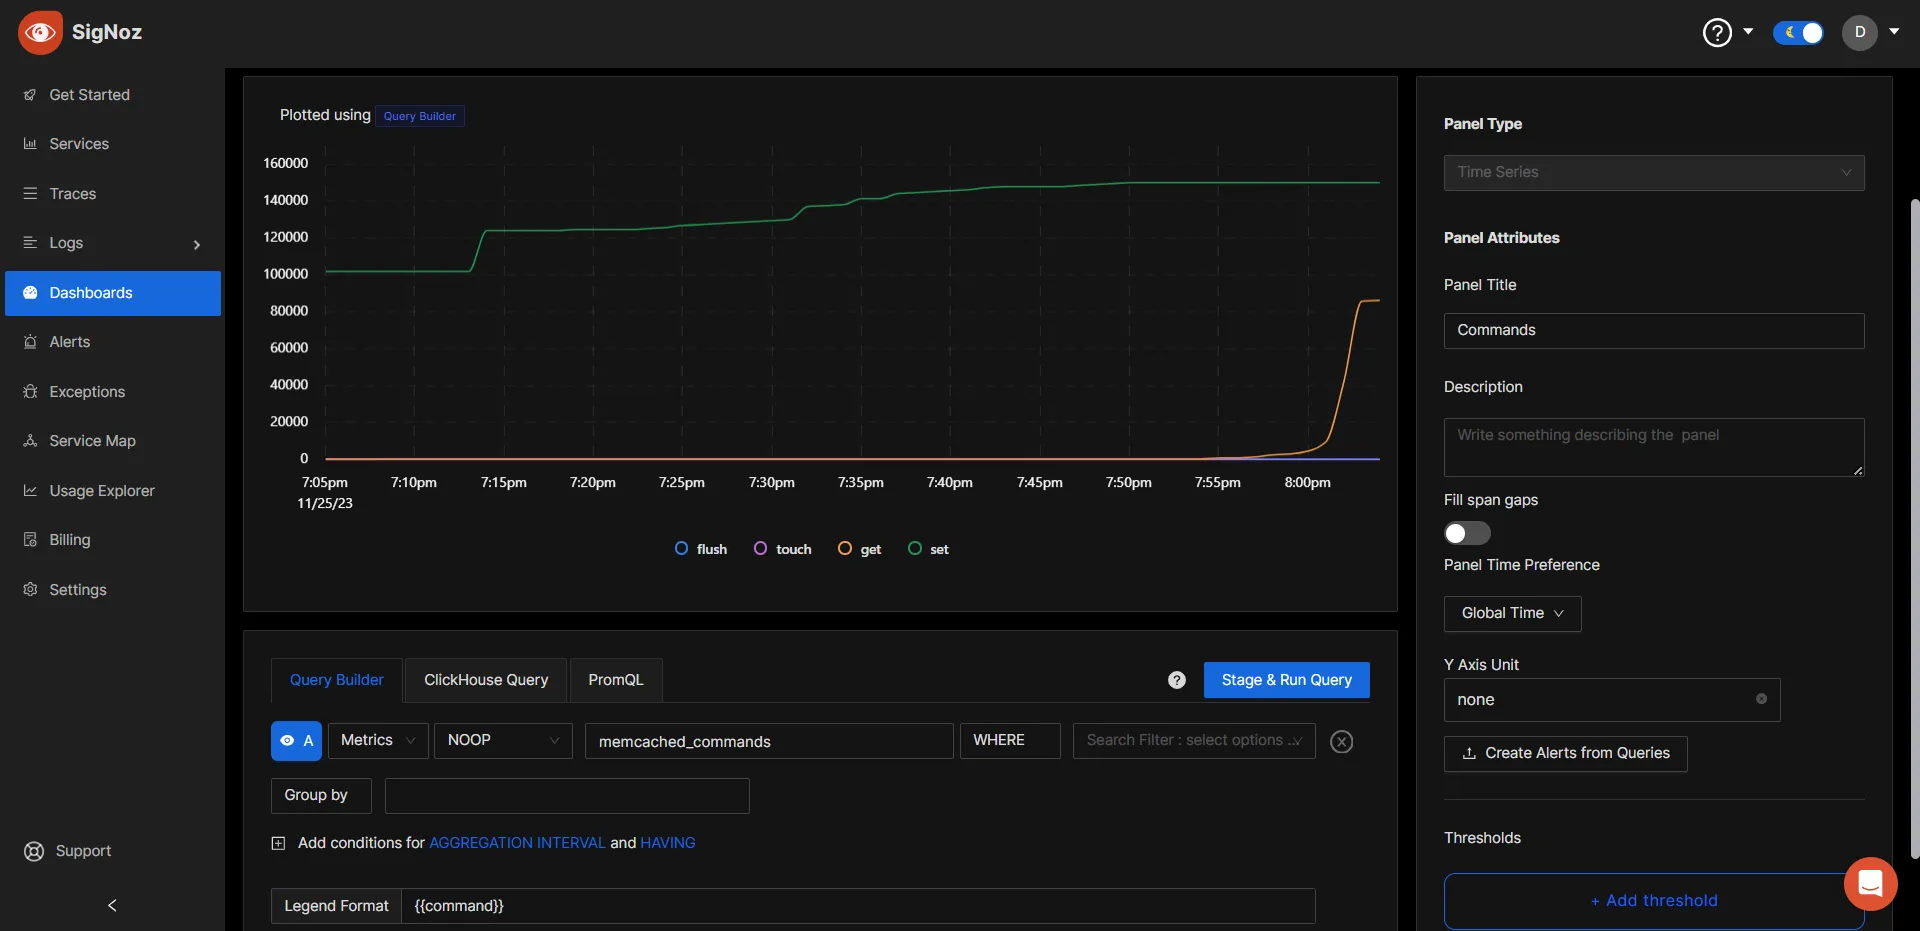
Once the above setup is done, you will be able to access the metrics in the SigNoz dashboard. You can go to the Dashboards tab and try adding a new panel. You can learn how to create dashboards in SigNoz here.
Memcached Metrics
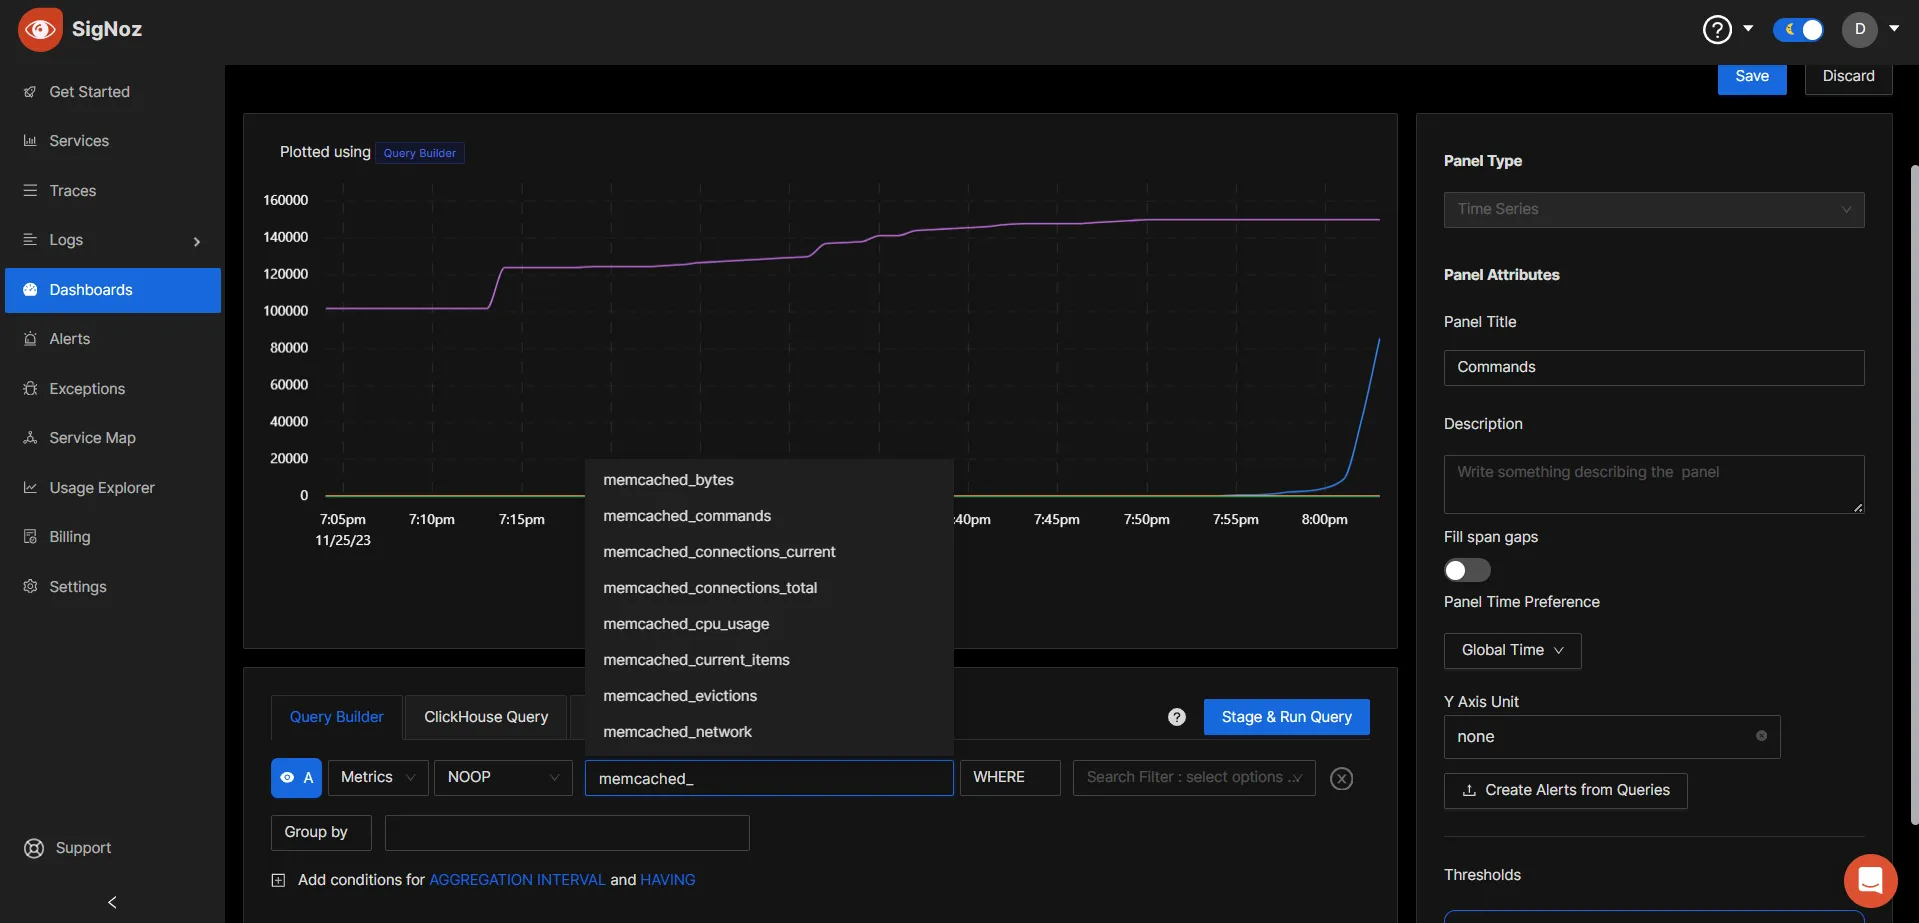
Signoz Panel
Dashboard JSON
If you want to get started quickly with Memcached monitoring, you can load this JSON in SigNoz dashboard and get started.
Reference - Metrics & Attributes for Memcached supported by OpenTelemetry
The following metrics and resource attributes for Memcached can be collected by the Opentelemetry Collector.
Metrics
These metrics are enabled by default. Collectors provide many metrics that you can use to monitor how your Memcached server is performing or if something is not right.
| Metric | Description | Name | Type | Value Type | Unit | Temporality | Monotonic |
|---|---|---|---|---|---|---|---|
| Current Stored Bytes | Current number of bytes used by this server to store items | memcached.bytes | GAUGE | INT | Bytes | N/A | false |
| Commands executed | Commands executed history | memcached.commands | SUM | INT | NONE | Cumulative | true |
| Open Connections Count | The current number of open connections | memcached.connections.current | SUM | INT | NONE | Cumulative | false |
| Total Connections Opened | Total number of connections opened since the server started running | memcached.connections.total | SUM | INT | NONE | Cumulative | true |
| CPU Usage | Accumulated user and system time | memcached.cpu.usage | SUM | DOUBLE | Seconds | Cumulative | true |
| Currently Items Stored Count | Number of items currently stored in the cache | memcached.current_items | SUM | INT | NONE | Cumulative | false |
| Evictions Count | Cache item evictions | memcached.evictions | SUM | INT | NONE | Cumulative | true |
| Network Bytes transferred | Bytes transferred over the network | memcached.network | SUM | INT | Bytes | Cumulative | true |
| Operations Hit Ratio | Hit ratio for operations, expressed as a percentage value between 0.0 and 100.0 | memcached.operation_hit_ratio | GAUGE | DOUBLE | Percentage | N/A | false |
| Operation Counts | Operation counts | memcached.operations | SUM | INT | NONE | Cumulative | true |
| Threads Used Count | Number of threads used by the memcached instance | memcached.threads | SUM | INT | NONE | Cumulative | false |
Attributes
| Metric | Attribute | Description | Value Type | Values |
|---|---|---|---|---|
| Commands executed | command | The type of command. | STRING | get, set, flush, touch |
| CPU Usage | state | The type of CPU usage. | STRING | system, user |
| Network Bytes transferred | direction | Direction of data flow. | STRING | sent, received |
| Operations Hit Ratio | operation | The type of operation. | STRING | increment, decrement, get |
| Operation Counts | type | Result of cache request. | STRING | hit, miss |
| Operation Counts | operation | The type of operation. | STRING | increment, decrement, get |
Key Terms for Metrics & Attributes
Name: The name of the metric is a unique identifier that distinguishes it from other metrics. It helps in referencing and organizing various metrics on SigNoz as well.
Type: The type of metric defines the kind of data it represents. Common metric types include INT, DOUBLE, STRING, etc.
Unit: The unit specifies the measurement unit associated with the metric. It helps in interpreting and comparing metric values, including Bytes, NONE, etc.
Temporality: It involves understanding the temporal patterns and fluctuations within the data, providing insights into how the metric evolves over time. Temporality is crucial for analyzing trends, identifying patterns, and making informed decisions based on the temporal behavior of the observed metric.
Monotonicity: It refers to the cumulative nature of a metric, indicating that its values continuously increase or remain non-decreasing over time. This property is crucial for tracking cumulative values, such as the total count of events or occurrences.
These are the currently supported metrics at the time the article is written. Check the OpenTelemetry Collector Contrib repo for any updates.
Conclusion
In this article, we’ve discussed a 101 guide to start with Memcached metrics using Signoz dashboards. But your journey doesn't have to end here. The world of monitoring and observability is vast and ever-evolving. Dive deeper, explore advanced metrics, and fine-tune your monitoring setup to fit your specific needs. This is where the magic happens, where you turn data into insights that drive better decisions and improved system performance.
Visit our complete guide on OpenTelemetry Collector to learn more about it. OpenTelemetry is quietly becoming the world standard for open-source observability, and by using it, you can have advantages like a single standard for all telemetry signals, no vendor lock-in, etc.
SigNoz is an open-source OpenTelemetry-native APM that can be used as a single backend for all your observability needs.
Further Reading
Complete Guide on OpenTelemetry Collector
